비유전자 재조합 단백질 가수분해물 시장 : 기회, 성장 요인, 업계 동향 분석 및 예측(2025-2034년)
Non-GMO Protein Hydrolysates Market Opportunity, Growth Drivers, Industry Trend Analysis, and Forecast 2025 - 2034
상품코드:1885889
리서치사:Global Market Insights Inc.
발행일:2025년 11월
페이지 정보:영문 210 Pages
라이선스 & 가격 (부가세 별도)
ㅁ Add-on 가능: 고객의 요청에 따라 일정한 범위 내에서 Customization이 가능합니다. 자세한 사항은 문의해 주시기 바랍니다.
한글목차
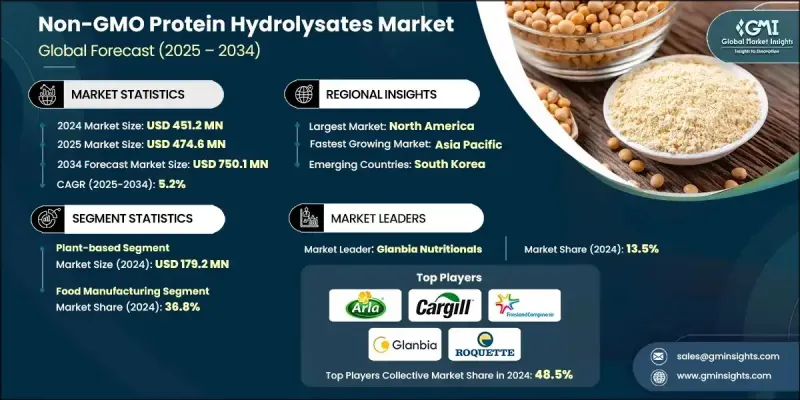
세계의 비유전자 재조합 단백질 가수분해물 시장은 2024년에 4억 5,120만 달러로 평가되었고, 2034년까지 연평균 복합 성장률(CAGR)은 5.2%를 나타낼 것으로 예측되며 7억 5,010만 달러로 성장할 전망입니다.
이 가수분해물은 비유전자 재조합 원료로 생산되며, 소화율, 기능성 및 클린 라벨 제품 기준과의 호환성을 높이기 위해 제어된 가수분해 과정을 거칩니다. 천연 및 비유전자 재조합(Non-GMO) 제형에 대한 관심이 높아지면서 식품 및 음료 응용 부문, 스포츠 영양제, 건강기능식품 전반에 걸쳐 수요가 증가하고 있습니다. 북미는 엄격한 원료 규제와 프리미엄급 가수분해물 생산이 가능한 잘 구축된 제조 인프라로 인해 최대 지역 시장을 차지하고 있습니다. 한편 아시아태평양 지역은 급속한 도시화, 가처분 소득 증가, 식품 안전 및 농업 지속가능성에 대한 관심 증대로 가장 빠른 성장세를 지속하고 있습니다. 인도, 중국 등 국가의 정부 정책은 비유전자 재조합 단백질 원료에 대한 소비자 신뢰를 더욱 공고히 합니다. 식품 불내증 및 알레르기 증가 역시 생산자들이 비유전자 재조합 가수분해물에 크게 의존하는 저알레르기성 및 소화 용이성 대체재 우선화를 촉진하고 있습니다. 특히 스포츠 및 활동적 라이프스타일 영양 부문에서 소비자들이 합성 또는 유전자 변형 성분 없이 성능 향상을 제공하는 원료를 지속적으로 찾는 점에서 관심이 두드러집니다.
시장 범위
시작 연도
2024년
예측 연도
2025-2034년
시작 가치
4억 5,120만 달러
예측 가치
7억 5,010만 달러
CAGR
5.2%
식물성 카테고리는 2024년 1억 7,920만 달러를 창출했으며, 이는 지속 가능하게 조달된 비유전자 재조합 단백질 원료에 대한 강력한 수요를 반영합니다. 자연적이고 투명한 성분 목록에 대한 선호도가 높아지면서 소비자들은 윤리적 기준과 클린 라벨 기대에 부합하는 식물 유래 가수분해물을 선호하게 되었습니다.
식품 제조 부문은 2024년 36.8%의 점유율을 차지했습니다. 이 부문은 포장 식품에서 알레르기 유발 물질이 없고 천연 성분에 대한 수요 증가를 충족시키면서 질감, 영양가, 풍미를 향상시키는 기능성 성분으로 가수분해물의 사용이 증가함에 따라 혜택을 보고 있습니다.
북미의 비유전자 재조합 단백질 가수분해물 시장은 2025년부터 2034년까지 연평균 복합 성장률(CAGR)은 5.3%로 확대될 것으로 예측됩니다. 이 지역에서는 소비자의 높은 인식과 클린 라벨, 알레르기 유발 물질에 대한 경각심이 높아지는 추세에 힘입어 기능성 식품, 특수 영양제, 보충제 제품에 이러한 가수분해물을 지속적으로 도입하고 있습니다. 효소 가수분해 및 지속 가능한 추출 방법의 발전으로 진화하는 웰니스 트렌드에 부합하는 고품질 생리활성 성분이 생산되고 있습니다.
목차
제1장 조사 방법과 범위
제2장 주요 요약
제3장 업계 인사이트
생태계 분석
공급자의 상황
이익률
각 단계의 부가가치
밸류체인에 영향을 주는 요인
혁신
업계에 미치는 영향요인
성장 촉진요인
클린 라벨 및 비유전자 재조합 제품에 대한 소비자 수요 증가
음식 알레르기 및 불내증 증가 경향
스포츠 영양 및 활동적인 라이프스타일 시장 성장
업계의 잠재적 위험 및 과제
높은 생산 비용 및 프리미엄 가격 책정
비유전자 재조합 원료의 이용 가능성 제한
시장 기회
동물 사료 응용 부문 확대
맞춤형 영양 부문의 신흥 응용 부문
성장 가능성 분석
규제 상황
북미
유럽
아시아태평양
라틴아메리카
중동 및 아프리카
Porter's Five Forces 분석
PESTEL 분석
기술과 혁신 동향
현재의 기술 동향
신흥 기술
가격 동향
지역별
원료별
장래 시장 동향
특허 동향
무역 통계(HS코드)(참고 : 무역 통계는 주요 국가에서만 제공됨)
주요 수입국
주요 수출국
지속가능성과 환경면
지속가능한 대처
폐기물 감축 전략
생산의 에너지 효율
환경에 배려한 대처
탄소발자국 고려
제4장 경쟁 구도
소개
기업의 시장 점유율 분석
지역별
북미
유럽
아시아태평양
라틴아메리카
중동 및 아프리카
기업 매트릭스 분석
주요 시장 기업의 경쟁 분석
경쟁 포지셔닝 매트릭스
주요 발전
합병 및 인수
제휴 및 협업
신제품 발매
확대 계획
제5장 시장 추계 및 예측 : 원료별(2021-2034년)
주요 동향
식물성
완두콩 단백질 가수분해물
콩 단백질 가수분해물
쌀 단백질 가수분해물
밀/글루텐 가수분해물
동물성
우유 단백질 가수분해물(유청, 카제인)
고기 단백질 가수분해물
계란 단백질 가수분해물
해양 유래
어류 단백질 가수분해물
콜라겐 가수분해물
기타
제6장 시장 추계 및 예측 : 용도별(2021-2034년)
주요 동향
치료 및 의료 용도
영유아 및 소아 영양
성인용 임상영양
특정 의료용 식품
소비자용 영양 및 건강 용도
스포츠 및 퍼포먼스 영양
일반 건강 및 웰빙
식품 제조 용도
가공 식품 원료
음료 원료
풍미 및 식감 향상
동물 영양 용도
반려동물 사료
가축 사료
수산 양식 사료
기타
제7장 시장 추계 및 예측 : 지역별(2021-2034년)
주요 동향
북미
미국
캐나다
유럽
독일
영국
프랑스
스페인
이탈리아
기타 유럽
아시아태평양
중국
인도
일본
호주
한국
기타 아시아태평양
라틴아메리카
브라질
멕시코
아르헨티나
기타 라틴아메리카
중동 및 아프리카
사우디아라비아
남아프리카
아랍에미리트(UAE)
기타 중동 및 아프리카
제8장 기업 프로파일
Arla Foods Ingredients Group
Carbery
Cargill Inc.
Chaitanya Agro Biotech Pvt. Ltd.
FrieslandCampina
Glanbia Nutritionals
International Flavors & Fragrances Inc
Roquette Freres
Tatua Co-operative Dairy Company Limited
Titan Biotech
HBR
영문 목차
영문목차
The Global Non-GMO Protein Hydrolysates Market was valued at USD 451.2 million in 2024 and is estimated to grow at a CAGR of 5.2% to reach USD 750.1 million by 2034.
These hydrolysates are produced from non-genetically modified sources and undergo controlled hydrolysis to enhance digestibility, functionality, and compatibility with clean-label product standards. Rising interest in natural and non-GMO formulations is strengthening demand across food and beverage applications, sports nutrition, and dietary supplements. North America represents the largest regional market due to strict ingredient regulations and a well-developed manufacturing framework capable of producing premium-grade hydrolysates. Meanwhile, Asia Pacific continues to grow at the fastest pace, supported by rapid urbanization, higher disposable incomes, and increased focus on food safety and agricultural sustainability. Government measures across countries such as India and China further reinforce consumer trust in non-GMO protein ingredients. The rise in food intolerances and allergies is also influencing producers to prioritize hypoallergenic and easily digestible alternatives, which rely heavily on non-GMO hydrolysates. Interest is especially notable in sports and active lifestyle nutrition, where shoppers consistently seek ingredients that deliver performance benefits without synthetic or genetically modified components.
Market Scope
Start Year
2024
Forecast Year
2025-2034
Start Value
$451.2 Million
Forecast Value
$750.1 Million
CAGR
5.2%
The plant-based category generated USD 179.2 million in 2024, reflecting strong demand for sustainably sourced, GMO-free protein inputs. Growing preference for natural and transparent ingredient lists has led consumers to favor plant-derived hydrolysates that align with ethical and clean-label expectations.
The food manufacturing segment held a 36.8% share in 2024. This segment benefits from increasing use of hydrolysates as functional components that enhance texture, nutritional value, and flavor while meeting rising demand for allergen-friendly and natural ingredients in packaged foods.
North America Non-GMO Protein Hydrolysates Market is projected to grow at a 5.3% CAGR between 2025 and 2034. The region continues to adopt these hydrolysates in functional foods, specialized nutrition, and supplement products, driven by strong consumer awareness and rising preference for clean-label, allergen-conscious options. Advances in enzymatic hydrolysis and sustainable extraction methods are producing higher-quality bioactive ingredients suited to evolving wellness trends.
Leading companies in the Non-GMO Protein Hydrolysates Market include Cargill Inc., Titan Biotech, Glanbia Nutritionals, Roquette Freres, Chaitanya Agro Biotech Pvt. Ltd., FrieslandCampina, International Flavors & Fragrances Inc., Carbery, Tatua Co-operative Dairy Company Limited, and Arla Foods Ingredients Group. Companies are strengthening their competitive position by expanding product lines that feature clean-label, allergen-friendly, and sustainably sourced hydrolysates tailored to food, supplement, and medical nutrition applications. Many firms are investing in advanced enzymatic processing technologies to improve flavor, solubility, and bioactive peptide profiles, enabling higher-value formulations. Strategic collaborations with food manufacturers and wellness brands are helping companies secure long-term supply partnerships. Firms are also emphasizing rigorous quality certification and transparent sourcing practices to reinforce consumer trust in non-GMO ingredients.
Table of Contents
Chapter 1 Methodology & Scope
1.1 Market scope and definition
1.2 Research design
1.2.1 Research approach
1.2.2 Data collection methods
1.3 Data mining sources
1.3.1 Global
1.3.2 Regional/Country
1.4 Base estimates and calculations
1.4.1 Base year calculation
1.4.2 Key trends for market estimation
1.5 Primary research and validation
1.5.1 Primary sources
1.6 Forecast model
1.7 Research assumptions and limitations
Chapter 2 Executive Summary
2.1 Industry 3600 synopsis
2.2 Key market trends
2.2.1 Source trends
2.2.2 Application trends
2.2.3 Regional trends
2.3 TAM Analysis, 2025-2034
2.4 CXO perspectives: strategic imperatives
2.4.1 Executive decision points
2.4.2 Critical success factors
2.5 Future outlook and strategic recommendations
Chapter 3 Industry Insights
3.1 Industry ecosystem analysis
3.1.1 Supplier landscape
3.1.2 Profit margin
3.1.3 Value addition at each stage
3.1.4 Factor affecting the value chain
3.1.5 Disruptions
3.2 Industry impact forces
3.2.1 Growth drivers
3.2.1.1 Rising consumer demand for clean-label & non-GMO products
3.2.1.2 Increasing prevalence of food allergies & intolerances
3.2.1.3 Growing sports nutrition & active lifestyle market
3.2.2 Industry pitfalls and challenges
3.2.2.1 High production costs & premium pricing
3.2.2.2 Limited raw material availability for non-GMO sources
3.2.3 Market opportunities
3.2.3.1 Expansion in animal feed applications
3.2.3.2 Emerging applications in personalized nutrition
3.3 Growth potential analysis
3.4 Regulatory landscape
3.4.1 North America
3.4.2 Europe
3.4.3 Asia Pacific
3.4.4 Latin America
3.4.5 Middle East & Africa
3.5 Porter's analysis
3.6 PESTEL analysis
3.7 Technology and Innovation landscape
3.7.1 Current technological trends
3.7.2 Emerging technologies
3.8 Price trends
3.8.1 By region
3.8.2 By source
3.9 Future market trends
3.10 Patent landscape
3.11 Trade statistics (HS code) ( Note: the trade statistics will be provided for key countries only)
3.11.1 Major importing countries
3.11.2 Major exporting countries
3.12 Sustainability and environmental aspects
3.12.1 Sustainable practices
3.12.2 Waste reduction strategies
3.12.3 Energy efficiency in production
3.12.4 Eco-friendly initiatives
3.13 Carbon footprint consideration
Chapter 4 Competitive Landscape, 2024
4.1 Introduction
4.2 Company market share analysis
4.2.1 By region
4.2.1.1 North America
4.2.1.2 Europe
4.2.1.3 Asia Pacific
4.2.1.4 LATAM
4.2.1.5 MEA
4.3 Company matrix analysis
4.4 Competitive analysis of major market players
4.5 Competitive positioning matrix
4.6 Key developments
4.6.1 Mergers & acquisitions
4.6.2 Partnerships & collaborations
4.6.3 New product launches
4.6.4 Expansion plans
Chapter 5 Market Estimates and Forecast, By Source, 2021-2034 (USD Million) (Kilo Tons)
5.1 Key trends
5.2 Plant-based
5.2.1 Pea protein hydrolysates
5.2.2 Soy protein hydrolysates
5.2.3 Rice protein hydrolysates
5.2.4 Wheat/gluten hydrolysates
5.3 Animal-based
5.3.1 Milk protein hydrolysates (whey, casein)
5.3.2 Meat protein hydrolysates
5.3.3 Egg protein hydrolysates
5.4 Marine-based
5.4.1 Fish protein hydrolysates
5.4.2 Collagen hydrolysates
5.5 Others
Chapter 6 Market Estimates and Forecast, By Application, 2021-2034 (USD Million) (Kilo Tons)
6.1 Key trends
6.2 Therapeutic & medical applications
6.2.1 Infant & pediatric nutrition
6.2.2 Adult clinical nutrition
6.2.3 Foods for special medical purposes
6.3 Consumer nutrition & wellness applications
6.3.1 Sports & performance nutrition
6.3.2 General health & wellness
6.4 Food manufacturing applications
6.4.1 Processed food ingredients
6.4.2 Beverage ingredients
6.4.3 Flavor & texture enhancement
6.5 Animal nutrition applications
6.5.1 Companion animal feed
6.5.2 Livestock feed
6.5.3 Aquaculture feed
6.6 Others
Chapter 7 Market Estimates and Forecast, By Region, 2021-2034 (USD Billion) (Kilo Tons)