ㅁ Add-on 가능: 고객의 요청에 따라 일정한 범위 내에서 Customization이 가능합니다. 자세한 사항은 문의해 주시기 바랍니다.
ㅁ 보고서에 따라 최신 정보로 업데이트하여 보내드립니다. 배송기일은 문의해 주시기 바랍니다.
한글목차
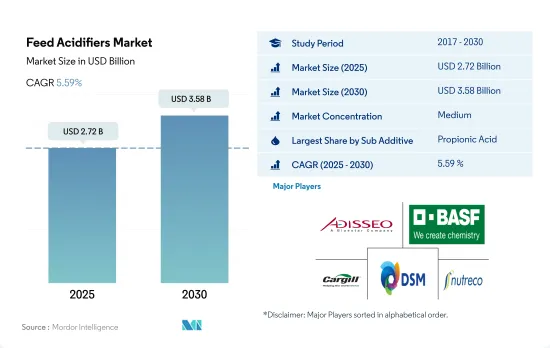
사료용 산미료 시장 규모는 2025년에 27억 2,000만 달러에 달할 것으로 추정됩니다. 2030년에는 35억 8,000만 달러에 이를 것으로 예상되고, 예측 기간(2025-2030년)의 CAGR은 5.59%를 나타낼 것으로 전망됩니다.
사료용 산미료는 동물사료의 중요한 성분으로 성장과 대사를 촉진하고 사료 섭취량을 늘리고 항생제에 대한 의존성을 줄이면서 유해한 병원체로부터 보호합니다. 2022년 사료용 산미료는 세계 사료 첨가물 시장의 7%를 차지하며 세계에서 가장 중요한 사료 첨가물 중 하나가 되었습니다.
아시아태평양은 사료용 산미료의 가장 규모가 큰 지역 시장으로 2022년 시장의 31.3%를 차지했습니다. 북미와 유럽이 근소한 차이를 보이며 시장 점유율은 각각 26.1%와 23%였습니다. 아시아태평양의 점유율이 높은 것은 첨가물의 보급률이 높고 동물의 머리 수가 많기 때문입니다. 미국은 닭고기와 쇠고기와 같은 다양한 육류의 가장 큰 생산국과 수출국 중 하나로 북미를 가장 큰 사료 제조업체 중 하나로 밀어 올렸습니다. 이 지역에서는 고품질 사료를 생산하는 항생제의 대안으로 사료용 산미료의 채택률이 높습니다.
프로피온산은 가장 널리 사용되는 사료용 산미료로, 2022년 세계의 사료용 산미료 시장에서 가장 큰 점유율을 차지하며 8억 달러로 평가되었습니다. 이것은 항균 특성과 낮은 농도에서 곰팡이와 일부 박테리아의 증식을 억제하는 능력 때문입니다. 금액 기준으로 푸마르산과 젖산이 이어집니다.
그 밖의 사료용 산미료 분야는 예측 기간 중 CAGR 5.6%와 같은 정도의 속도로 성장할 것으로 예상되지만, 이는 주로 산미료가 가축 사료의 섭취량과 가축의 생산성을 높이는 능력이 있기 때문입니다.
사료 첨가물의 유익한 사용에 대한 의식 증가, 상업적 농업 동향 증가, 항생제로서 기능하는 산미료의 능력은 예측 기간 동안 CAGR 5.6%로 세계의 사료용 산미료 시장을 견인할 것으로 예상됩니다.
세계의 사료용 산미료 시장은 중요한 사료 첨가물 시장의 하나로 부상해, 2022년에는 세계 사료 첨가물 시장의 7%를 차지했습니다. 사료용 산미료는 동물의 성장과 대사를 촉진하고 세균 등의 유해한 병원체에 대한 저항력을 높임으로써 항생제의 대체품으로서 중요성을 늘렸습니다.
젖산은 입수가 용이하기 때문에 2022년 세계의 사료용 산미료 시장 매출로 34.4%의 최대 점유율을 차지했습니다. 그러나 프로피온산이 가장 급성장하는 시장으로 상승하고 예측 기간 동안 CAGR 5.7%를 나타낼 것으로 예상되고 있습니다.
아시아태평양은 2022년 사료용 산미료 시장에서 세계 최대의 지역으로 7억 2,820만 달러 시장 가치를 차지했습니다. 이 지역 시장 점유율이 높은 것은 보급률이 높고 2022년 사료 생산량이 약 5억톤이었기 때문입니다.
미국은 사료용 산미료 시장에서 세계 최대의 국가로 부상하여 2022년 시장 점유율의 18.3%를 차지해 금액으로 약 4억 달러에 달했습니다. 이 시장 지위는 주로 대규모의 상업적 축산과 이 나라가 축산농장에서 새로운 생산방법의 도입에 주력하고 있기 때문입니다. 일본과 멕시코는 이들 국가의 투자 증가로 예측 기간 동안 성장하고 CAGR 6.3%를 나타낼 것으로 예상됩니다.
세계 인구 증가, 사료 생산 증가, 항생제 대체품으로서의 산미료에 대한 인식 증가는 사료용 산미료 시장을 견인하고 예측 기간 동안 CAGR 5.6%를 나타낼 것으로 예상됩니다.
세계의 사료용 산미료 시장 동향
동물성 단백질 및 계란과 같은 가금류 제품에 대한 높은 수요와 가금류 부문 투자 증가로 인해 가금류 인구가 증가하고 있습니다.
최근에는 닭고기 인구가 크게 증가하고 있는데, 이는 주로 일상식에서 닭고기와 계란 수요가 증가하고 있기 때문입니다. 닭고기 제품으로의 전환은 미국에서 돼지고기와 같은 다른 육류의 가격 상승으로 이어지고 있습니다. 유럽의 닭 계란 소비량도 2017년부터 2021년에 걸쳐 4.6% 증가하여 2021년에는 6,135톤에 달했습니다.
아시아태평양은 최대 가금류 생산국으로 2022년 생산량은 2017년부터 6.6% 증가했습니다. 닭고기 생산량 증가는 돼지고기 공급량을 감소시킨 아프리카 돼지 열이 발생한 후 동물성 단백질에 대한 수요가 높아졌기 때문입니다. 세계 닭고기 생산의 40%를 차지하는 중국은 9억 마리 이상의 채란 닭을 사육하고 있으며, 최대 산란계 양계 센터에서는 연간 6,000만 마리의 병아리를 부화시킬 수 있습니다.
중동도 예측기간(2023-2029년)에 닭고기 생산의 성장이 예상됩니다. 사우디아라비아의 Almarai와 같은 기업은 이 산업에 많은 투자를 하고 있으며, 회사는 생산 확대를 위한 신농장 설립에 11억 2,000만 달러를 투자하고 있습니다.
닭고기 제품 수요 증가와 닭고기 산업에 대한 투자 증가는 사료 생산을 밀어올릴 것으로 예상됩니다. 이것은 예측 기간 동안 세계 시장에서 사료 첨가물 수요를 촉진할 것으로 예상됩니다. 이러한 개발로 가금류 산업은 향후 수년간 크게 성장할 태세를 갖추고 있습니다.
아시아태평양과 남미의 수산물 소비 수요 증가와 정부의 이니셔티브로 양식 어종 사료 생산이 증가하고 있습니다.
양식업의 성장에 의해 사료 수요가 급증하고, 이것이 배합 사료 생산의 성장을 견인하고 있습니다. 2022년 배합 사료 생산량은 전년 대비 13.1% 증가했으며, 양어 사료 생산량은 2017년부터 2022년 사이에 46.3% 증가했습니다. 어용 사료의 소비량 증가는 수산물 수요 증가에 대응하기 위해, 수산 동물의 성능을 유지·향상시키고, 생산성을 높일 필요가 있는 것이 배경에 있습니다.
아시아태평양에서는 물고기 소비량과 생산량이 많기 때문에 2022년 사료용 산미료 시장의 73.2%를 물고기 사료가 차지했습니다. 어류에 이어 새우와 기타 수산종이 많고, 새우는 유럽 국가와 미국이 다른 지역에서 대량으로 수입하고 있습니다. 각국은 수산물 수요 증가에 대응하기 위해 양식생산 확대에 주력하고 있습니다. 예를 들어 인도는 2020년 1억 1,410만 달러에서 어업성에 대한 예산 배분을 2021년 1억 6,880만 달러로 증액하여 증산을 도모했으며 예측 기간 동안 사료 수요 증가가 예상됩니다.
남미에서도 사료생산이 증가하고 있어 양식 확대에 따라 2022년에는 2017년 대비 46.4% 증가한 510만톤에 달했습니다. 이 지역은 주요 수산물 소비 지역 중 하나이며, 수산물 수요 증가가 양식 생산의 성장을 견인하고 있습니다.
증가하는 수요를 충족시키기 위해 양식이 계속 증가하는 가운데, 이 산업의 개발과 확대에 대한 주력은 사료 생산의 성장을 가속할 것으로 예상됩니다. 이러한 수생생물에 대한 사료 생산 증가는 예측 기간 동안 수산 양식 부문의 성장을 돕는 것으로 예상됩니다.
사료용 산미료 산업 개요
사료용 산미료 시장은 적당히 통합되어 상위 5개사에서 41.05%를 차지하고 있습니다. 이 시장 주요 기업은 다음과 같습니다. Adisseo, BASF SE, Cargill Inc., DSM Nutritional Products AG and SHV(Nutreco NV)(알파벳순 정렬).
기타 혜택
엑셀 형식 시장 예측(ME) 시트
3개월의 애널리스트 서포트
목차
제1장 주요 요약과 주요 조사 결과
제2장 보고서 제안
제3장 소개
조사의 전제조건과 시장 정의
조사 범위
조사 방법
제4장 주요 산업 동향
동물 사육 수
가금류
반추동물
돼지
사료 생산
양식업
가금류
반추동물
돼지
규제 프레임워크
호주
브라질
캐나다
중국
프랑스
독일
인도
인도네시아
이탈리아
일본
멕시코
네덜란드
필리핀
러시아
남아프리카
한국
스페인
태국
터키
영국
미국
베트남
밸류체인과 유통채널 분석
제5장 시장 세분화
서브 첨가물
푸마르산
젖산
프로피온산
기타 산미료
동물
양식
하위 동물별
어류
새우
기타 양식 어종
가금류
하위 동물별
육계
산란계
기타 가금류 조류
반추동물
하위 동물별
육우
젖소
기타 반추동물
돼지
기타 동물
지역
아프리카
국가별
이집트
케냐
남아프리카
기타 아프리카
아시아태평양
국가별
호주
중국
인도
인도네시아
일본
필리핀
한국
태국
베트남
기타 아시아태평양
유럽
국가별
프랑스
독일
이탈리아
네덜란드
러시아
스페인
터키
영국
기타 유럽
중동
국가별
이란
사우디아라비아
기타 중동
북미
국가별
캐나다
멕시코
미국
기타 북미
남미
국가별
아르헨티나
브라질
칠레
기타 남미
제6장 경쟁 구도
주요 전략적 움직임
시장 점유율 분석
기업 상황
기업 프로파일
Adisseo
Alltech, Inc.
BASF SE
Borregaard AS
Cargill Inc.
DSM Nutritional Products AG
Impextraco NV
Kemin Industries
SHV(Nutreco NV)
Yara International ASA
제7장 CEO에 대한 주요 전략적 질문
제8장 부록
세계 개요
개요
Five Forces 분석 프레임워크
세계의 밸류체인 분석
세계 시장 규모와 DRO
정보원과 참고문헌
도표 목록
주요 인사이트
데이터 팩
용어집
KTH
영문 목차
영문목차
The Feed Acidifiers Market size is estimated at 2.72 billion USD in 2025, and is expected to reach 3.58 billion USD by 2030, growing at a CAGR of 5.59% during the forecast period (2025-2030).
Feed acidifiers are an important component of animal feed, promoting growth and metabolism, increasing feed intake, and protecting against harmful pathogens while reducing the reliance on antibiotics. In 2022, feed acidifiers represented 7% of the global feed additives market, making them one of the most significant types of feed additives worldwide.
Asia-Pacific was the largest regional market for feed acidifiers, accounting for 31.3% of the market in 2022. North America and Europe followed closely, with market shares of 26.1% and 23%, respectively. The higher share of Asia-Pacific was attributed to the higher penetration rates of additives and a greater animal population. The United States is one of the largest producers and exporters of different meats, such as poultry and beef meat, which has helped North America become one of the largest feed manufacturers. The adoption of feed acidifiers is high in the region as an alternative to antibiotics for producing high-quality feed.
Propionic acid was the most widely used feed acidifier, accounting for the largest share of the global feed acidifiers market in 2022, valued at USD 0.8 billion. This was due to its antimicrobial properties and ability to inhibit the growth of mold and some bacteria at low concentrations. Its share was followed by fumaric acid and lactic acid in terms of value.
The other feed acidifiers segment is expected to grow at a similar rate with a CAGR of 5.6% during the forecast period, primarily due to the acidifiers' ability to increase animal feed intake and the productivity of animals.
The increasing awareness of the beneficial usage of feed additives, the growing trend of commercial farming, and the ability of acidifiers to function as antibiotics are expected to drive the global feed acidifiers market with a CAGR of 5.6% during the forecast period.
The global feed acidifiers market emerged as one of the significant feed additive markets worldwide, accounting for 7% of the global feed additives market in 2022. Feed acidifiers gained importance in promoting animal growth and metabolism and resistance to harmful pathogens such as bacteria, thereby serving as an alternative to antibiotics.
Lactic acid had the largest market share of 34.4% in the global feed acidifiers market value in 2022, owing to its easier availability. However, propionic acid is expected to emerge as the fastest-growing market, registering a CAGR of 5.7% during the forecast period, mainly due to product innovations and growing market penetration.
Asia-Pacific was the largest region in the world for the feed acidifiers market in 2022, accounting for a market value of USD 728.2 million. This region's higher market share can be attributed to its higher penetration rate and feed production volume, which was around 0.5 billion metric tons in 2022.
The United States emerged as the largest country globally for the feed acidifiers market, accounting for 18.3% of the market share in 2022, which was nearly USD 0.4 billion in value. This market position is mainly due to extensive commercial animal cultivation and the country's focus on implementing new production practices in animal farms. Both Japan and Mexico are expected to grow and register a CAGR of 6.3% during the forecast period due to increasing investments in these countries.
The global population increase, increase in feed production, and the growing awareness of acidifiers as an alternative to antibiotics are expected to drive the feed acidifiers market, registering a CAGR of 5.6% during the forecast period.
Global Feed Acidifiers Market Trends
High demand for animal protein and poultry products such as eggs with increasing investment in poultry sector is increasing poultry population
The poultry population has significantly increased in recent years, primarily due to the growing demand for chicken meat and eggs in daily diets. The shift toward poultry products has been driven in the United States by the increasing prices of other meat, such as pig meat. The consumption of eggs in Europe also increased by 4.6% between 2017 and 2021, reaching 6,135 metric ton in 2021.
Asia-Pacific is the largest producer of poultry birds, with production increasing by 6.6% in 2022 from 2017. The rise in poultry production was due to the growing demand for animal protein following the outbreak of African Swine Fever, which reduced the pork meat supply. China, which accounts for 40% of global poultry production, has more than 900 million stock-laying hens, and the largest layer poultry farming center can hatch 60 million chicks annually.
The Middle East is also expected to witness growth in poultry production in the forecast period (2023-2029). Companies such as Almarai in Saudi Arabia have invested heavily in the industry, with the company having spent USD 1.12 billion on establishing new farms to expand production.
The increasing demand for poultry products and rising investments in the poultry industry are expected to boost feed production. This, in turn, is expected to drive the demand for feed additives in the global market during the forecast period. Due to these developments, the poultry industry is poised for significant growth in the coming years.
The growing demand for seafood consumption in Asia-Pacific and South America, and government initiatives is increasing the feed production for aquaculture species
The demand for feed is rapidly increasing due to the growth of aquaculture, which is driving the growth of compound feed production. In 2022, compound feed production increased by 13.1% from the previous year, and fish feed production increased by 46.3% between 2017 and 2022. The rise in consumption of fish feed is driven by the need to maintain and improve the performance of aquatic animals and increase productivity to meet the growing demand for seafood.
Fish feed accounted for 73.2% of the feed acidifiers market in 2022, as fish is highly consumed and produced in the Asia-Pacific region. Fish was followed by shrimp and other aquatic species, with shrimp being highly imported by European countries and the United States from other regions. Countries are focusing on increasing aquaculture production to meet the growing demand for seafood. For instance, India increased its budget allocation to the Department of Fisheries from USD 114.1 million in 2020 to USD 168.8 million in 2021 to increase production, which is expected to boost the demand for feed during the forecast period.
South America is also experiencing an increase in feed production, which rose by 46.4% in 2022 from 2017 to reach 5.1 million metric ton, in line with the expansion of aquaculture farming. The region is one of the major seafood-consuming regions, and the increasing demand for seafood is driving the growth of aquaculture production.
As aquaculture continues to increase to meet the growing demand, the development of the industry and a focus on its expansion are expected to fuel the growth of feed production. This increase in feed production for aquatic species is expected to aid in the growth of the aquaculture segment during the forecast period.
Feed Acidifiers Industry Overview
The Feed Acidifiers Market is moderately consolidated, with the top five companies occupying 41.05%. The major players in this market are Adisseo, BASF SE, Cargill Inc., DSM Nutritional Products AG and SHV (Nutreco NV) (sorted alphabetically).
Additional Benefits:
The market estimate (ME) sheet in Excel format
3 months of analyst support
TABLE OF CONTENTS
1 EXECUTIVE SUMMARY & KEY FINDINGS
2 REPORT OFFERS
3 INTRODUCTION
3.1 Study Assumptions & Market Definition
3.2 Scope of the Study
3.3 Research Methodology
4 KEY INDUSTRY TRENDS
4.1 Animal Headcount
4.1.1 Poultry
4.1.2 Ruminants
4.1.3 Swine
4.2 Feed Production
4.2.1 Aquaculture
4.2.2 Poultry
4.2.3 Ruminants
4.2.4 Swine
4.3 Regulatory Framework
4.3.1 Australia
4.3.2 Brazil
4.3.3 Canada
4.3.4 China
4.3.5 France
4.3.6 Germany
4.3.7 India
4.3.8 Indonesia
4.3.9 Italy
4.3.10 Japan
4.3.11 Mexico
4.3.12 Netherlands
4.3.13 Philippines
4.3.14 Russia
4.3.15 South Africa
4.3.16 South Korea
4.3.17 Spain
4.3.18 Thailand
4.3.19 Turkey
4.3.20 United Kingdom
4.3.21 United States
4.3.22 Vietnam
4.4 Value Chain & Distribution Channel Analysis
5 MARKET SEGMENTATION (includes market size in Value in USD and Volume, Forecasts up to 2030 and analysis of growth prospects)
5.1 Sub Additive
5.1.1 Fumaric Acid
5.1.2 Lactic Acid
5.1.3 Propionic Acid
5.1.4 Other Acidifiers
5.2 Animal
5.2.1 Aquaculture
5.2.1.1 By Sub Animal
5.2.1.1.1 Fish
5.2.1.1.2 Shrimp
5.2.1.1.3 Other Aquaculture Species
5.2.2 Poultry
5.2.2.1 By Sub Animal
5.2.2.1.1 Broiler
5.2.2.1.2 Layer
5.2.2.1.3 Other Poultry Birds
5.2.3 Ruminants
5.2.3.1 By Sub Animal
5.2.3.1.1 Beef Cattle
5.2.3.1.2 Dairy Cattle
5.2.3.1.3 Other Ruminants
5.2.4 Swine
5.2.5 Other Animals
5.3 Region
5.3.1 Africa
5.3.1.1 By Country
5.3.1.1.1 Egypt
5.3.1.1.2 Kenya
5.3.1.1.3 South Africa
5.3.1.1.4 Rest of Africa
5.3.2 Asia-Pacific
5.3.2.1 By Country
5.3.2.1.1 Australia
5.3.2.1.2 China
5.3.2.1.3 India
5.3.2.1.4 Indonesia
5.3.2.1.5 Japan
5.3.2.1.6 Philippines
5.3.2.1.7 South Korea
5.3.2.1.8 Thailand
5.3.2.1.9 Vietnam
5.3.2.1.10 Rest of Asia-Pacific
5.3.3 Europe
5.3.3.1 By Country
5.3.3.1.1 France
5.3.3.1.2 Germany
5.3.3.1.3 Italy
5.3.3.1.4 Netherlands
5.3.3.1.5 Russia
5.3.3.1.6 Spain
5.3.3.1.7 Turkey
5.3.3.1.8 United Kingdom
5.3.3.1.9 Rest of Europe
5.3.4 Middle East
5.3.4.1 By Country
5.3.4.1.1 Iran
5.3.4.1.2 Saudi Arabia
5.3.4.1.3 Rest of Middle East
5.3.5 North America
5.3.5.1 By Country
5.3.5.1.1 Canada
5.3.5.1.2 Mexico
5.3.5.1.3 United States
5.3.5.1.4 Rest of North America
5.3.6 South America
5.3.6.1 By Country
5.3.6.1.1 Argentina
5.3.6.1.2 Brazil
5.3.6.1.3 Chile
5.3.6.1.4 Rest of South America
6 COMPETITIVE LANDSCAPE
6.1 Key Strategic Moves
6.2 Market Share Analysis
6.3 Company Landscape
6.4 Company Profiles (includes Global Level Overview, Market Level Overview, Core Business Segments, Financials, Headcount, Key Information, Market Rank, Market Share, Products and Services, and Analysis of Recent Developments).