NOC as a Service 시장 : 서비스 유형별, 서포트 모델별, 업계별 - 예측(-2030년)
NOC as a Service Market by Service Type, Support Model, and Vertical (BFSI, Healthcare & Life Sciences, IT & ITES, Government & Public Sector) - Global Forecast to 2030
상품코드:1819107
리서치사:MarketsandMarkets
발행일:2025년 09월
페이지 정보:영문 248 Pages
라이선스 & 가격 (부가세 별도)
ㅁ Add-on 가능: 고객의 요청에 따라 일정한 범위 내에서 Customization이 가능합니다. 자세한 사항은 문의해 주시기 바랍니다.
한글목차
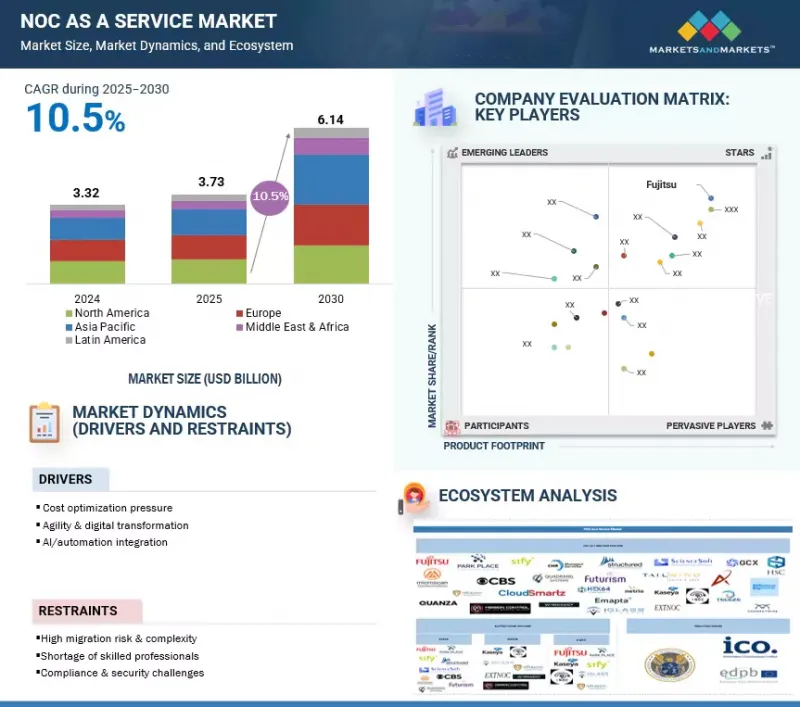
세계의 NOC as a Service 시장 규모는 2025년에 추정 37억 3,000만 달러를 기록하고, 2030년까지 61억 4,000만 달러에 달할 것으로 예측되며, 2025-2030년에 CAGR로 10.5%의 성장이 전망됩니다.
NOC as a Service는 중단 없는 디지털 채널, 원격 근무, 방대한 엣지 풋프린트가 인시던트 표면을 확장하고 감사 모니터링을 강화함에 따라 인력 증원의 개별 조항에서 하이브리드/멀티 클라우드 기업의 업무 백본으로 진화하고 있습니다.
조사 범위
조사 대상 연도
2019-2030년
기준 연도
2024년
예측 기간
2025-2030년
단위
100만/10억 달러
부문
서비스 유형, 서포트 모델, 업계, 지역
대상 지역
북미, 유럽, 아시아태평양, 중동 및 아프리카, 라틴아메리카
서비스 유형별로는 이벤트 모니터링 및 관리 부문이 예측 기간 동안 시장을 주도할 것으로 예상됩니다.
이벤트 모니터링 및 관리는 가장 빈번하고 상시 존재하는 워크로드이며, 모든 다운스트림 NOC as a Service 결과물의 신호 충실도를 관리하기 때문에 가장 큰 시장 규모를 유지할 것으로 예상됩니다. 이를 위해서는 멀티벤더 에스테이트에 대한 24시간 365일 텔레메트리 수집, 알람 폭풍을 하나의 처리 가능한 인시던트로 통합하는 상관관계, 토폴로지 및 최근 변경 데이터로 컨텍스트를 강화하여 티켓이 진단의 자리 표시자가 아닌 즉각적인 대처가 가능해집니다. 공급자는 설계된 이벤트 파이프라인과 AIOps를 통해 이를 대규모로 운영하고, 과도기적 상태를 자체적으로 종료하고, 인적 계층에 도달하기 전에 중복을 억제하여 알람에서 티켓까지의 대기 시간을 직접 단축하고, MTTA/MTTR을 압축하고, 모니터링되는 엔드포인트 당 티켓 수를 줄입니다. 예산이 여기에 집중되는 이유는 간단합니다. 인시던트 및 문제 관리, 서비스 보고 및 분석, 용량 및 변경 관리는 모니터링 플레인이 변경 컨텍스트를 추가한 고품질의 중복 제거된 인시던트를 제공하는 경우에만 계약에 따라 실행됩니다. 따라서 조달은 먼저 이벤트 모니터링 및 관리에 착수하고, 상관관계의 개선이 입증된 후 범위를 확대합니다. 인스턴스는 이러한 우선순위를 강력하게 보여줍니다. ConnectWise는 패치와 BDR 모니터링을 통합한 지속적인 모니터링을 중심으로 NOC as a Service를 포지셔닝하고, 파트너가 노이즈 감소와 SLA 준수를 증명하기 위해 사용하는 알람부터 티켓, 수정까지 보고를 공개하고 있습니다. 후지쯔가 출시한 ISO 인증 멀티벤더 모니터링은 매우 많은 양의 이벤트를 처리하고 런북에서 사전 정의된 캐리어 에스컬레이션을 직접 실행하는 ISO 인증 멀티벤더 모니터링으로, 규제된 캐리어급 환경에서 고충실도 모니터링과 상관관계가 어떻게 상업적 가치의 중심에 있는지를 보여주고 있습니다.
산업별로는 BFSI 부문이 예측 기간 동안 가장 큰 시장 점유율을 차지할 것으로 예상됩니다.
BFSI 부문은 계약 범위와 기간을 확대하는 명확한 감사 요건을 갖춘 Evidence First의 NOC as a Service를 구매하기 때문에 가장 큰 시장 점유율을 차지할 것으로 예상됩니다. BFSI는 이벤트 모니터링 및 관리와 런북 기반 인시던트 및 문제 관리, MTTR, 알람-티켓 간 지연 시간, 패치 준수, 내부 감사 및 규제 당국에 적합한 백업 테스트 및 복원 증명을 포함한 월별 서비스 보고 및 분석 팩을 제공합니다. 제공되는 오프사이트 또는 하이브리드 운영 구조를 구매합니다. 공급자는 ISO 준수 프로세스, 엄격한 업무 분담, 추적 가능한 승인 및 롤백 증거와 함께 사전 정의된 에스컬레이션 경로(캐리어 에스컬레이션 포함)를 제공함으로써 BFSI를 획득할 수 있습니다. 이렇게 탐지부터 변경까지 모든 액션은 런북에 매핑되어 샘플링과 검토를 견딜 수 있는 보고서에 반영됩니다. BFSI에서는 네트워크의 중요성이 높고 컴플라이언스도 다층적이기 때문에 사내에 24시간 365일 직원을 배치하는 것은 비경제적이며, 동시에 정당한 증거가 필요하기 때문에 많은 비용이 소요됩니다.
세계의 NOC as a Service 시장에 대해 조사 분석했으며, 주요 촉진요인과 억제요인, 경쟁 상황, 향후 동향 등의 정보를 전해드립니다.
목차
제1장 소개
제2장 조사 방법
제3장 주요 요약
제4장 중요한 인사이트
NOC as a Service 시장의 주요 기업에서 매력적인 기회
NOC 시장 : 서비스 유형별
NOC as a Service 시장 : 서포트 모델별
NOC as a Service 시장 : 업계별
북미의 NOC as a Service 시장 : 서비스 유형별, 서포트 모델별
제5장 시장 개요와 산업 동향
소개
시장 역학
성장 촉진요인
성장 억제요인
기회
과제
NOC as a Service의 진화
NOC as a Service 시장 : 생태계 분석/시장 맵
사례 연구 분석
공급망 분석
규제 상황
규제기관, 정부기관, 기타 조직
주요 규제
가격 책정 분석
기술 분석
주요 기술
인접 기술
보완 기술
특허 분석
Porter's Five Forces 분석
고객 비즈니스에 영향을 미치는 동향/혼란
주요 이해관계자와 구입 기준
주요 회의와 이벤트
NOC as a Service 시장용 기술 로드맵
단기 로드맵(2023-2025년)
중기 로드맵(2026-2028년)
장기 로드맵(2029-2030년)
NOC as a Service 시장의 베스트 프랙티스
투자와 자금 조달 시나리오
NOC as a Service 시장에 대한 생성형 AI의 영향
주요 이용 사례와 시장 전망
베스트 프랙티스
생성형 AI 구현 사례 연구
클라이언트 준비 상황과 영향 평가
2025년 미국 관세의 영향 - 개요
주요 관세율
가격의 영향 분석
국가/지역에 대한 영향
북미
유럽
아시아태평양
산업에 대한 영향
제6장 NOC as a Service 시장 : 서비스 유형별
소개
이벤트 모니터링·관리
인시던트·문제 관리
서비스 보고·분석
용량·변경 관리
기타 서비스 유형
제7장 NOC as a Service 시장 : 서포트 모델별
소개
온사이트
오프사이트
하이브리드
제8장 NOC as a Service 시장 : 업계별
소개
BFSI
헬스케어·생명과학
정부·공공 부문
통신·CSV
IT·ITeS
소매·E-Commerce
에너지·유틸리티
운송·물류
기타 업계
제9장 NOC as a Service 시장 : 지역별
소개
북미
북미의 거시경제 전망
미국
캐나다
유럽
유럽의 거시경제 전망
독일
영국
프랑스
스페인
이탈리아
기타 유럽
아시아태평양
아시아태평양의 거시경제 전망
중국
일본
인도
한국
호주·뉴질랜드
싱가포르
기타 아시아태평양
중동 및 아프리카
중동 및 아프리카의 거시경제 전망
사우디아라비아
아랍에미리트
남아프리카공화국
기타 중동 및 아프리카
라틴아메리카
라틴아메리카의 거시경제 전망
브라질
멕시코
기타 라틴아메리카
제10장 경쟁 구도
소개
주요 진출 기업의 전략/강점(2022-2025년)
시장 점유율 분석(2024년)
매출 분석(2020-2024년)
브랜드/제품의 비교
기업 평가와 재무 지표
기업 평가 매트릭스 : 주요 기업(2024년)
기업 평가 매트릭스 : 스타트업/중소기업(2024년)
경쟁 시나리오
제11장 기업 개요
주요 기업
FUJITSU
KASEYA
SIFY TECHNOLOGIES
PARK PLACE TECHNOLOGIES
CONNECTWISE(THOMA BRAVO)
IGLASS NETWORKS(20 SOUTH PARTNERS)
TAILWIND VOICE & DATA
GCX(3I INFRASTRUCTURE PLC)
STRUCTURED COMMUNICATION SYSTEMS
기타 주요 기업
INFRASSIST TECHNOLOGIES
EXTNOC(EXTERNETWORKS)
MISSION CONTROL NOC
WORKSENT
CHR MANAGED SERVICES
SCIENCESOFT
MICROSCAN COMMUNICATIONS
CBS(COSMOS BUSINESS SYSTEMS)
QUADRANG SYSTEMS
FUTURISM TECHNOLOGIES
EMAPTA
스타트업/중소기업
NETRIO
QUANZA
CLOUDSMARTZ
HSC(HUGHES SYSTIQUE CORPORATION)
MEDHA CLOUD
TECEZE
HEX64
제12장 인접 시장과 관련 시장
소개
데이터센터 네트워킹 시장
SOC as a Service(SOCaaS) 시장
제13장 부록
KSM
영문 목차
영문목차
The NOC as a Service market is estimated to be USD 3.73 billion in 2025 and is projected to reach USD 6.14 billion by 2030 at a CAGR of 10.5% from 2025 to 2030. NOC as a Service is evolving from a staff-augmentation line item to the operational backbone for hybrid and multi-cloud enterprises, as nonstop digital channels, remote work, and sprawling edge footprints expand incident surfaces and intensify audit scrutiny.
Scope of the Report
Years Considered for the Study
2019-2030
Base Year
2024
Forecast Period
2025-2030
Units Considered
Value (USD) Million/Billion
Segments
Service Type, Support Model, Vertical, and Region
Regions covered
North America, Europe, Asia Pacific, Middle East & Africa, and Latin America
What buyers now procure are [outcomes across four scoped capabilities: Event Monitoring & Management that collapses alarm storms into a single actionable incident with change and topology context; Incident & Problem Management that executes runbooked diagnostics, carrier or provider escalations, and safe rollback to compress MTTR; Service Reporting & Analysis that delivers audit-ready MTTA/MTTR, alarm-to-ticket latency, patch adherence, and backup test-restore evidence; and Capacity & Change Management that governs patch windows, configuration baselines, and separation of duties. Providers differentiate themselves by activating Offsite coverage in weeks instead of quarters. They also extend Hybrid services for key Onsite changes and publish high-quality evidence packs suitable for executive review, ensuring they can withstand internal audits and regulator sampling. This approach is reflected in their platform-attached offerings, which combine 24/7 monitoring with patch management and backup disaster recovery (BDR) oversight. Additionally, they implement ISO-compliant multivendor programs that establish predefined escalation paths for regulated networks.
At the same time, adoption exposes execution gaps that separate leaders from the field: runbook immaturity, unclear RACI between Offsite and Onsite teams, and weak evidence discipline can stall transitions and jeopardize renewals in BFSI, healthcare & life sciences, and government & public sector. What high-performing programs do differently is industrialize correlation and suppression during the first sprints to cut duplicate noise double-digits, codify escalation timers and rollback in machine-readable playbooks, and tie renewals to measurable hygiene outcomes, patch adherence, and test-restore success, alongside MTTR ratchets. How this shapes the market is visible in contracting patterns: Offsite models capture the largest share due to 24/7 scale economics, Hybrid grows where privileged change control is non-negotiable, North America leads on platform attachment and audit culture, and Asia Pacific posts the fastest growth as multi-country estates standardize on Offsite operations with local Onsite benches. Why this persists is simple: evidence-first delivery converts uptime and compliance into budgeted outcomes, turning NOC as a Service from an optional cost takeout into a long-horizon resilience investment.
By service type, the event monitoring & management segment is estimated to lead the market during the forecast period
Event Monitoring & Management will anchor the largest market size because it is the highest-frequency, always-on workload that governs signal fidelity for every downstream NOC as a Service deliverable. What this entails is 24/7 telemetry ingestion across multivendor estates, correlation that collapses alarm storms into a single actionable incident, and context enrichment with topology and recent change data so that tickets are immediately actionable rather than diagnostic placeholders. Providers operationalize this at scale through engineered event pipelines and AIOps that auto-close transient conditions and suppress duplicates before they hit human tiers, which directly reduces alarm-to-ticket latency, compresses MTTA/MTTR, and lowers ticket volume per monitored endpoint. Why budgets concentrate here is straightforward: Incident & Problem Management, Service Reporting & Analysis, and Capacity & Change Management only perform to contract if the monitoring plane delivers high-quality, deduplicated incidents with change context attached; hence, procurement lands first on Event Monitoring & Management and then expands scope after correlation gains are evidenced. Instances underscore this primacy: ConnectWise positions NOC as a Service around continuous monitoring with integrated patch and BDR oversight, publishing alarm-to-ticket-to-fix reporting that partners use to prove noise reduction and SLA adherence; this evidence-first approach drives initial contract value to the monitoring layer before layered runbooks expand remediation scope. Fujitsu markets ISO-certified, multivendor monitoring that handles very large event volumes and executes predefined carrier escalations directly from runbooks, illustrating how high-fidelity monitoring and correlation sit at the center of commercial value in regulated and carrier-class environments.
By vertical, the BFSI segment is estimated to account for the largest market share during the forecast period
The BFSI (Banking, Financial Services, & Insurance) segment is expected to command the largest market share because it purchases evidence-first NOC as a Service with explicit audit requirements that expand contract scope and term. BFSI buys an Offsite or Hybrid operating construct where Event Monitoring & Management are paired with runbook-driven Incident & Problem Management and monthly Service Reporting & Analysis packs containing MTTR, alarm-to-ticket latency, patch adherence, and backup test-restore proofs suitable for internal audit and regulators. Providers win BFSI by delivering ISO-anchored processes, strict separation of duties, and predefined escalation paths (including carrier escalations) with traceable approvals and rollback evidence. Thus, every action, from detection through change, is mapped to a runbook and reflected in reports that stand up to sampling and review. This translates to outsized spending as BFSI blends high network criticality with layered compliance, making it uneconomic to staff 24/7 internally while simultaneously requiring defensible evidence; subscription NOC as a Service with Hybrid change windows addresses both constraints and supports multi-year renewals. Instances show the pattern: Fujitsu's managed NOC emphasizes multivendor monitoring from ISO-certified facilities and runbooked carrier escalations with compliance-grade artifacts, a posture aligned to BFSI control expectations and board-level reporting cycles. Similarly, ConnectWise's reporting that maps alarm to ticket to fix gives MSPs serving financial institutions a repeatable evidence trail to pass customer audits and justify expanding the Offsite scope.
North America will lead in market share, while Asia Pacific is projected to witness the fastest growth during the forecast period
North America leads in market share while Asia Pacific delivers the highest growth because mature platform ecosystems and strict evidence expectations anchor current spend in North America, whereas rapid hybrid connectivity build-outs and co-sourcing models propel accelerated adoption in Asia Pacific. What characterizes North America is heavy reliance on productized Offsite NOC as a Service bundled with RMM and BCDR, executive-grade Service Reporting & Analysis, and standardized runbooks suited to compliance-sensitive sectors, which collectively translate into larger initial contracts and higher net retention across MSP and enterprise buyers. Asia Pacific will outgrow other regions through rapid SD-WAN and cloud-edge rollouts across multi-country enterprises that need 24/7 Event Monitoring & Management immediately and Hybrid models for privileged Onsite changes, enabling providers to activate coverage in weeks rather than quarters while aligning spend to MTTR and hygiene outcomes instead of headcount. Why this split persists is ecosystem maturity and governance: North America's deep MSP channels, platform attachment, and audit culture sustain the largest revenue base, while Asia Pacific's expansion and skills constraints create the steepest slope for NOC as a Service subscription as organizations standardize on Offsite operations with local Onsite benches. Instances reflect these dynamics: ConnectWise's North America-centric partner network attaches NOC as a Service to reduce overnight ticket loads and prove patch and backup hygiene in executive reviews, reinforcing regional share, while providers building Asia Pacific hubs leverage standardized monitoring and Hybrid change windows to win multi-country expansions across India, ASEAN, Japan, and ANZ at a faster clip than other regions.
Breakdown of Primary Interviews
The study contains insights from various industry experts, from solution vendors to Tier 1 companies. The breakdown of the primary interviews is as follows:
By Company Type: Tier 1 - 35%, Tier 2 - 40%, and Tier 3 - 25%
By Designation: C-level - 20%, Directors - 30%, and Others - 50%
By Region: North America - 40%, Europe - 35%, Asia Pacific - 20%, Rest of the World - 5%
The major players in the NOC as a Service market are Fujitsu (Japan), Park Place Technologies (US), Kaseya (US), Sify Technologies (India), INOC (US), iGlass Networks (US), Infrassist Technologies (India), EXTNOC (US), Mission Control NOC (Canada), Worksent (US), ConnectWise (US), CHR Managed Services (US), Structured (US), Science Soft (US), Microscan Communications (India), CBS (US), Quadrang Systems (India), Futurism Technologies (US), Tailwind Voice & Data (US), Emapta (Philippines), and GCX (US). These players have adopted various growth strategies, such as partnerships, agreements, collaborations, product launches, product enhancements, and acquisitions, to expand their footprint in the NOC as a Service market.
Research Coverage
This study covers the NOC as a Service market size and the growth potential across different segments, including service type (Event Monitoring & Management, Incident & Problem Management, Service Reporting & Analysis, Capacity & Change Management), support model (Onsite, Offsite, Hybrid), vertical (Banking, Financial Services, & Insurance; Healthcare & Life Sciences; Government & Public Sector; Telecom & CSVS; IT & ITeS; Retail & E-commerce; Energy & Utilities; Transportation & Logistics), and region. The study includes an in-depth competitive analysis of the leading market players, their company profiles, key observations related to product and business offerings, recent developments, and market strategies.
Key Benefits of Buying the Report
The report will help market leaders and new entrants with information on the closest approximations of the global NOC as a Service market's revenue numbers and subsegments. It will also help stakeholders understand the competitive landscape and gain more insights to position their businesses better and plan suitable go-to-market strategies. Moreover, the report will provide insights for stakeholders to understand the market's pulse and provide them with information on key market drivers, restraints, challenges, and opportunities.
The report provides insights into the following points:
Analysis of key drivers (Cost savings, scalability, 24/7 monitoring, access to expertise, reduced operational overhead, improved service quality, enhanced network security, focus on core business activities, rapid deployment, flexibility in service offerings), restraints (Data privacy concerns, dependency on third-party providers, integration complexities, potential service disruptions, limited control over operations, communication barriers, lack of customization, security risks, vendor lock-in, regulatory compliance issues), opportunities (Integration of AI and automation, expansion into emerging markets, demand from SMEs, convergence of NOC and SOC services, growth in remote work environments, adoption of cloud-based solutions, partnerships with MSPs, development of specialized NOCaaS offerings, increasing reliance on IoT, advancements in cybersecurity), and challenges (Maintaining service quality, managing multivendor environments, ensuring data security, addressing skill shortages, adapting to technological advancements, handling large-scale deployments, meeting compliance requirements, managing customer expectations, ensuring service continuity, adapting to market dynamics) influencing the growth of the NOC as a Service market.
Product Development/Innovation: Detailed insights into upcoming technologies, research & development activities, and product & service launches in the NOC as a Service market
Market Development: Comprehensive information about lucrative markets - analyzing the NOC as a Service market across various regions
Market Diversification: Exhaustive information about new products & services, untapped geographies, recent developments, and investments in the NOC as a Service market
Competitive Assessment: In-depth assessment of market shares, growth strategies, and service offerings of leading players such as Fujitsu (Japan), Park Place Technologies (US), Kaseya (US), Sify Technologies (India), INOC (US), iGlass Networks (US), Infrassist Technologies (India), EXTNOC (US), Mission Control NOC (Canada), Worksent (US), ConnectWise (US), CHR Managed Services (US), Structured (US), Science Soft (US), Microscan Communications (India), CBS (US), Quadrang Systems (India), Futurism Technologies (US), Tailwind Voice & Data (US), Emapta (Philippines), and GCX (US).
TABLE OF CONTENTS
1 INTRODUCTION
1.1 STUDY OBJECTIVES
1.2 MARKET DEFINITION
1.3 STUDY SCOPE
1.3.1 MARKET SEGMENTATION AND REGIONS COVERED
1.3.2 INCLUSIONS & EXCLUSIONS
1.4 YEARS CONSIDERED
1.5 CURRENCY CONSIDERED
1.6 STAKEHOLDERS
1.7 SUMMARY OF CHANGES
2 RESEARCH METHODOLOGY
2.1 RESEARCH DATA
2.1.1 SECONDARY DATA
2.1.2 PRIMARY DATA
2.1.2.1 Primary interviews with experts
2.1.2.2 Breakdown of primary profiles
2.1.2.3 Key insights from industry experts
2.2 MARKET SIZE ESTIMATION
2.2.1 TOP-DOWN APPROACH
2.2.2 BOTTOM-UP APPROACH
2.2.3 NOC AS A SERVICE MARKET ESTIMATION: DEMAND-SIDE ANALYSIS
2.3 DATA TRIANGULATION
2.4 RISK ASSESSMENT
2.5 RESEARCH ASSUMPTIONS
2.6 RESEARCH LIMITATIONS
3 EXECUTIVE SUMMARY
4 PREMIUM INSIGHTS
4.1 ATTRACTIVE OPPORTUNITIES FOR KEY PLAYERS IN NOC AS A SERVICE MARKET
4.2 NOC AS A SERVICE MARKET, BY SERVICE TYPE
4.3 NOC AS A SERVICE MARKET, BY SUPPORT MODEL
4.4 NOC AS A SERVICE MARKET, BY VERTICAL
4.5 NORTH AMERICA: NOC AS A SERVICE MARKET, BY SERVICE TYPE AND SUPPORT MODEL
5 MARKET OVERVIEW AND INDUSTRY TRENDS
5.1 INTRODUCTION
5.2 MARKET DYNAMICS
5.2.1 DRIVERS
5.2.1.1 Adoption of AI & AIOps for network automation and efficiency
5.2.1.2 Growing demand for cybersecurity and 24/7 threat monitoring
5.2.1.3 Expansion of cloud and hybrid infrastructure requiring scalable NOC solutions
5.2.2 RESTRAINTS
5.2.2.1 Regulatory and data sovereignty constraints in sensitive industries
5.2.2.2 Integration of complexity with legacy and proprietary systems
5.2.2.3 High cost of deployment and ROI concerns among SMBs
5.2.3 OPPORTUNITIES
5.2.3.1 Industry-specific and compliance-focused NOCaaS solutions for regulated sectors
5.2.3.2 Growing potential for SMB and mid-market tailored service packages
5.2.3.3 Rising adoption of 5G, Edge, and IoT networks requiring advanced NOC capabilities
5.2.4 CHALLENGES
5.2.4.1 Alert fatigue and noisy telemetry impacting incident management
5.2.4.2 Tool fragmentation and data silos limiting unified visibility
5.2.4.3 Shortage of skilled engineers for automation and AIOps integration
5.3 EVOLUTION OF NOC AS A SERVICE
5.4 NOC AS A SERVICE MARKET: ECOSYSTEM ANALYSIS/ MARKET MAP
5.5 CASE STUDY ANALYSIS
5.5.1 OIL & GAS CLIENT MODERNIZES REMOTE OPERATIONS WITH EXTERNETWORKS' MANAGED NOC MONITORING SERVICES
5.5.2 ADTRAN STRENGTHENS ITS NOC SERVICE WITH INOC'S STRUCTURED ONBOARDING, TRAINING, AND QUALITY ASSURANCE
5.5.3 ADVANCED NETWORK PRODUCTS (ANP) ACCELERATES AUTOMATION AND SCALABILITY WITH CONNECTWISE RMM AND NOC SERVICES
5.6 SUPPLY CHAIN ANALYSIS
5.7 REGULATORY LANDSCAPE
5.7.1 REGULATORY BODIES, GOVERNMENT AGENCIES, AND OTHER ORGANIZATIONS
5.7.1.1 European Data Protection Board (EDPB)
5.7.1.2 OECD Privacy Framework (Organization for Economic Co-operation and Development)
5.7.1.3 US Federal Trade Commission (FTC)
5.7.2 KEY REGULATIONS
5.7.2.1 North America
5.7.2.1.1 US
5.7.2.2 Europe
5.7.2.2.1 UK
5.7.2.3 Asia Pacific
5.7.2.3.1 India
5.7.2.3.2 Japan
5.7.2.4 Middle East & Africa
5.7.2.4.1 Saudi Arabia
5.7.2.5 Latin America
5.7.2.5.1 Brazil
5.8 PRICING ANALYSIS
5.8.1 INDICATIVE PRICING ANALYSIS, BY SERVICE TYPE, 2024
5.9 TECHNOLOGY ANALYSIS
5.9.1 KEY TECHNOLOGIES
5.9.1.1 Network performance monitoring
5.9.1.2 Log parsing and indexing
5.9.1.3 Complex event processing (CEP)
5.9.2 ADJACENT TECHNOLOGIES
5.9.2.1 Machine learning (anomaly detection)
5.9.2.2 Automated incident remediation
5.9.3 COMPLEMENTARY TECHNOLOGIES
5.9.3.1 Synthetic transaction monitoring
5.9.3.2 Configuration automation
5.9.3.3 Threat intelligence ingestion
5.10 PATENT ANALYSIS
5.11 PORTER'S FIVE FORCES ANALYSIS
5.11.1 THREAT OF NEW ENTRANTS
5.11.2 THREAT OF SUBSTITUTES
5.11.3 BARGAINING POWER OF SUPPLIERS
5.11.4 BARGAINING POWER OF BUYERS
5.11.5 INTENSITY OF COMPETITIVE RIVALRY
5.12 TRENDS/DISRUPTIONS IMPACTING CUSTOMER BUSINESS
5.13 KEY STAKEHOLDERS AND BUYING CRITERIA
5.13.1 KEY STAKEHOLDERS IN BUYING PROCESS
5.13.2 BUYING CRITERIA
5.14 KEY CONFERENCES AND EVENTS
5.15 TECHNOLOGY ROADMAP FOR NOC AS A SERVICE MARKET
5.15.1 SHORT-TERM ROADMAP (2023-2025)
5.15.2 MID-TERM ROADMAP (2026-2028)
5.15.3 LONG-TERM ROADMAP (2029-2030)
5.16 BEST PRACTICES IN NOC AS A SERVICE MARKET
5.16.1 CODIFY RUNBOOKS AND SHIFT LEFT
5.16.2 CORRELATE BEFORE YOU TICKET
5.16.3 AUTOMATE FIRST-LINE DIAGNOSTICS AND SAFE REMEDIATION
5.16.4 INTEGRATE ITSM BIDIRECTIONALLY AND REPORT WHAT MATTERS
5.16.5 MAINTAIN ACCURATE TOPOLOGY/CMDB FOR IMPACT AND ESCALATION
5.17 INVESTMENT & FUNDING SCENARIO
5.18 IMPACT OF GENERATIVE AI ON NOC AS A SERVICE MARKET
5.18.1 TOP USE CASES AND MARKET POTENTIAL
5.18.1.1 Key use cases
5.18.2 BEST PRACTICES
5.18.2.1 BFSI industry
5.18.2.2 IT & ITES industry
5.18.2.3 Healthcare & life sciences industry
5.18.3 CASE STUDIES OF GENERATIVE AI IMPLEMENTATION
5.18.3.1 GenAI assisted correlation and RCA in a global financial services NOC
5.18.3.2 Closed loop GenAI remediation for a cloud commerce portfolio
5.18.3.3 Internet-aware experience protection with GenAI insights for a SaaS estate
5.18.4 CLIENT READINESS AND IMPACT ASSESSMENT
5.18.4.1 Client A: Global financial services enterprise
5.18.4.2 Client B: Regional e commerce portfolio
5.18.4.3 Client C: Multinational SaaS provider
5.19 IMPACT OF 2025 US TARIFF - OVERVIEW
5.19.1 INTRODUCTION
5.20 KEY TARIFF RATES
5.21 PRICE IMPACT ANALYSIS
5.22 IMPACT ON COUNTRY/REGION
5.22.1 NORTH AMERICA
5.22.2 EUROPE
5.22.3 ASIA PACIFIC
5.23 IMPACT ON INDUSTRY
6 NOC AS A SERVICE MARKET, BY SERVICE TYPE
6.1 INTRODUCTION
6.1.1 SERVICE TYPE: NOC AS A SERVICE MARKET DRIVERS
8.2.1 BFSI DEMANDS ALWAYS-ON, AUDIT-READY NOC OPERATIONS MINIMIZING MTTR ACROSS COMPLEX, MULTI-PARTY NETWORKS WITH DISCIPLINED CHANGE GOVERNANCE
8.3 HEALTHCARE & LIFE SCIENCES
8.3.1 HEALTHCARE REQUIRES CONTINUOUS, CLINICALLY AWARE NOC OPERATIONS PRESERVING UPTIME AND EVIDENCE FOR STRINGENT PRIVACY AND ACCREDITATION CONTROLS
8.4 GOVERNMENT & PUBLIC SECTOR
8.4.1 PUBLIC-SECTOR BUYERS EXPECT NOCAAS WITH COMPLIANCE-FIRST MONITORING, AUDITABLE CHANGE/INCIDENT EVIDENCE, AND ALIGNMENT TO MODERNIZED FEDRAMP-STYLE CONTINUOUS MONITORING
8.5 TELECOM & CSVS
8.5.1 TELECOM/CSV ADOPTION CENTERS ON GNOC-STYLE SCALE, FIELD COORDINATION, AND POLICY-DRIVEN SERVICE ASSURANCE SPANNING CARRIER WAN AND ENTERPRISE ACCESS
8.6 IT & ITES
8.6.1 IT/ITES FAVORS SCALABLE, AUTOMATION-RICH OFFSITE NOCAAS TIGHTLY INTEGRATED WITH ITSM TO SUSTAIN UPTIME AND CUSTOMER COMMITMENTS
8.7 RETAIL & E-COMMERCE
8.7.1 RETAIL/E-COMMERCE RELIES ON NOCAAS TO PREVENT AND RAPIDLY RESOLVE OUTAGES DURING PEAK TRADING, PAIRING OBSERVABILITY WITH STRICT CHANGE DISCIPLINE
8.8 ENERGY & UTILITIES
8.8.1 ENERGY NOCAAS BLENDS REAL-TIME MONITORING OF DISTRIBUTED ASSETS WITH PERFORMANCE MANAGEMENT AND FIELD COORDINATION TO MAINTAIN AVAILABILITY AND SAFETY
8.9 TRANSPORTATION & LOGISTICS
8.9.1 TRANSPORTATION/LOGISTICS USES NOCAAS TO DETECT AND REMEDIATE EDGE ISSUES EARLY, COORDINATING FIELD ACTIONS TO AVOID COSTLY, CASCADING DISRUPTIONS
8.10 OTHER VERTICALS
9 NOC AS A SERVICE MARKET, BY REGION
9.1 INTRODUCTION
9.2 NORTH AMERICA
9.2.1 NORTH AMERICA: MACROECONOMIC OUTLOOK
9.2.2 US
9.2.2.1 Automation-first, compliance-driven NOCaaS adoption to drive demand
9.2.3 CANADA
9.2.3.1 Cloud growth, privacy needs, and hybrid work to drive NOCaaS adoption
9.3 EUROPE
9.3.1 EUROPE: MACROECONOMIC OUTLOOK
9.3.2 GERMANY
9.3.2.1 Strict data protection, industrial uptime, and EU-resident operations to drive NOCaaS growth
9.3.3 UK
9.3.3.1 Outcome-driven SLAs, disciplined governance, and executive-ready reporting to drive NOCaaS adoption
9.3.4 FRANCE
9.3.4.1 Sovereignty, compliance, and localized reporting to drive NOCaaS demand
9.3.5 SPAIN
9.3.5.1 Cost discipline, EU compliance, and distributed estates to drive NOCaaS market
9.3.6 ITALY
9.3.6.1 Legacy interconnects, modernization needs, and sector compliance to drive NOCaaS uptake
9.3.7 REST OF EUROPE
9.4 ASIA PACIFIC
9.4.1 ASIA PACIFIC: MACROECONOMIC OUTLOOK
9.4.2 CHINA
9.4.2.1 Cloud growth, 5G expansion, and strict data rules make China largest NOCaaS market in Asia Pacific
9.4.3 JAPAN
9.4.3.1 High uptime demands in telecom, manufacturing, and finance to drive Japan's NOCaaS growth
9.4.4 INDIA
9.4.4.1 Cloud expansion, fintech growth, and telecom modernization to drive India's NOCaaS market
9.4.5 SOUTH KOREA
9.4.5.1 Dense 5G/edge networks and media/gaming demand push South Korea's NOCaaS growth
9.4.6 AUSTRALIA & NEW ZEALAND
9.4.6.1 Banking, mining, and utilities spread across vast geographies to drive ANZ's NOCaaS adoption
9.4.7 SINGAPORE
9.4.7.1 Singapore's role as a financial and cloud hub to drive NOCaaS demand
9.4.8 REST OF ASIA PACIFIC
9.5 MIDDLE EAST & AFRICA
9.5.1 MIDDLE EAST & AFRICA: MACROECONOMIC OUTLOOK
9.5.2 KSA
9.5.2.1 Vision 2030 digitalization, cloud-first policies, and hyperscaler expansions to drive rapid NOCaaS growth in KSA
9.5.3 UAE
9.5.3.1 Cloud adoption, cyber resilience, and outcome-based managed services to drive UAE's NOCaaS demand
9.5.4 SOUTH AFRICA
9.5.4.1 Hybrid networks, data center hubs, and power reliability challenges to drive South Africa's NOCaaS adoption
9.5.5 REST OF MIDDLE EAST & AFRICA
9.6 LATIN AMERICA
9.6.1 LATIN AMERICA: MACROECONOMIC OUTLOOK
9.6.2 BRAZIL
9.6.2.1 Centralized NOC operations across multiple providers to drive demand
9.6.3 MEXICO
9.6.3.1 Integration of hybrid cloud and application monitoring with local field support to ensure continuous operational stability
9.6.4 REST OF LATIN AMERICA
10 COMPETITIVE LANDSCAPE
10.1 INTRODUCTION
10.2 KEY PLAYER STRATEGIES/RIGHT TO WIN, 2022-2025
10.3 MARKET SHARE ANALYSIS, 2024
10.3.1 MARKET RANKING ANALYSIS
10.4 REVENUE ANALYSIS, 2020-2024
10.5 BRAND/PRODUCT COMPARISON
10.6 COMPANY VALUATION AND FINANCIAL METRICS
10.7 COMPANY EVALUATION MATRIX: KEY PLAYERS, 2024
10.7.1 STARS
10.7.2 EMERGING LEADERS
10.7.3 PERVASIVE PLAYERS
10.7.4 PARTICIPANTS
10.7.5 COMPANY FOOTPRINT: KEY PLAYERS, 2024
10.7.5.1 Company footprint
10.7.5.2 Region footprint
10.7.5.3 Service type footprint
10.7.5.4 Support model footprint
10.7.5.5 Vertical footprint
10.8 COMPANY EVALUATION MATRIX: STARTUPS/SMES, 2024