클린 라벨 식품 첨가물 시장 : 기회, 성장 촉진 요인, 산업 동향 분석, 예측(2025-2034년)
Clean Labelled Food Additives Market Opportunity, Growth Drivers, Industry Trend Analysis, and Forecast 2025 - 2034
상품코드:1755211
리서치사:Global Market Insights Inc.
발행일:2025년 05월
페이지 정보:영문 225 Pages
라이선스 & 가격 (부가세 별도)
ㅁ Add-on 가능: 고객의 요청에 따라 일정한 범위 내에서 Customization이 가능합니다. 자세한 사항은 문의해 주시기 바랍니다.
한글목차
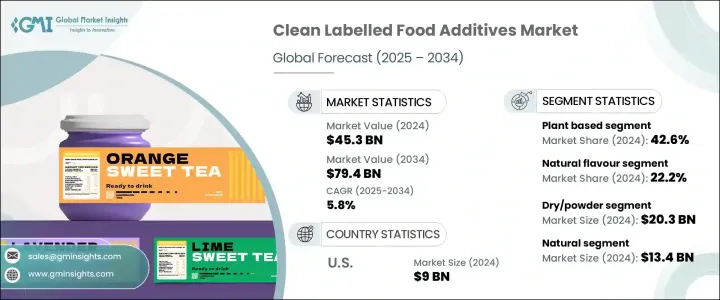
세계의 클린 라벨 식품 첨가물 시장은 2024년에는 453억 달러로 평가되었고, CAGR 5.8%로 성장하여 2034년에는 794억 달러에 이를 것으로 추정됩니다.
식품의 투명성, 천연 유래, 최소한의 가공에 대한 소비자의 의식이 높아지면서 이 시장의 형성에 중요한 역할을 하고 있습니다. 인식하기 쉽고 이해하기 쉬운 재료에 대한 수요가 증가함에 따라 식품 제조업체들은 성능이나 유통기한을 손상시키지 않는 깨끗한 라벨 솔루션을 선택하고 있습니다. 식물, 미생물, 미네랄, 동물에서 유래하는 이러한 첨가제는 가공 식품의 맛, 외관 및 품질을 유지하면서 합성 대체품으로 널리 사용됩니다.
그 기능은 신선도 유지, 풍미 향상, 식감 개선, 유화 지원, 천연 색상과 단맛 제공에 이르렀습니다. 식품에 대한 선호에 의해 지원되고 있습니다. 그 결과, 클린 라벨의 제형이, 주요 카테고리의 식품 브랜드에 있어서 불가결한 전략이 되어, 소비자의 신뢰를 유지해, 최소한의 가공으로 몸에 좋은 식품을 요구하는 시장 수요에 응할 수 있게 하고 있습니다.
시장 범위
시작 연도
2024년
예측 기간
2025-2034년
초기 시장 규모
453억 달러
시장 규모 예측
794억 달러
CAGR
5.8%
주요 원료 중 천연 향료는 2024년에 22.2%의 점유율을 차지했고, 2034년까지의 CAGR은 5.8%를 나타낼 전망입니다. 이 성분들은 과일, 허브, 향신료 및 기타 식물성 원료에서 추출되어 진정성을 추구하는 소비자들에게 매력적입니다. 인공적인 성분에 의지하지 않고, 유제품, 구운 과자, 음료, 스낵 과자의 맛을 향상시키는 범용성이, 클린 라벨 제품 개발에 있어서의 중요성이 커지고 있음을 뒷받침합니다.
원료 공급원별로 보면, 식물 유래의 첨가물은 2024년에 42.6%의 점유율로 시장을 선도했고, 2034년까지의 CAGR은 6%를 나타낼 전망입니다. 콩류 유래의 클린 라벨 원료 수요를 촉진하고 있습니다. 이 원료는 합성 화합물의 천연 대체물을 제공하는 것으로 클린 라벨의 기대에 응해, 그 결과, 브랜드는 윤리적 및 환경적 의식을 반영한 제품을 처방할 수 있습니다.
형태별로는 건조 또는 분말 부문이 2024년에 203억 달러가 넘는 수익을 올렸습니다. 보존 기간이 길고 보관이 용이하며 자동화된 제조 공정에 적합하기 때문에 구운 과자, 스낵 과자, 음료 믹스에 이상적인 선택이 되고 있습니다. 그들의 광범위한 사용은 제조업체와 소비자 모두에게 제공하는 편리함과 안정성에서 비롯됩니다. 한편 액체 첨가물은 특히 소스나 유제품 등, 블렌드의 용이함이나 풍미의 일관성이 중시되는 용도로 인기를 모으고 있습니다.
인증 관점에서 볼 때 천연 부문은 2024년에 134억 달러에 이르렀으며, 건강, 투명성, 최소한의 가공이라는 강한 관련성을 통해 시장을 독점하고 있습니다. 이어 합성화학물질과 유전자조합에 대한 우려로 인해 유기농과 비유전자 재조합의 라벨에 대한 수요가 높아지고 있습니다.
최종 용도 카테고리 중 베이커리 및 과자류가 가장 큰 시장 점유율을 차지하며 2024년 기여율은 24.3%로, 2034년까지의 CAGR은 6.2%를 나타낼 전망입니다. 제품 유래의 원료가 선호되기 때문에 이 분야의 기술 혁신이 계속 추진되고 있습니다.
음료 분야도 천연 음료와 기능성 음료의 인기가 높아짐에 따라 꾸준한 성장을 이루고 있습니다. 건강 지향의 쇼핑객에게 어필하기 위해서, 깨끗한 배합으로 전환하고 있습니다.
기능성면에서 풍미와 색 강화가 2024년에 136억 달러로 이 부문을 이끌었습니다. 보다 선명하고 매력적인, 자연적인 풍미의 식품을 요구하는 움직임은 특히 외관이 구입 의사 결정에 크게 영향을 주는 부문 식물에서 추출물, 허브, 과일이 인공적인 착색료와 향료를 대체하는 것이 일반적이며, 브랜드가 보다 건강하고 시각적으로 매력적인 식품을 요구하는 수요를 따르는데 도움이 됩니다.
소비자 프로파일별로 시장을 구분하면 2024년에는 기존 제품이 시장 전체의 30.9%를 차지했고 2034년까지 연평균 복합 성장률(CAGR) 5.7%로 확대될 것으로 예측됩니다. 브랜드 각 사가 빵, 소스, 스낵 과자 등의 정평 상품을 매일의 깨끗한 식생활의 기대에 응할 수 있도록 개량에 임하고 있기 때문에 이러한 상품은 클린 라벨 통합의 중심이 되고 있습니다. 프리미엄, 웰니스, 어린이용 제품이 계속 클린 라벨의 특징을 강조하는 한편, 주류 상품에 이러한 원재료가 포함되는 것은 클린 라벨이 더 이상 틈새 개념이 아니라 새로운 표준임을 나타냅니다.
지역별로는 미국이 북미의 클린 라벨 식품 첨가물 시장을 선도하여, 2024년에는 90억 달러에 이르렀으며, 2034년까지의 CAGR은 5.6%를 나타낼 전망입니다. 이러한 리더십은 소비자 인식 제고, 규제 지원, 광범위한 클린 라벨 제품 제공에서 비롯됩니다. 미국의 소비자는 특히 원재료에 신경을 쓰고 인공 첨가물을 포함하지 않는 제품을 요구하게 되어 있습니다.
세계의 클린 라벨 식품 첨가물 분야의 주요 기업으로는 Cargill, Ingredion, ADM, Kerry Group, Tate & Lyle. 등이 있습니다.
목차
제1장 분석 방법과 범위
제2장 주요 요약
제3장 업계 인사이트
생태계 분석
업계에 미치는 영향요인
성장 가능성 분석
규제 상황
트럼프 정권에 의한 관세
무역에 미치는 영향
업계에 미치는 영향
공급측의 영향(원재료)
수요측의 영향(판매가격)
영향을 받는 주요 기업
전략적인 업계 대응
공급망 재구성
가격 설정 및 제품 전략
정책관여
전망과 향후 검토 사항
장래 시장 동향
Porter's Five Forces 분석
PESTEL 분석
제3장 업계 인사이트
생태계 분석
공급자의 상황
이익률
각 단계에서의 부가가치
밸류체인에 영향을 주는 요인
혁신
업계에 미치는 영향요인
성장 촉진요인
업계의 잠재적 위험과 과제
시장 기회
성장 가능성 분석
규제 상황
북미
유럽
아시아태평양
라틴아메리카
중동 및 아프리카
Porter's Five Forces 분석
PESTEL 분석
가격 동향
지역별
제품별
장래 시장 동향
기술과 혁신의 상황
현재의 기술 동향
신흥기술
특허 상황
무역 통계(HS코드)
주요 수입국
주요 수출국
지속가능성과 환경 측면
지속가능한 관행
폐기물 삭감 전략
생산에 있어서의 에너지 효율
환경 친화적 인 노력
제조 공정 개요
원재료의 조달과 조합
추출 및 처리 방법
정제 및 표준화
품질 관리 및 테스트
포장과 보관
생산비용 분석
원재료비
처리 비용
인건비
포장 비용
제조 간접비
비용 최적화 전략
제조시설 분석
주요 제조 거점
생산 능력 평가
시설 확장 계획
공급망의 과제와 해결책
원재료 조달의 과제
품질 일관성 문제
물류와 수송
재고 관리
제조 공정에서의 지속가능성
에너지 효율 대책
절수 대책
폐기물의 삭감과 관리
이산화탄소 배출량 저감 전략
세계의 규제 틀
지역 규제 틀
북미
FDA 규제 및 가이드라인
USDA 유기농 기준
주 수준의 규제
유럽
EFSA 가이드라인
EU의 식품 첨가물 규제
EU의 유기 규제
아시아태평양
중국의 식품 첨가물 규제
일본의 식품 첨가물 규격
기타 지역규제
세계 기타 지역
클린 라벨의 정의와 기준
업계 정의 표준
소매업체가 정의한 기준
클린 라벨에 대한 소비자의 인식
인증 및 라벨 표시의 요건
유기농 인증
비유전자 재조합 인증
내츄럴 클레임 인증
알레르기 표시
컴플라이언스 과제와 전략
장래의 규제 동향과 그 영향
환경, 사회, 거버넌스 분석
환경 영향 평가
탄소 발자국 분석
물의 사용과 관리
토지 이용과 생물 다양성에 미치는 영향
폐기물의 발생과 관리
사회적 책임의 실천
노동 관행과 노동 조건
커뮤니티 참여 및 지원
건강과 영양에 대한 영향
윤리적인 조달 관행
거버넌스와 윤리적 배려
기업 지배 구조
투명성과 보고
윤리적인 비즈니스 관행
이해관계자 참여
주요 기업의 ESG 실적 벤치마크
ESG 리스크 평가 및 경감 전략
클린 라벨 식품 첨가물 업계에서 향후 ESG 동향
소비자 행동과 시장 동향의 분석
소비자의 기호와 구매 패턴
클린 라벨의 인식과 이해
프리미엄을 지불할 의사
식재회피 행동
라벨을 읽는 방법
클린 라벨 소비자의 인구 통계 분석
연령층 분석
소득 수준 분석
지리적 분포
라이프 스타일과 심리적 세분화
클린 라벨 식품 첨가물에 대한 소비자의 인식
인식되는 건강상의 이점
인식되는 환경상의 이점
지각되는 품질과 가치
신뢰와 신용 요인
새로운 소비자 동향
식물성 식품과 비건 식품의 취향
알레르겐 프리와 프리프롬의 동향
기능성 식품과 강화 식품의 기호
지속가능성과 윤리적 소비
디지털 변혁이 소비자 참여에 미치는 영향
소비자 피드백 분석과 그 영향
기술적 상황과 혁신 분석
현재의 기술 동향
신흥기술
고급 추출 기술
발효와 생명공학
나노기술의 응용
고압·비열기술
제품 혁신 동향
다기능 성분
종래의 첨가물의 대체품
새로운 식물 유래 성분
업사이클된 재료
처방과 응용의 혁신
유통기한 연장 솔루션
풍미를 높이는 기술
텍스처링 솔루션
색안정성의 혁신
포장 및 배송 시스템의 혁신
지속 가능한 포장
스마트 패키지
물약 제어 패키지
유통기한을 연장한 패키지
연구개발활동과 혁신허브
지역별 기술 도입 동향
장래의 기술 로드맵(2025-2034년)
가격 분석과 경제적 요인
가격 동향
과거의 가격 동향
현재 가격 시나리오
가격 예측
가격에 영향을 미치는 요인
원재료비
처리 비용
컴플라이언스 비용
시장 경쟁
소비자의 지불 의향
가격 전략
프리미엄 vs. 매스마켓
부가가치 가격 설정
번들 가격
지역별 가격 차이
가격과 가치의 관계 분석
경제 지표
GDP 성장률과 소비자 지출
인플레이션과 통화 변동
농산물 가격
에너지 비용
공급자의 상황
이익률 분석
주요 뉴스와 대처
규제 상황
영향요인
성장 촉진요인
클린 라벨 제품에 대한 소비자의 기호의 고조
확대하는 식품 및 음료 업계
클린 라벨 원료를 필요로 하는 식물 유래 및 유기농 식품의 확대
업계의 잠재적 위험 및 과제
클린 라벨 식품 첨가물의 고비용
인공 보존료를 사용하지 않고 맛, 식감, 보존 기간을 유지하는 것의 과제
성장 가능성 분석
Porter's Five Forces 분석
PESTEL 분석
제4장 경쟁 구도
소개
기업의 시장 점유율 분석
지역별
북미
유럽
아시아태평양
라틴아메리카
중동 및 아프리카
기업 매트릭스 분석
주요 시장 기업의 경쟁 분석
경쟁 포지셔닝 매트릭스
주요 발전
기업 합병 및 인수(M&A)
사업 제휴 및 협력
신제품 발매
확장 계획
제5장 시장 규모와 예측 : 성분유형별(2021-2034년)
주요 동향
천연 착색료
천연 향료
천연 방부제
천연 감미료
하이드로콜로이드 텍스처 라이저
기능성 천연 전분
천연 유화제
기타
제6장 시장 규모와 예측 : 원료별(2021-2034년)
주요 동향
식물 유래
동물 유래
미생물/발효
미네랄 유래
제7장 시장 규모와 예측 : 형상별(2021-2034년)
주요 경향
건조/분말
액체
기타
제8장 시장 규모와 예측 : 인증별(2021-2034년)
주요 경향
유기농
비유전자 재조합
천연
클린 라벨 인증
기타
제9장 시장 규모와 예측 : 최종 용도별(2021-2034년)
주요 경향
베이커리?과자류
음료
유제품?냉동식품
가공식품
소스 및 조미료
스낵 및 인스턴트 식품
식육, 닭고기 및 해산물
기타
제10장 시장 규모와 예측 : 기능별(2021-2034년)
주요 경향
보존
텍스처 변경
풍미/색의 강화
유화
감미료
기타
제11장 시장 규모와 예측 : 소비자별(2021-2034년)
주요 경향
종래품
프리미엄 제품
건강·웰빙 제품
어린이용 제품
기타
제12장 시장 추정 및 예측 : 지역별(2021-2034년)
주요 동향
북미
미국
캐나다
유럽
독일
영국
프랑스
스페인
이탈리아
아시아태평양
중국
인도
일본
호주
한국
라틴아메리카
브라질
멕시코
아르헨티나
중동 및 아프리카
사우디아라비아
남아프리카
아랍에미리트(UAE)
제13장 기업 프로파일
ADM
Cargill
Corbion Inc.
DSM
Frutarom
Ingredion
International Flavors &Fragrances Inc.
Kemin Industries, Inc.
Kerry Group
Sensient Technologies
Tate &Lyle
SHW
영문 목차
영문목차
The Global Clean Labelled Food Additives Market was valued at USD 45.3 billion in 2024 and is estimated to grow at a CAGR of 5.8% to reach USD 79.4 billion by 2034. The growing awareness among consumers about food transparency, natural origins, and minimal processing is playing a significant role in shaping this market. With the increasing demand for recognizable, easy-to-understand ingredients, food manufacturers are opting for clean label solutions that don't compromise on performance or shelf life. These additives, derived from plants, microbes, minerals, and animals, are being widely used to replace synthetic counterparts while maintaining the taste, appearance, and quality of processed foods.
Their functions extend to preserving freshness, enhancing flavors, improving texture, supporting emulsification, and delivering natural colors and sweetness. This shift toward simplicity and natural origins in ingredient sourcing is supported by rising consumer skepticism toward artificial additives and a preference for food that aligns with healthy and ethical choices. As a result, clean label formulations have become a vital strategy for food brands across major categories, allowing them to retain consumer trust and respond to market demand for minimally processed, better-for-you foods.
Market Scope
Start Year
2024
Forecast Year
2025-2034
Start Value
$45.3 Billion
Forecast Value
$79.4 Billion
CAGR
5.8%
Among the key ingredients, natural flavors commanded a 22.2% share of the market in 2024 and are projected to expand at a CAGR of 5.8% through 2034. These ingredients appeal to consumers seeking authenticity, as they are derived from fruits, herbs, spices, and other plant-based sources. Their versatility in enhancing the taste of dairy products, baked goods, beverages, and snacks without relying on artificial components supports their growing prominence in clean label product development.
When viewed by ingredient source, plant-based additives led the market with a 42.6% share in 2024 and are expected to grow at a CAGR of 6% through 2034. Rising interest in sustainability, animal welfare, and plant-forward diets has fueled the demand for clean label ingredients derived from fruits, vegetables, grains, and legumes. These ingredients meet clean label expectations by offering natural alternatives to synthetic compounds, thus enabling brands to formulate products that reflect ethical and environmental consciousness.
Based on form, the dry or powder segment generated revenues exceeding USD 20.3 billion in 2024. Their longer shelf life, ease of storage, and compatibility with automated manufacturing processes make them an ideal choice for baked goods, snacks, and drink mixes. Their widespread use stems from the convenience and stability they offer to manufacturers and consumers alike. Meanwhile, liquid additives are gaining traction, particularly in applications such as sauces and dairy products, where ease of blending and consistency in flavor delivery are valued.
From a certification standpoint, the natural segment reached USD 13.4 billion in 2024, dominating the market due to its strong association with health, transparency, and minimal processing. Consumers tend to trust the "natural" label, believing it represents safety and ingredient integrity. This is followed by a growing demand for organic and non-GMO labels, driven by concerns over synthetic chemicals and genetic modification. Although still emerging, clean label certified products are seen as offering the highest level of assurance and are likely to gain ground in regulated or high-end markets.
Among end-use categories, bakery and confectionery products accounted for the largest market share, contributing 24.3% in 2024 and expected to grow at a CAGR of 6.2% through 2034. The preference for clean, plant-based ingredients in baked treats like bread, cakes, and cookies continues to drive innovation in this segment. Food producers are substituting artificial sweeteners, colors, and preservatives with clean label options to satisfy customer demand for healthier choices.
The beverage segment is also witnessing steady growth due to the increasing popularity of natural and functional drinks. Clean label additives are being used in dairy and frozen foods, particularly in yogurts and frozen desserts, as consumers demand transparency in everyday items. Sauces, condiments, snacks, and ready meals are also shifting toward clean formulations to appeal to health-focused shoppers. The meat, poultry, and seafood categories are gradually reducing synthetic preservatives and coloring agents to align with clean label standards while maintaining food safety.
In terms of functionality, flavor and color enhancement led the segment with USD 13.6 billion in 2024. The drive for more vibrant, appealing, and naturally flavored foods continues to rise, especially in segments where appearance heavily influences purchase decisions. Plant-based extracts, herbs, and fruits commonly replace artificial colors and flavors, helping brands align with the demand for healthier, visually attractive foods.
The market segmented by consumer profile shows that conventional products accounted for 30.9% of the total market in 2024 and are forecast to expand at a CAGR of 5.7% through 2034. These products have become a focal point for clean label integration as brands work to reformulate staple items like bread, sauces, and snacks to meet everyday clean eating expectations. While premium, wellness, and children's products continue to highlight clean label features, the inclusion of such ingredients in mainstream goods shows that clean label is no longer a niche concept-it's the new standard.
In regional terms, the U.S. led the North American clean labelled food additives market, reaching USD 9 billion in 2024, and is expected to grow at a CAGR of 5.6% through 2034. This leadership stems from heightened consumer awareness, regulatory support, and extensive clean label product offerings. American consumers are especially mindful of ingredients and increasingly demand products free from artificial additives. Manufacturers are responding by incorporating clean label principles across nearly every food category.
Leading players in the global clean labelled food additives space include Cargill, Ingredion, ADM, Kerry Group, and Tate & Lyle. These companies have strong global footprints, diverse product portfolios, and robust distribution systems, positioning them as key suppliers for the increasing demand for clean label solutions worldwide.
Table of Contents
Chapter 1 Methodology & Scope
1.1 Market scope & definition
1.2 Base estimates & calculations
1.3 Forecast calculation
1.4 Data sources
1.4.1 Primary
1.4.2 Secondary
1.4.2.1 Paid sources
1.4.2.2 Public sources
1.5 Primary research and validation
1.5.1 Primary sources
1.5.2 Data mining sources
Chapter 2 Executive Summary
2.1 Industry 360° synopsis
2.2 Key market trends
2.2.1 Regional
2.2.2 Ingredient type
2.2.3 Form
2.2.4 Origin
2.2.5 Beverage type
2.2.6 Flavor type
2.3 TAM Analysis, 2025-2034
2.4 CXO perspectives: Strategic imperatives
2.4.1 Executive decision points
2.4.2 Critical success factors
2.5 Future Outlook and Strategic Recommendations
Chapter 3 Industry Insights
3.1 Industry ecosystem analysis
3.1.1 Supplier Landscape
3.1.2 Profit Margin
3.1.3 Value addition at each stage
3.1.4 Factor affecting the value chain
3.1.5 Disruptions
3.2 Industry impact forces
3.2.1 Growth drivers
3.2.2 Industry pitfalls and challenges
3.2.3 Market opportunities
3.3 Growth potential analysis
3.4 Regulatory landscape
3.4.1 North America
3.4.2 Europe
3.4.3 Asia Pacific
3.4.4 Latin America
3.4.5 Middle East & Africa
3.5 Porter's analysis
3.6 PESTEL analysis
3.6.1 Technology and Innovation landscape
3.6.2 Current technological trends
3.6.3 Emerging technologies
3.7 Price trends
3.7.1 By region
3.7.2 By product
3.8 Future market trends
3.9 Technology and Innovation landscape
3.9.1 Current technological trends
3.9.2 Emerging technologies
3.10 Patent Landscape
3.11 Trade statistics (HS code)
3.11.1 Major importing countries
3.11.2 Major exporting countries
3.12 Sustainability and environmental aspects
3.12.1 Sustainable practices
3.12.2 Waste reduction strategies
3.12.3 Energy efficiency in production
3.12.4 Eco-friendly initiatives
3.13 Manufacturing process overview
3.13.1 Raw material procurement and preparation
3.13.2 Extraction and processing methods
3.13.3 Purification and standardization
3.13.4 Quality control and testing
3.13.5 Packaging and storage
3.14 Production cost analysis
3.14.1 Raw material costs
3.14.2 Processing costs
3.14.3 Labor costs
3.14.4 Packaging costs
3.14.5 Manufacturing overheads
3.14.6 Cost optimization strategies
3.15 Manufacturing facilities analysis
3.15.1 Key manufacturing locations
3.15.2 Production capacity assessment
3.15.3 Facility expansion plans
3.16 Supply chain challenges and solutions
3.16.1 Raw material sourcing challenges
3.16.2 Quality consistency issues
3.16.3 Logistics and transportation
3.16.4 Inventory management
3.17 Sustainability in manufacturing processes
3.17.1 Energy efficiency measures
3.17.2 Water conservation practices
3.17.3 Waste reduction and management
3.17.4 Carbon footprint reduction strategies
3.18 Global regulatory framework
3.18.1 Regional regulatory frameworks
3.18.1.1 North america
3.18.1.1.1 Fda regulations and guidelines
3.18.1.1.2 Usda organic standards
3.18.1.1.3 State-level regulations
3.18.1.2 Europe
3.18.1.2.1 Efsa guidelines
3.18.1.2.2 Eu food additives regulation
3.18.1.2.3 Eu organic regulations
3.18.1.3 Asia-pacific
3.18.1.3.1 China food additive regulations
3.18.1.3.2 Japan food additive standards
3.18.1.3.3 Other regional regulations
3.19 Rest of the world
3.20 Clean label definitions and standards
3.20.1 Industry-defined standards
3.20.2 Retailer-defined standards
3.20.3 Consumer perception of clean label
3.21 Certification and labeling requirements
3.21.1 Organic certification
3.21.2 Non-gmo verification
3.21.3 Natural claims certification
3.21.4 Allergen labeling
3.22 Compliance challenges and strategies
3.23 Future regulatory trends and implications
3.24 Environmental, social, and governance analysis
3.24.1 Environmental impact assessment
3.24.1.1 Carbon footprint analysis
3.24.1.2 Water usage and management
3.24.1.3 Land use and biodiversity impact
3.24.1.4 Waste generation and management
3.25 Social responsibility practices
3.25.1.1 Labor practices and working conditions
3.25.1.2 Community engagement and support
3.25.1.3 Health and nutrition impact
3.25.1.4 Ethical sourcing practices
3.26 Governance and ethical considerations
3.26.1.1 Corporate governance structures
3.26.1.2 Transparency and reporting
3.26.1.3 Ethical business practices
3.26.1.4 Stakeholder engagement
3.27 Esg performance benchmarking of key players
3.28 Esg risk assessment and mitigation strategies
3.29 Future esg trends in the clean labelled food additives industry
3.30 Consumer behavior and market trends analysis
3.30.1 Consumer preferences and purchasing patterns
3.30.1.1 Clean label awareness and understanding
3.30.1.2 Willingness to pay premium
3.30.1.3 Ingredient avoidance behaviors
3.30.1.4 Label reading habits
3.30.2 Demographic analysis of clean label consumers
3.30.2.1 Age group analysis
3.30.2.2 Income level analysis
3.30.2.3 Geographic distribution
3.30.2.4 Lifestyle and psychographic segmentation
3.30.3 Consumer perception of clean labelled food additives
3.30.3.1 Perceived health benefits
3.30.3.2 Perceived environmental benefits
3.30.3.3 Perceived quality and value
3.30.3.4 Trust and credibility factors
3.30.4 Emerging consumer trends
3.30.4.1 Plant-based and vegan preferences
3.30.4.2 Allergen-free and free-from trends
3.30.4.3 Functional and fortified food preferences
3.30.4.4 Sustainability and ethical consumption
3.30.5 Impact of digital transformation on consumer engagement
3.30.6 Consumer feedback analysis and implications
3.31 Technological landscape and innovation analysis
3.31.1 Current technological trends
3.31.2 Emerging technologies
3.31.2.1 Advanced extraction technologies
3.31.2.2 Fermentation and biotechnology
3.31.2.3 Nanotechnology applications
3.31.2.4 High-pressure and non-thermal tech
3.31.3 Product innovation trends
3.31.3.1 Multi-functional ingredients
3.31.3.2 Alternatives to traditional additives
3.31.3.3 Novel plant-based ingredients
3.31.3.4 Upcycled ingredients
3.31.4 Formulation and application innovations
3.31.4.1 Shelf-life extension solutions
3.31.4.2 Flavor enhancement techniques
3.31.4.3 Texturizing solutions
3.31.4.4 Color stability innovations
3.31.5 Packaging and delivery system innovations
3.31.5.1 Sustainable packaging
3.31.5.2 Smart packaging
3.31.5.3 Portion control packaging
3.31.5.4 Extended shelf-life packaging
3.31.6 R&d activities and innovation hubs
3.31.7 Technology adoption trends across regions
3.31.8 Future technology roadmap (2025-2034)
3.32 Pricing analysis and economic factors
3.32.1 Pricing trends
3.32.1.1 Historical price trends
3.32.1.2 Current pricing scenario
3.32.1.3 Price forecast
3.32.2 Factors affecting pricing
3.32.2.1 Raw material costs
3.32.2.2 Processing costs
3.32.2.3 Compliance costs
3.32.2.4 Market competition
3.32.2.5 Consumer willingness to pay
3.32.3 Pricing strategies
3.32.3.1 Premium vs. Mass market
3.32.3.2 Value-added pricing
3.32.3.3 Bundle pricing
3.32.4 Regional price variations
3.32.5 Price-value relationship analysis
3.32.6 Economic indicators
3.32.6.1 Gdp growth and consumer spending
3.32.6.2 Inflation and currency fluctuations
3.32.6.3 Agricultural commodity prices
3.32.6.4 Energy cost
3.33 Supplier landscape
3.34 Profit margin analysis
3.35 Key news & initiatives
3.36 Regulatory landscape
3.37 Impact forces
3.37.1 Growth drivers
3.37.1.1 The rising consumer preference for clean-label products
3.37.1.2 Expanding food & beverage industry
3.37.1.3 Expansion of plant-based and organic food products requiring clean-label ingredient
3.37.2 Industry pitfalls & challenges
3.37.2.1 High cost of clean labelled food additives
3.37.2.2 Challenges in maintaining taste, texture, and shelf life without artificial preservatives
3.38 Growth potential analysis
3.39 Porter's analysis
3.40 PESTEL analysis
Chapter 4 Competitive Landscape, 2024
4.1 Introduction
4.2 Company market share analysis
4.2.1 By region
4.2.2 North America
4.2.3 Europe
4.2.4 Asia Pacific
4.2.5 LATAM
4.2.6 MEA
4.3 Company matrix analysis
4.4 Competitive analysis of major market players
4.5 Competitive positioning matrix
4.6 Key developments
4.6.1 Mergers & acquisitions
4.6.2 Partnerships & collaborations
4.6.3 New Product Launches
4.6.4 Expansion Plans
Chapter 5 Market Size and Forecast, By Ingredient Type 2021 - 2034 (USD Billion, Kilo Tons)
5.1 Key trends
5.2 Natural colors
5.3 Natural flavors
5.4 Natural preservatives
5.5 Natural sweeteners
5.6 Hydrocolloids and texturizers
5.7 Functional native starches
5.8 Natural emulsifiers
5.9 Other
Chapter 6 Market Size and Forecast, By Source, 2021 - 2034 (USD Billion, Kilo Tons)
6.1 Key trends
6.2 Plant-based
6.3 Animal-based
6.4 Microbial/fermentation
6.5 Mineral-based
Chapter 7 Market Size and Forecast, By Form, 2021 - 2034 (USD Billion, Kilo Tons)
7.1 Key trend
7.2 Dry/powder
7.3 Liquid
7.4 Others
Chapter 8 Market Size and Forecast, By Certification, 2021 - 2034 (USD Billion, Kilo Tons)
8.1 Key trend
8.2 Organic
8.3 Non-GMO
8.4 Natural
8.5 Clean label certified
8.6 Others
Chapter 9 Market Size and Forecast, By End Use, 2021 - 2034 (USD Billion, Kilo Tons)
9.1 Key trend
9.2 Bakery & confectionery
9.3 Beverages
9.4 Dairy & frozen
9.5 Processed foods
9.6 Sauces & condiments
9.7 Snacks & convenience
9.8 Meat, poultry & Seafood
9.9 Others
Chapter 10 Market Size and Forecast, By Functionality, 2021 - 2034 (USD Billion, Kilo Tons)
10.1 Key trend
10.2 Preservation
10.3 Texture modification
10.4 Flavor/color enhancement
10.5 Emulsification
10.6 Sweetening
10.7 Others
Chapter 11 Market Size and Forecast, By Consumer, 2021 - 2034 (USD Billion, Kilo Tons)
11.1 Key trend
11.2 Conventional product
11.3 Premium product
11.4 Health & wellness product
11.5 Children’s products
11.6 Others
Chapter 12 Market Estimates and Forecast, By Region, 2021 - 2034 (USD Billion) (Kilo Tons)