매니지드 서비스 시장(-2035년) : 서비스 유형별, 전개 유형별, 기업 유형별, 업계 유형별, 지역별 - 산업 동향 및 예측
Managed Services Market, Till 2035: Distribution by Type of Service, Type of Deployment, Type of Enterprise, Type of Vertical, and Geographical Regions: Industry Trends and Global Forecasts
상품코드:1821514
리서치사:Roots Analysis
발행일:On Demand Report
페이지 정보:영문 168 Pages
라이선스 & 가격 (부가세 별도)
한글목차
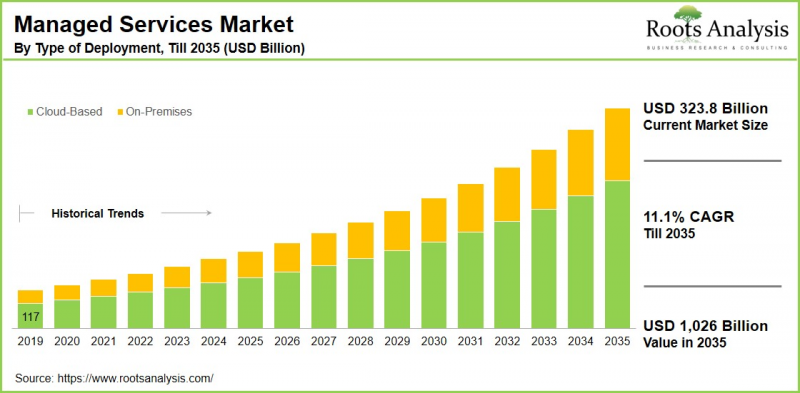
세계의 매니지드 서비스 시장 규모는 현재 3,238억 달러에서 2035년까지 1조 260억 달러에 달할 것으로 예상되며, 2035년까지 예측 기간 동안 연평균 11.1% 성장할 것으로 예측됩니다.
매니지드 서비스 시장 : 성장과 동향
IT 산업은 끊임없이 진화하고 있으며, 그 역할과 영역의 확대와 함께 디지털 전환으로 인해 매니지드 서비스의 필요성이 크게 증가하고 있습니다. 매니지드 서비스는 제3자가 비즈니스 IT 서비스를 감독하는 계약을 수반합니다. 이 모델에서 조직은 다양한 IT 기능과 인프라의 관리 및 모니터링을 외부 서비스 제공업체에 위탁합니다. 매니지드 서비스의 목적은 정형화된 업무를 전문가에게 맡겨 비용을 절감하고 서비스 품질을 향상시키는 것입니다.
매니지드 서비스 시장은 IT 인프라 관리의 복잡성과 클라우드 컴퓨팅 솔루션에 대한 선호도 증가에 힘입어 큰 변화를 겪고 있습니다. 기업들은 IT 업무를 간소화하고 경쟁 우위를 확보하기 위해 외부의 전문 지식을 활용하고 있습니다. 이러한 변화로 인해 비즈니스 연속성 및 용도 관리 서비스에 대한 수요가 증가하고 있습니다.
또한, 업무의 최적화와 생산성 향상을 목표로 하는 조직은 지속 가능한 성장에 필수적인 요소로 자리 잡고 있습니다. 이러한 상황에서 기업들은 경쟁력을 유지하기 위해 끊임없이 변화하는 기술 환경 속에서 업무의 탄력성을 확보하면서 전문가의 지식을 활용할 수 있는 매니지드 서비스 솔루션을 채택하고 있습니다. IT 인프라 관리의 미래는 특정 비즈니스 요구를 충족하는 혁신적인 맞춤형 솔루션을 제공할 수 있는 숙련된 매니지드 서비스 제공업체와의 협업의 중요성을 인식하는 데 달려있습니다. 하지만 사이버 보안 위협과 규제 준수 필요성 등 매니지드 서비스 시장의 과제는 시장 성장을 저해하는 요인으로 작용할 수 있습니다.
IT 인프라 관리 솔루션에 대한 수요 증가와 사이버 보안 문제를 해결하기 위한 관리형 보안 서비스에 대한 수요 증가에 힘입어 관리형 서비스 시장은 예측 기간 동안 크게 성장할 것으로 예측됩니다.
세계의 매니지드 서비스(Managed Services) 시장에 대해 조사했으며, 시장 규모 추정과 기회 분석, 경쟁 구도, 기업 프로파일 등의 정보를 전해드립니다.
목차
섹션 1 보고서 개요
제1장 서문
제2장 조사 방법
제3장 시장 역학
제4장 거시경제 지표
섹션 2 정성적 인사이트
제5장 주요 요약
제6장 서론
제7장 규제 시나리오
섹션 3 시장 개요
제8장 주요 기업의 종합 데이터베이스
제9장 경쟁 구도
제10장 화이트 스페이스 분석
제11장 기업 경쟁력 분석
제12장 매니지드 서비스 시장 스타트업 에코시스템
섹션 4 기업 개요
제13장 기업 개요
본 장의 개요
Accenture
Amazon
AT&T
Atos
Braodcom
Capgemini
Cisco
Digital Reality
Dimension Data
DXC
Fujitsu
GTT
HCL
IBM
Infosys
Microsoft
NTT DATA
Rackspace
ScalePad Software
Tata Communication Services
Telefonaktiebolaget
섹션 5 시장 동향
제14장 메가트렌드 분석
제15장 미충족 요구 분석
제16장 특허 분석
제17장 최근 발전
섹션 6 시장 기회 분석
제18장 세계의 매니지드 서비스 시장
제19장 시장 기회 : 서비스 유형별
제20장 시장 기회 : 전개 유형별
제21장 시장 기회 : 기업 유형별
제22장 시장 기회 : 업계 유형별
제23장 북미의 매니지드 서비스 시장 기회
제24장 유럽의 매니지드 서비스 시장 기회
제25장 아시아의 매니지드 서비스 시장 기회
제26장 중동 및 북아프리카(MENA)의 매니지드 서비스 시장 기회
제27장 라틴아메리카의 매니지드 서비스 시장 기회
제28장 기타 지역의 매니지드 서비스 시장 기회
제29장 시장 집중 분석 : 주요 기업별
제30장 인접 시장 분석
섹션 7 전략적 툴
제31장 중요 승리 전략
제32장 Porter의 Five Forces 분석
제33장 SWOT 분석
제34장 밸류체인 분석
제35장 Roots 전략적 제안
섹션 8 기타 독점 인사이트
제36장 1차 조사에서의 인사이트
제37장 보고서 결론
섹션 9 부록
LSH
영문 목차
영문목차
Managed Services Market Overview
As per Roots Analysis, the global managed services market size is estimated to grow from USD 323.8 billion in the current year to USD 1,026 billion by 2035, at a CAGR of 11.1% during the forecast period, till 2035.
The opportunity for managed services market has been distributed across the following segments:
Type of Service
Managed Backup and Disaster Recovery
Managed Communication Service
Managed UCaaS
Managed VoIP
Others
Managed IT Infrastructure Service
Manage Data Analytics
Managed Print Service
Server Management
Storage Management
Other IT and Data Center Services
Managed Mobility Services
Application Management
Device Life Cycle Management
Managed Network Services
Managed LAN
Managed VPN
Managed WAN
Managed Wi-Fi
Networking Monitoring
Others
Managed Security Service
Managed Identify & Access Management
Managed Risk and Compliance Management
Managed Security Information & Event Management
Management Farewell
Others
Type of Deployment
Cloud-Based
On-Premises
Type of Enterprise
Large Enterprises
Small and Medium-sized Enterprises
Type of Vertical
BFSI
Energy & Utility
Government
Healthcare
IT & Telecommunication
Manufacturing
Retail & E-commerce
Others
Geographical Regions
North America
US
Canada
Mexico
Other North American countries
Europe
Austria
Belgium
Denmark
France
Germany
Ireland
Italy
Netherlands
Norway
Russia
Spain
Sweden
Switzerland
UK
Other European countries
Asia
China
India
Japan
Singapore
South Korea
Other Asian countries
Latin America
Brazil
Chile
Colombia
Venezuela
Other Latin American countries
Middle East and North Africa
Egypt
Iran
Iraq
Israel
Kuwait
Saudi Arabia
UAE
Other MENA countries
Rest of the World
Australia
New Zealand
Other countries
Managed Services Market: Growth and Trends
The information technology industry is continuously evolving, and the digital transformation, along with its expanding roles and areas, has significantly increased the need for managed services. Managed services entail an arrangement where a third party oversees business IT services. In this model, organizations delegate the management and monitoring of various IT functions and infrastructure to an external service provider. The goal of managed services is to reduce costs and improve service quality by transferring routine tasks to experts.
The managed service market is undergoing significant change fueled by the growing complexity of IT infrastructure management and a rising preference for cloud computing solutions. Companies are turning to external expertise to streamline IT operations and achieve competitive advantages. This shift has led to a heightened demand for business continuity and application management services.
Moreover, organizations looking to optimize their operations and boost productivity have become essential for sustainable growth. In this landscape, to stay competitive, businesses are adopting managed service solutions that allow them to tap into expert knowledge while ensuring operational resilience within a constantly changing technological environment. The future of IT infrastructure management hinges on recognizing the importance of collaborations with skilled managed service providers capable of delivering innovative, customized solutions to meet specific business needs. Nevertheless, challenges in the managed service market, such as cybersecurity threats and the need for regulatory compliance, could hinder market growth.
Driven by the increasing demand for IT infrastructure management solutions and the escalating need for managed security services to tackle cybersecurity issues, the managed services market is expected to grow significantly during the forecast period.
Managed Services Market: Key Segments
Market Share by Type of Service
Based on type of service, the global managed services market is segmented into managed backup and disaster recovery, managed communication service, managed IT infrastructure service, managed mobility services, managed network services, and managed security services. According to our estimates, currently, the IT infrastructure services captures the majority of the market share. This can be attributed to the increasing need for dependable IT infrastructure management, aiding enterprises in overseeing their servers, storage, databases, and data centers.
However, the managed network service segment is expected to grow at a higher CAGR throughout the forecast period, propelled by a rising demand for enhanced connectivity networks that include WAN, LAN, and SD-WAN to ensure uninterrupted connectivity and dependable network performance.
Market Share by Type of Deployment
Based on type of deployment, the global managed services market is segmented into cloud-based and on-premises. According to our estimates, currently, the cloud-based deployment segment captures the majority of the market share. This can be attributed to its distinctive advantages, such as scalability, cost-effectiveness, remote accessibility, flexibility, swift implementation, and effective disaster recovery. Additionally, cloud-based services involve the outsourcing of IT operations, infrastructure, and applications to manage services that are hosted on a cloud platform.
However, the on-premises deployment is expected to grow at a higher CAGR throughout the forecast period, due to its advantages in providing enhanced security and privacy.
Market Share by Type of Enterprise
Based on type of enterprise, the global managed services market is segmented into small and medium-sized enterprises and large enterprises. According to our estimates, currently, the large enterprises capture the majority of the market share. This can be attributed to their complex operations, extensive IT infrastructure, and global reach.
However, the small and medium-sized enterprises is expected to grow at a higher CAGR during the forecast period, driven by the need for managed services due to their limited resources, insufficient internal IT capabilities to manage intricate systems, and the need for scalable solutions.
Market Share by Type of Vertical
Based on type of vertical, the global managed services market is segmented into BFSI, energy & utility, government, healthcare, it & telecommunication, manufacturing, retail & e-commerce, and others. According to our estimates, currently, the BFSI sector captures the majority of the market share. This can be attributed to the advantages of managed services in the banking, financial services, and insurance sectors, where they provide the necessary expertise and support to meet specific needs.
However, the IT and telecommunications sector is expected to grow at a higher CAGR during the forecast period. This can be attributed to the fact that these industries require IT infrastructure, cloud solutions, and network management services to adapt to rapid technological advancements.
Market Share by Geographical Regions
Based on geographical regions, the managed services market is segmented into North America, Europe, Asia, Latin America, Middle East and North Africa, and the rest of the world. According to our estimates, currently, North America captures the majority share of the market. However, the market in Asia is expected to grow at a higher CAGR during the forecast period, driven by swift digital transformation and economic development in emerging countries.
In particular, nations like China, India, and South Korea are seeing substantial investments from both governments and organizations in digital transformation to enhance efficiency, competitiveness, and customer engagement.
Example Players in Managed Services Market
Applied Material
AU Optronics
BOE Technology
Corning Incorporated
Accenture
Amazon
AT&T
Atos
Broadcom
Capgemini
Cisco
Digital Reality
Dimension Data
DXC
DXC
Fujitsu
GTT
HCL
IBM
Infosys
Microsoft
NITT DATA
Rackspace
ScalPad Software
Tata Communication Services
Telefonaktiebolaget
Managed Services Market: Research Coverage
The report on the managed services market features insights on various sections, including:
Market Sizing and Opportunity Analysis: An in-depth analysis of the managed services market, focusing on key market segments, including [A] type of service, [B] type of deployment, [C] type of enterprise, [D] type of vertical, and [E] geographical regions.
Competitive Landscape: A comprehensive analysis of the companies engaged in the managed services market, based on several relevant parameters, such as [A] year of establishment, [B] company size, [C] location of headquarters and [D] ownership structure.
Company Profiles: Elaborate profiles of prominent players engaged in the managed services market, providing details on [A] location of headquarters, [B] company size, [C] company mission, [D] company footprint, [E] management team, [F] contact details, [G] financial information, [H] operating business segments, [I] managed services portfolio, [J] moat analysis, [K] recent developments, and an informed future outlook.
Megatrends: An evaluation of ongoing megatrends in the managed services industry.
Patent Analysis: An insightful analysis of patents filed / granted in the managed services domain, based on relevant parameters, including [A] type of patent, [B] patent publication year, [C] patent age and [D] leading players.
Recent Developments: An overview of the recent developments made in the managed services market, along with analysis based on relevant parameters, including [A] year of initiative, [B] type of initiative, [C] geographical distribution and [D] most active players.
Porter's Five Forces Analysis: An analysis of five competitive forces prevailing in the managed services market, including threats of new entrants, bargaining power of buyers, bargaining power of suppliers, threats of substitute products and rivalry among existing competitors.
SWOT Analysis: An insightful SWOT framework, highlighting the strengths, weaknesses, opportunities and threats in the domain. Additionally, it provides Harvey ball analysis, highlighting the relative impact of each SWOT parameter.
Value Chain Analysis: A comprehensive analysis of the value chain, providing information on the different phases and stakeholders involved in the managed services market.
Key Questions Answered in this Report
How many companies are currently engaged in managed services market?
Which are the leading companies in this market?
What factors are likely to influence the evolution of this market?
What is the current and future market size?
What is the CAGR of this market?
How is the current and future market opportunity likely to be distributed across key market segments?
Reasons to Buy this Report
The report provides a comprehensive market analysis, offering detailed revenue projections of the overall market and its specific sub-segments. This information is valuable to both established market leaders and emerging entrants.
Stakeholders can leverage the report to gain a deeper understanding of the competitive dynamics within the market. By analyzing the competitive landscape, businesses can make informed decisions to optimize their market positioning and develop effective go-to-market strategies.
The report offers stakeholders a comprehensive overview of the market, including key drivers, barriers, opportunities, and challenges. This information empowers stakeholders to stay abreast of market trends and make data-driven decisions to capitalize on growth prospects.
Additional Benefits
Complimentary Excel Data Packs for all Analytical Modules in the Report
15% Free Content Customization
Detailed Report Walkthrough Session with Research Team
Free Updated report if the report is 6-12 months old or older
TABLE OF CONTENTS
SECTION I: REPORT OVERVIEW
1. PREFACE
1.1. Introduction
1.2. Market Share Insights
1.3. Key Market Insights
1.4. Report Coverage
1.5. Key Questions Answered
1.6. Chapter Outlines
2. RESEARCH METHODOLOGY
2.1. Chapter Overview
2.2. Research Assumptions
2.3. Database Building
2.3.1. Data Collection
2.3.2. Data Validation
2.3.3. Data Analysis
2.4. Project Methodology
2.4.1. Secondary Research
2.4.1.1. Annual Reports
2.4.1.2. Academic Research Papers
2.4.1.3. Company Websites
2.4.1.4. Investor Presentations
2.4.1.5. Regulatory Filings
2.4.1.6. White Papers
2.4.1.7. Industry Publications
2.4.1.8. Conferences and Seminars
2.4.1.9. Government Portals
2.4.1.10. Media and Press Releases
2.4.1.11. Newsletters
2.4.1.12. Industry Databases
2.4.1.13. Roots Proprietary Databases
2.4.1.14. Paid Databases and Sources
2.4.1.15. Social Media Portals
2.4.1.16. Other Secondary Sources
2.4.2. Primary Research
2.4.2.1. Introduction
2.4.2.2. Types
2.4.2.2.1. Qualitative
2.4.2.2.2. Quantitative
2.4.2.3. Advantages
2.4.2.4. Techniques
2.4.2.4.1. Interviews
2.4.2.4.2. Surveys
2.4.2.4.3. Focus Groups
2.4.2.4.4. Observational Research
2.4.2.4.5. Social Media Interactions
2.4.2.5. Stakeholders
2.4.2.5.1. Company Executives (CXOs)
2.4.2.5.2. Board of Directors
2.4.2.5.3. Company Presidents and Vice Presidents
2.4.2.5.4. Key Opinion Leaders
2.4.2.5.5. Research and Development Heads
2.4.2.5.6. Technical Experts
2.4.2.5.7. Subject Matter Experts
2.4.2.5.8. Scientists
2.4.2.5.9. Doctors and Other Healthcare Providers
2.4.2.6. Ethics and Integrity
2.4.2.6.1. Research Ethics
2.4.2.6.2. Data Integrity
2.4.3. Analytical Tools and Databases
3. MARKET DYNAMICS
3.1. Forecast Methodology
3.1.1. Top-Down Approach
3.1.2. Bottom-Up Approach
3.1.3. Hybrid Approach
3.2. Market Assessment Framework
3.2.1. Total Addressable Market (TAM)
3.2.2. Serviceable Addressable Market (SAM)
3.2.3. Serviceable Obtainable Market (SOM)
3.2.4. Currently Acquired Market (CAM)
3.3. Forecasting Tools and Techniques
3.3.1. Qualitative Forecasting
3.3.2. Correlation
3.3.3. Regression
3.3.4. Time Series Analysis
3.3.5. Extrapolation
3.3.6. Convergence
3.3.7. Forecast Error Analysis
3.3.8. Data Visualization
3.3.9. Scenario Planning
3.3.10. Sensitivity Analysis
3.4. Key Considerations
3.4.1. Demographics
3.4.2. Market Access
3.4.3. Reimbursement Scenarios
3.4.4. Industry Consolidation
3.5. Robust Quality Control
3.6. Key Market Segmentations
3.7. Limitations
4. MACRO-ECONOMIC INDICATORS
4.1. Chapter Overview
4.2. Market Dynamics
4.2.1. Time Period
4.2.1.1. Historical Trends
4.2.1.2. Current and Forecasted Estimates
4.2.2. Currency Coverage
4.2.2.1. Overview of Major Currencies Affecting the Market
4.2.2.2. Impact of Currency Fluctuations on the Industry
4.2.3. Foreign Exchange Impact
4.2.3.1. Evaluation of Foreign Exchange Rates and Their Impact on Market
4.2.3.2. Strategies for Mitigating Foreign Exchange Risk
4.2.4. Recession
4.2.4.1. Historical Analysis of Past Recessions and Lessons Learnt
4.2.4.2. Assessment of Current Economic Conditions and Potential Impact on the Market
4.2.5. Inflation
4.2.5.1. Measurement and Analysis of Inflationary Pressures in the Economy
4.2.5.2. Potential Impact of Inflation on the Market Evolution
4.2.6. Interest Rates
4.2.6.1. Overview of Interest Rates and Their Impact on the Market
4.2.6.2. Strategies for Managing Interest Rate Risk
4.2.7. Commodity Flow Analysis
4.2.7.1. Type of Commodity
4.2.7.2. Origins and Destinations
4.2.7.3. Values and Weights
4.2.7.4. Modes of Transportation
4.2.8. Global Trade Dynamics
4.2.8.1. Import Scenario
4.2.8.2. Export Scenario
4.2.9. War Impact Analysis
4.2.9.1. Russian-Ukraine War
4.2.9.2. Israel-Hamas War
4.2.10. COVID Impact / Related Factors
4.2.10.1. Global Economic Impact
4.2.10.2. Industry-specific Impact
4.2.10.3. Government Response and Stimulus Measures
4.2.10.4. Future Outlook and Adaptation Strategies
4.2.11. Other Indicators
4.2.11.1. Fiscal Policy
4.2.11.2. Consumer Spending
4.2.11.3. Gross Domestic Product (GDP)
4.2.11.4. Employment
4.2.11.5. Taxes
4.2.11.6. R&D Innovation
4.2.11.7. Stock Market Performance
4.2.11.8. Supply Chain
4.2.11.9. Cross-Border Dynamics
SECTION II: QUALITATIVE INSIGHTS
5. EXECUTIVE SUMMARY
6. INTRODUCTION
6.1. Chapter Overview
6.2. Overview of Managed Service Market
6.2.1. Type of Service
6.2.2. Type of Deployment
6.2.3. Type of Enterprise Size
6.2.4. Type of Vertical
6.3. Future Perspective
7. REGULATORY SCENARIO
SECTION III: MARKET OVERVIEW
8. COMPREHENSIVE DATABASE OF LEADING PLAYERS
9. COMPETITIVE LANDSCAPE
9.1. Chapter Overview
9.2. Managed Service: Overall Market Landscape
9.2.1. Analysis by Year of Establishment
9.2.2. Analysis by Company Size
9.2.3. Analysis by Location of Headquarters
9.2.4. Analysis by Ownership Structure
10. WHITE SPACE ANALYSIS
11. COMPANY COMPETITIVENESS ANALYSIS
12. STARTUP ECOSYSTEM IN THE MANAGED SERVICE MARKET
12.1. Managed Services: Market Landscape of Startups
12.1.1. Analysis by Year of Establishment
12.1.2. Analysis by Company Size
12.1.3. Analysis by Company Size and Year of Establishment
12.1.4. Analysis by Location of Headquarters
12.1.5. Analysis by Company Size and Location of Headquarters
12.1.6. Analysis by Ownership Structure
12.2. Key Findings
SECTION IV: COMPANY PROFILES
13. COMPANY PROFILES
13.1. Chapter Overview
13.2. Accenture*
13.2.1. Company Overview
13.2.2. Company Mission
13.2.3. Company Footprint
13.2.4. Management Team
13.2.5. Contact Details
13.2.6. Financial Performance
13.2.7. Operating Business Segments
13.2.8. Service / Product Portfolio (project specific)
13.2.9. MOAT Analysis
13.2.10. Recent Developments and Future Outlook
13.3. Amazon
13.4. AT&T
13.5. Atos
13.6. Braodcom
13.7. Capgemini
13.8. Cisco
13.9. Digital Reality
13.10. Dimension Data
13.11. DXC
13.12. Fujitsu
13.13. GTT
13.14. HCL
13.15. IBM
13.16. Infosys
13.17. Microsoft
13.18. NTT DATA
13.19. Rackspace
13.20. ScalePad Software
13.21. Tata Communication Services
13.22. Telefonaktiebolaget
SECTION V: MARKET TRENDS
14. MEGA TRENDS ANALYSIS
15. UNMEET NEED ANALYSIS
16. PATENT ANALYSIS
17. RECENT DEVELOPMENTS
17.1. Chapter Overview
17.2. Recent Funding
17.3. Recent Partnerships
17.4. Other Recent Initiatives
SECTION VI: MARKET OPPORTUNITY ANALYSIS
18. GLOBAL MANAGED SERVICE MARKET
18.1. Chapter Overview
18.2. Key Assumptions and Methodology
18.3. Trends Disruption Impacting Market
18.4. Demand Side Trends
18.5. Supply Side Trends
18.6. Global Managed Service Market, Historical Trends (Since 2019) and Forecasted Estimates (Till 2035)
18.7. Multivariate Scenario Analysis
18.7.1. Conservative Scenario
18.7.2. Optimistic Scenario
18.8. Investment Feasibility Index
18.9. Key Market Segmentations
19. MARKET OPPORTUNITIES BASED ON TYPE OF SERVICE
19.1. Chapter Overview
19.2. Key Assumptions and Methodology
19.3. Revenue Shift Analysis
19.4. Market Movement Analysis
19.5. Penetration-Growth (P-G) Matrix
19.6. Managed Service Market for Managed Backup and Disaster Recovery: Historical Trends (Since 2019) and Forecasted Estimates (Till 2035)
19.7. Managed Service Market for Managed Communication Service: Historical Trends (Since 2019) and Forecasted Estimates (Till 2035)
19.8. Managed Service Market for Managed IT Infrastructure Service: Historical Trends (Since 2019) and Forecasted Estimates (Till 2035)
19.9. Managed Service Market for Managed Mobility Services: Historical Trends (Since 2019) and Forecasted Estimates (Till 2035)
19.10. Managed Service Market for Managed Network Services: Historical Trends (Since 2019) and Forecasted Estimates (Till 2035)
19.11. Managed Service Market for Managed Security Service: Historical Trends (Since 2019) and Forecasted Estimates (Till 2035)
19.12. Data Triangulation and Validation
19.12.1. Secondary Sources
19.12.2. Primary Sources
19.12.3. Statistical Modeling
20. MARKET OPPORTUNITIES BASED ON TYPE OF DEPLOYMENT
20.1. Chapter Overview
20.2. Key Assumptions and Methodology
20.3. Revenue Shift Analysis
20.4. Market Movement Analysis
20.5. Penetration-Growth (P-G) Matrix
20.6. Managed Service Market for Cloud-Based: Historical Trends (Since 2019) and Forecasted Estimates (Till 2035)
20.7. Managed Service Market for On-Premises: Historical Trends (Since 2019) and Forecasted Estimates (Till 2035)
20.8. Data Triangulation and Validation
20.8.1. Secondary Sources
20.8.2. Primary Sources
20.8.3. Statistical Modeling
21. MARKET OPPORTUNITIES BASED ON TYPE OF ENTERPRISE
21.1. Chapter Overview
21.2. Key Assumptions and Methodology
21.3. Revenue Shift Analysis
21.4. Market Movement Analysis
21.5. Penetration-Growth (P-G) Matrix
21.6. Managed Service Market for Large Enterprises: Historical Trends (Since 2019) and Forecasted Estimates (Till 2035)
21.7. Managed Service Market for Small and Medium-Sized Enterprises: Historical Trends (Since 2019) and Forecasted Estimates (Till 2035)
21.8. Data Triangulation and Validation
21.8.1. Secondary Sources
21.8.2. Primary Sources
21.8.3. Statistical Modeling
22. MARKET OPPORTUNITIES BASED ON TYPE OF VERTICAL
22.1. Chapter Overview
22.2. Key Assumptions and Methodology
22.3. Revenue Shift Analysis
22.4. Market Movement Analysis
22.5. Penetration-Growth (P-G) Matrix
22.6. Managed Service Market for BFSI: Historical Trends (Since 2019) and Forecasted Estimates (Till 2035)
22.7. Managed Service Market for Energy & Utility: Historical Trends (Since 2019) and Forecasted Estimates (Till 2035)
22.8. Managed Service Market for Government: Historical Trends (Since 2019) and Forecasted Estimates (Till 2035)
22.9. Managed Service Market for Healthcare: Historical Trends (Since 2019) and Forecasted Estimates (Till 2035)
22.10. Managed Service Market for IT & Telecommunication: Historical Trends (Since 2019) and Forecasted Estimates (Till 2035)
22.11. Managed Service Market for Manufacturing: Historical Trends (Since 2019) and Forecasted Estimates (Till 2035)
22.12. Managed Service Market for Retail & E-commerce: Historical Trends (Since 2019) and Forecasted Estimates (Till 2035)
22.13. Managed Service Market for Others: Historical Trends (Since 2019) and Forecasted Estimates (Till 2035)
22.14. Data Triangulation and Validation
22.14.1. Secondary Sources
22.14.2. Primary Sources
22.14.3. Statistical Modeling
23. MARKET OPPORTUNITIES FOR MANAGED SERVICES IN NORTH AMERICA
23.1. Chapter Overview
23.2. Key Assumptions and Methodology
23.3. Revenue Shift Analysis
23.4. Market Movement Analysis
23.5. Penetration-Growth (P-G) Matrix
23.6. Managed Service Market in North America: Historical Trends (Since 2019) and Forecasted Estimates (Till 2035)
23.6.1. Managed Service Market in the US: Historical Trends (Since 2019) and Forecasted Estimates (Till 2035)
23.6.2. Managed Service Market in Canada: Historical Trends (Since 2019) and Forecasted Estimates (Till 2035)
23.6.3. Managed Service Market in Mexico: Historical Trends (Since 2019) and Forecasted Estimates (Till 2035)
23.6.4. Managed Service Market in Other North American Countries: Historical Trends (Since 2019) and Forecasted Estimates (Till 2035)
23.7. Data Triangulation and Validation
24. MARKET OPPORTUNITIES FOR MANAGED SERVICES IN EUROPE
24.1. Chapter Overview
24.2. Key Assumptions and Methodology
24.3. Revenue Shift Analysis
24.4. Market Movement Analysis
24.5. Penetration-Growth (P-G) Matrix
24.6. Managed Service Market in Europe: Historical Trends (Since 2019) and Forecasted Estimates (Till 2035)
24.6.1. Managed Service Market in Austria: Historical Trends (Since 2019) and Forecasted Estimates (Till 2035)
24.6.2. Managed Service Market in Belgium: Historical Trends (Since 2019) and Forecasted Estimates (Till 2035)
24.6.3. Managed Service Market in Denmark: Historical Trends (Since 2019) and Forecasted Estimates (Till 2035)
24.6.4. Managed Service Market in France: Historical Trends (Since 2019) and Forecasted Estimates (Till 2035)
24.6.5. Managed Service Market in Germany: Historical Trends (Since 2019) and Forecasted Estimates (Till 2035)
24.6.6. Managed Service Market in Ireland: Historical Trends (Since 2019) and Forecasted Estimates (Till 2035)
24.6.7. Managed Service Market in Italy: Historical Trends (Since 2019) and Forecasted Estimates (Till 2035)
24.6.8. Managed Service Market in Netherlands: Historical Trends (Since 2019) and Forecasted Estimates (Till 2035)
24.6.9. Managed Service Market in Norway: Historical Trends (Since 2019) and Forecasted Estimates (Till 2035)
24.6.10. Managed Service Market in Russia: Historical Trends (Since 2019) and Forecasted Estimates (Till 2035)
24.6.11. Managed Service Market in Spain: Historical Trends (Since 2019) and Forecasted Estimates (Till 2035)
24.6.12. Managed Service Market in Sweden: Historical Trends (Since 2019) and Forecasted Estimates (Till 2035)
24.6.13. Managed Service Market in Switzerland: Historical Trends (Since 2019) and Forecasted Estimates (Till 2035)
24.6.14. Managed Service Market in the UK: Historical Trends (Since 2019) and Forecasted Estimates (Till 2035)
24.6.15. Managed Service Market in Other European Countries: Historical Trends (Since 2019) and Forecasted Estimates (Till 2035)
24.7. Data Triangulation and Validation
25. MARKET OPPORTUNITIES FOR MANAGED SERVICES IN ASIA
25.1. Chapter Overview
25.2. Key Assumptions and Methodology
25.3. Revenue Shift Analysis
25.4. Market Movement Analysis
25.5. Penetration-Growth (P-G) Matrix
25.6. Managed Service Market in Asia: Historical Trends (Since 2019) and Forecasted Estimates (Till 2035)
25.6.1. Managed Service Market in China: Historical Trends (Since 2019) and Forecasted Estimates (Till 2035)
25.6.2. Managed Service Market in India: Historical Trends (Since 2019) and Forecasted Estimates (Till 2035)
25.6.3. Managed Service Market in Japan: Historical Trends (Since 2019) and Forecasted Estimates (Till 2035)
25.6.4. Managed Service Market in Singapore: Historical Trends (Since 2019) and Forecasted Estimates (Till 2035)
25.6.5. Managed Service Market in South Korea: Historical Trends (Since 2019) and Forecasted Estimates (Till 2035)
25.6.6. Managed Service Market in Other Asian Countries: Historical Trends (Since 2019) and Forecasted Estimates (Till 2035)
25.7. Data Triangulation and Validation
26. MARKET OPPORTUNITIES FOR MANAGED SERVICES IN MIDDLE EAST AND NORTH AFRICA (MENA)
26.1. Chapter Overview
26.2. Key Assumptions and Methodology
26.3. Revenue Shift Analysis
26.4. Market Movement Analysis
26.5. Penetration-Growth (P-G) Matrix
26.6. Managed Service Market in Middle East and North Africa (MENA): Historical Trends (Since 2019) and Forecasted Estimates (Till 2035)
26.6.1. Managed Service Market in Egypt: Historical Trends (Since 2019) and Forecasted Estimates (Till 205)
26.6.2. Managed Service Market in Iran: Historical Trends (Since 2019) and Forecasted Estimates (Till 2035)
26.6.3. Managed Service Market in Iraq: Historical Trends (Since 2019) and Forecasted Estimates (Till 2035)
26.6.4. Managed Service Market in Israel: Historical Trends (Since 2019) and Forecasted Estimates (Till 2035)
26.6.5. Managed Service Market in Kuwait: Historical Trends (Since 2019) and Forecasted Estimates (Till 2035)
26.6.6. Managed Service Market in Saudi Arabia: Historical Trends (Since 2019) and Forecasted Estimates (Till 2035)
26.6.7. Managed Service Market in United Arab Emirates (UAE): Historical Trends (Since 2019) and Forecasted Estimates (Till 2035)
26.6.8. Managed Service Market in Other MENA Countries: Historical Trends (Since 2019) and Forecasted Estimates (Till 2035)
26.7. Data Triangulation and Validation
27. MARKET OPPORTUNITIES FOR MANAGED SERVICES IN LATIN AMERICA
27.1. Chapter Overview
27.2. Key Assumptions and Methodology
27.3. Revenue Shift Analysis
27.4. Market Movement Analysis
27.5. Penetration-Growth (P-G) Matrix
27.6. Managed Service Market in Latin America: Historical Trends (Since 2019) and Forecasted Estimates (Till 2035)
27.6.1. Managed Service Market in Argentina: Historical Trends (Since 2019) and Forecasted Estimates (Till 2035)
27.6.2. Managed Service Market in Brazil: Historical Trends (Since 2019) and Forecasted Estimates (Till 2035)
27.6.3. Managed Service Market in Chile: Historical Trends (Since 2019) and Forecasted Estimates (Till 2035)
27.6.4. Managed Service Market in Colombia Historical Trends (Since 2019) and Forecasted Estimates (Till 2035)
27.6.5. Managed Service Market in Venezuela: Historical Trends (Since 2019) and Forecasted Estimates (Till 2035)
27.6.6. Managed Service Market in Other Latin American Countries: Historical Trends (Since 2019) and Forecasted Estimates (Till 2035)
27.7. Data Triangulation and Validation
28 MARKET OPPORTUNITIES FOR MANAGED SERVICES IN REST OF THE WORLD
28.1. Chapter Overview
28.2. Key Assumptions and Methodology
28.3. Revenue Shift Analysis
28.4. Market Movement Analysis
28.5. Penetration-Growth (P-G) Matrix
28.6. Managed Service Market in Rest of the World: Historical Trends (Since 2019) and Forecasted Estimates (Till 2035)
28.6.1. Managed Service Market in Australia: Historical Trends (Since 2019) and Forecasted Estimates (Till 2035)
28.6.2. Managed Service Market in New Zealand: Historical Trends (Since 2019) and Forecasted Estimates (Till 2035)
28.6.3. Managed Service Market in Other Countries
28.7. Data Triangulation and Validation
29. MARKET CONCENTRATION ANALYSIS: DISTRIBUTION BY LEADING PLAYERS