통신사업자 시장 트래커(2025년 2분기) : 통신사업자 수익은 4.6% 증가했으나, 설비 투자 억제는 수익성 중시 기조를 보여준다
Global Telco Market Tracker, 2Q25: Capex Pullback Persists even as Revenues Surge 4.6% - Telco Revenues Surge 4.6% in 2Q25, Capex Restraint Signals Focus on Profitability
상품코드:1856787
리서치사:MTN Consulting, LLC
발행일:2025년 10월
페이지 정보:영문
라이선스 & 가격 (부가세 별도)
한글목차
본 보고서는 세계 통신 네트워크 사업자 산업에 대한 상세한 분석으로, 2011년 1분기부터 2025년 2분기까지 140개 통신 사업자의 실적 데이터를 수록하고 있습니다. 특히 최근 분기인 2025년 2분기 동향을 중심으로 매출, 인건비, 설비투자, OPEX, 수익성 등 주요 지표를 수록하였습니다.
비주얼
주요 조사 결과
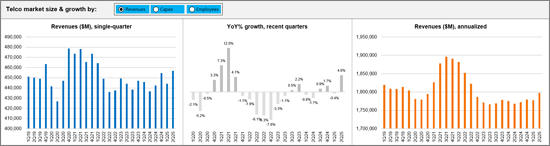
2025년 2분기 세계 통신사 매출은 전년 동기 대비 4.6% 증가한 4,568억 달러에 달했습니다. 주요 시장의 폭넓은 회복세를 배경으로 하고 있습니다. 연간 환산 기준으로는 전년 대비 1.7% 증가한 1조 8,000억 달러의 매출을 기록했습니다.
2025년 2분기 설비투자(CAPEX)는 전년 동기 대비 2.1% 감소한 675억 달러를 기록했습니다. 연간 환산 기준으로는 2.6% 감소한 2,929억 달러로 2011년 이후 가장 낮은 12개월 총액이며, 자본집약도 역시 2013년 이후 가장 낮은 수준을 기록했습니다. 통신사들의 기술투자는 설비투자에서 운영비(OPEX)로 계상되는 경우가 많은 소프트웨어 및 서비스 분야로 점진적으로 전환되고 있지만, 전반적으로 통신사들은 여전히 엄격한 비용 관리를 지속하고 있습니다.
2025년 2분기 인건비는 전년 동기 대비 1.3% 감소한 2,581억 달러를 기록했으며, 업계 전체 직원 수는 436만 명으로 감소했습니다. 2025년 2분기 OPEX(D&A 제외) 대비 인건비 비중은 21.7%로 2024년 2분기 22.2% 대비 소폭 하락했습니다.
최근 연간 환산 기준 수익성 지표는 전년 대비 소폭 개선되어 EBITDA 마진은 33.8%를 기록했습니다. 이는 지속적인 비용 압박 속에서도 사업 운영의 효율성이 안정적으로 유지되고 있음을 보여줍니다. 또한, EBIT 마진도 소폭 상승하여 2024년 2분기 14.9%에서 2025년 6월(최근 12개월)에는 15.5%로 증가하였습니다.
지역별로는 25년 2분기 아시아가 전 세계 통신사업 매출의 36.8%를 차지하며 36.3%를 기록한 아메리카를 소폭 상회하며 선두를 유지했습니다. 한편, 설비투자 측면에서는 AT&T와 Verizon의 네트워크 투자 확대로 인해 아메리카 지역이 다른 모든 지역을 앞질렀으며, AT&T와 Verizon의 네트워크 투자 확대가 그 지출을 증가시켰습니다.
통신사업자
A1 Telekom Austria
BCE
Cequel Communications
Cogeco
Dish TV India Limited
Globe Telecom
LG Uplus
MTN Group
Proximus
Singtel
SureWest Communications
Telecom Italia
Time Warner
Vodafone
Masmovil Masorange
Advanced Info Service(AIS)
Bezeq Israel
Charter Communications
Com Hem Holding AB
DNA Ltd.
Grupo Clarin
Liberty Global
MTNL
Quebecor Telecommunications
SITI Networks Limited
Swisscom
Telefonica
Time Warner Cable
Vodafone Idea Limited
Airtel
Bouygues Telecom
China Broadcasting Network
Comcast
Du
Grupo Televisa
M1
NTT
Rakuten
SK Telecom
Taiwan Mobile
Telekom Malaysia Berhad
TPG Telecom Limited
VodafoneZiggo
Altice Europe
BSNL
China Mobile
Consolidated Communications
EE
Hathway Cable & Datacom Limited
Manitoba Telecom Services
Oi
Reliance Communications Limited
Sky plc
Tata Communications
Telenor
True Corp
Wind Tre
Altice USA
BT
China Telecom
Cyfrowy Polsat
Elisa
Idea Cellular Limited
Maroc Telecom
Omantel
Reliance Jio
SmarTone
Tata Teleservices
Telia
Turk Telekom
Windstream
America Movil
Cable ONE, Inc.
China Unicom
DEN Networks Limited
Entel
Iliad SA
Maxis Berhad
Ono
Rogers
SoftBank
TDC
Telkom Indonesia
Turkcell
Zain
AT&T
Cablevision
Chunghwa Telecom
Deutsche Telekom
Etisalat
KDDI
Megafon
Ooredoo
Rostelecom
Spark New Zealand Limited
TDS
Telkom SA
Veon
Zain KSA
Axiata
Cell C
Cincinatti Bell
Digi Communications
Fairpoint Communications
KPN
MetroPCS Communications
Orange
Safaricom Limited
Sprint
Tele2 AB
Telstra
Verizon
Ziggo
Axtel
Cellcom Israel
CK Hutchison
DirecTV
Far EasTone Telecommunications Co., Ltd.
KT
Millicom
PCCW
Sasktel
StarHub
Telecom Argentina
Telus
Virgin Media
Batelco
CenturyLink
Clearwire
Dish Network
Frontier Communications
Leap Wireless
Mobile Telesystems
PLDT
Shaw
STC(Saudi Telecom)
Telecom Egypt
Thaicom
Vivendi
지역 커버
아시아
아메리카
유럽
중동 및 아프리카
목차
제1장 보고서 하이라이트
제2장 요약
제3장 시장 개요
제4장 분석
제5장 주요 통계 : -2025년 2분기
제6장 노동 통계
제7장 오퍼레이터 순위
제8장 기업 상세 분석
제9장 기업 벤치마킹
제10장 국가별 상세 분석
제11장 기업·국가별 상세 분석
제12장 지역별 상세 분석
제13장 원시 데이터
제14장 가입자·트래픽
제15장 환율
제16장 조사 방법과 조사 범위
제17장 당사에 대해
KSM
영문 목차
영문목차
This report delivers a detailed analysis of the global telecommunications network operator (telco) industry, drilling down into performance for 140 telcos from 1Q11 through 2Q25. It captures revenue, labor, capex, opex, and profitability data with a focus on the most recent quarter (2Q25).
VISUALS
Key findings:
Global telco revenues climbed 4.6% year-over-year (YoY) in 2Q25 to reach $456.8 billion (B), supported by broad-based recovery across major markets. On an annualized 2Q25 basis, revenues grew 1.7% YoY to $1.8 trillion (T). Airtel (20.0%), Etisalat (18.7%), SoftBank (7.3%), Deutsche Telekom (4.6%), and China Unicom (3.7%) led growth in the annualized 2Q25 period, while Vodafone (-11.6%) and Orange (-7.1%) declined sharply.
Capex declined 2.1% YoY in 2Q25 to $67.5B, while the annualized total fell 2.6% to $292.9B. That's the lowest 12-month total since 2011, and the lowest capital intensity since 2013. China Mobile remained the largest investor with $24.4B in annualized capex (+7.8% YoY) in 2Q25, while America Movil (-24.5%), China Telecom (-22.9%), and China Unicom (-17.7%) made significant cutbacks. Telco tech spending continues to shift modestly towards software and services, which may be recorded as opex rather than capex, but telcos remain vigilant cost cutters across the board.
Labor costs fell 1.3% YoY to $258.1B in the annualized 2Q25 period, with telco headcount shrinking to 4.36 million. Labor represented 21.7% of opex (excluding D&A) for the annualized 2Q25 period, down a bit from 22.2% in 2Q24.
Profitability margin inched higher in the latest annualized period from a year ago, with EBITDA at 33.8%, suggesting stable operational efficiency despite cost pressures. EBIT margin also edged up a bit, from 14.9% in 2Q24 to 15.5% for the 12 months ended June 2025.
Regionally, Asia maintained its lead with 36.8% of global telco revenues in 2Q25, slightly ahead of the Americas (36.3%). On the capex spending front, the Americas outspent all other regions, boosted by network spending from AT&T and Verizon.