인도의 농업용 생물제제 시장 : 시장 점유율 분석, 산업 동향 및 통계, 성장 예측(2025-2030년)
India Agricultural Biologicals - Market Share Analysis, Industry Trends & Statistics, Growth Forecasts (2025 - 2030)
상품코드:1693762
리서치사:Mordor Intelligence
발행일:2025년 03월
페이지 정보:영문
라이선스 & 가격 (부가세 별도)
ㅁ Add-on 가능: 고객의 요청에 따라 일정한 범위 내에서 Customization이 가능합니다. 자세한 사항은 문의해 주시기 바랍니다.
ㅁ 보고서에 따라 최신 정보로 업데이트하여 보내드립니다. 배송기일은 문의해 주시기 바랍니다.
한글목차
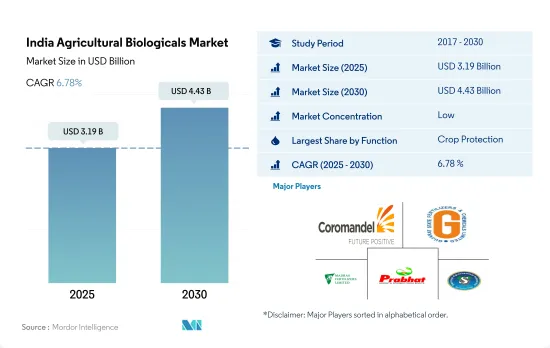
인도의 농업용 생물제제 시장 규모는 2025년에 31억 9,000만 달러로 추정되고, 2030년에는 44억 3,000만 달러에 이를 전망이며, 예측 기간인 2025-2030년 CAGR 6.78%를 보일 것으로 예측됩니다.
화학비료와 농약의 과잉사용은 국내에서의 심각한 과제 중 하나입니다. 고정된 장소에서의 질소의 지속적인 사용은 토양 건강과 작물 수확량에 악영향을 미치고, 몇몇 매크로와 미량 영양소의 결핍을 보여줍니다. NPK를 권장량 이상 사용해도 미량과 2차 영양소의 결핍이 수확량을 제한하는 요인이 되고 있습니다.
지속가능한 농법과 유기농법을 채용하면 화학 비료의 환경에 미치는 영향을 줄일 수 있습니다. 인도 농업 연구 평의회(ICAR)는, 화학비료의 사용을 줄이고, 토양의 건전성 및 환경의 악화, 지하수의 오염을 막기 위해서, 무기와 유기 양쪽의 식물 영양원을 병용하는 종합 영양 관리를 권장하고 있습니다.
이러한 요인과 유기농업의 재배면적 증가가 인도의 농업용 생물제제 시장을 견인하고 있습니다. 작물 보호 부문이 시장을 독점하고 있습니다. 2022년 시장 규모는 약 18억 5,000만 달러였습니다. 같은 해 작물 영양 부문의 시장 규모는 7억 5,930만 달러였습니다.
이 나라에서는 연작작물 재배가 주류이며 2022년 인도의 농업용 생물제제 시장의 약 87.7%를 차지했습니다. 이 나라는 Parampragat Krishi Vikas Yojana(PKVY)와 Mission Organic Value Chain Development for North East Region(MOVCD-NER)에서 유기농 농업을 추진하고 있습니다. 국내와 국제 시장에서 유기 제품에 대한 수요도 2023-2029년 인도의 농업용 생물제제 시장을 견인할 것으로 예측됩니다.
인도의 농업용 생물제제 시장 동향
유기 생산자 증가는 주로 연작 작물에서 유기 재배 면적 증가를 뒷받침
인도는 인증된 유기 생산자의 총수로 세계 최대의 국가이며, 2019년에는 130만 명의 유기 생산자가 있습니다. 많은 유기농 생산자들이 있음에도 불구하고 이 나라의 유기 재배 면적은 이 나라의 농업 총 면적의 2.0% 정도입니다. 2021년에는 국내 유기재배면적은 70만 헥타르로 기록되어 2017년에 비해 약 3.4% 증가했습니다.
국내 유기농업 상위 10개 주가 유기농 작물 총 면적의 약 80.0%를 차지하고 있습니다. 유기농업 상위의 마디야 프라데시주, 라자스탄주, 마할라슈트라주 등 유기농업의 개선에 이니셔티브를 하고 있는 주가 몇 개 있으며, 2019년에는 매디야 프라데시주가 27.0%를 차지하고 있습니다.
국내에서는 연작 작물의 유기 재배가 우세했고, 2021년에는 유기 작물 총 면적의 약 59.7%를 차지했습니다. 곡물 생산은 쌀, 밀, 잡곡, 옥수수가 주류입니다. 대부분의 곡류 작물은 칼리프기(6월-9월)에 재배됩니다. 이 계절에 재배되는 작물은 주로 비에 달려 있거나 벼, 옥수수, 면화, 콩과 같은 많은 물이 필요합니다.
유기 환금작물 전체 재배면적은 2017년 27만 헥타르에서 2021년에는 28만헥타르로 증가했습니다. 이 나라에서 생산되는 주요 환금 작물은 면화, 사탕수수, 홍차, 향신료입니다. 이 나라에서는 현재 유기농 원예 작물의 성장은 제한되어 있습니다. 유기농 제품에 대한 수요 증가와 인도 정부의 유기농 노력으로 2023-2029년 유기농 작물의 재배 면적이 증가할 것으로 예상됩니다.
수요 증가와 전자상거래 채널 이용이 용이하여 유기농 식품에 대한 1인당 지출 증가
인도의 유기농 제품에 대한 1인당 지출은 0.23달러로, 아시아태평양의 유기농 제품에 대한 1인당 지출의 평균과 비교하면 비교적 낮습니다. 그러나 최근에는 유기농 제품이 면역력이 높고 품질이 높으며 전자상거래 채널을 통해 구하기 쉽다고 인식하는 고객이 늘어나면서 소비자 수요가 유기농 제품으로 전환되고 있습니다. 인도는 유기농 식품과 식음료의 유망한 시장입니다. 인도 내 유기농 식음료 산업은 2019-2024년 CAGR 13%로 상승했으며, 2024년까지 1억 3800만 달러 규모가 된 것으로 평가되고 있습니다.
2022년에 국내에서 소비된 유기식음료의 합계는 1억 800만 달러 상당이었습니다. 이 나라의 유기농 제품 소비액은 2016년 4,500만 달러에서 2021년에는 9,600만 달러로 증가했습니다. 유기농 식품의 판매 동향은 주로 소비자 의식의 고조로 인해 증가 추세에 있으며, 고소득 소비자들이 유기농 식음료의 소비를 촉진하고 있습니다. 가장 수요를 많이 얻은 카테고리에는 유기농 계란, 유제품, 과일 및 채소 등 필수 식품이 포함됩니다.
유기 음료 소비는 시장을 독점하고 2022년 유기 식품과 유기 음료의 총 시장 매출의 약 85.2%를 차지했습니다. 유기 음료 부문에는 승인된 인증 기관에 의해 인증된 유기 포장 식음료가 포함됩니다. 유기음료의 소비액은 2020-2022년 CAGR 14%로 증가했습니다. 유기 제품과 관련된 가격 프리미엄은 저소득층 소비자의 접근을 방해하여 유기농 식품 소비의 주요 제한 요인이 되었습니다. 그러나 유기 제품의 긍정적인 홍보와 이점은 예측 기간 동안 유기농 식품 시장을 견인합니다.
인도의 농업용 생물제제 산업 개요
인도의 농업용 생물제제 시장은 부문화되어 있으며 상위 5개 기업에서 20.64%를 차지하고 있습니다. 이 시장의 주요 기업은 Coromandel International Ltd, Gujarat State Fertilizers & Chemicals Limited, Madras Fertilizers Limited, Prabhat Fertilizer, Chemical Works, Swaroop Agrochemical Industries 등입니다.
기타 혜택
엑셀 형식 시장 예측(ME) 시트
3개월의 애널리스트 서포트
목차
제1장 주요 요약 및 주요 조사 결과
제2장 보고서 제안
제3장 서문
조사의 전제조건 및 시장 정의
조사 범위
조사 방법
제4장 주요 산업 동향
유기 재배 면적
1인당 유기농 제품에 대한 지출
규제 프레임워크
인도
밸류체인 및 유통 채널 분석
제5장 시장 세분화
기능별
작물 영양
바이오 비료
아조스피리람
아조토박터
균근균
인산 가용화균
근립균
기타 바이오 비료
바이오 비료
아미노산
풀보산
부식산
단백질 가수분해물
해초 추출물
기타 바이오스티뮬란트
유기 비료
비료
밀베이스 비료
오일 케이크
기타 유기 비료
작물 보호
생물 방제제
매크로 미생물
미생물
바이오 농약
바이오 살균제
바이오 제초제
생물 살충제
기타 바이오 농약
작물 유형별
환금작물
원예작물
경작작물
제6장 경쟁 구도
주요 전략적 움직임
시장 점유율 분석
기업 상황
기업 프로파일
Coromandel International Ltd
Gujarat State Fertilizers & Chemicals Limited
Indian Farmers Fertiliser Cooperative Limited
Koppert Biological Systems Inc.
Madras Fertilizers Limited
Prabhat Fertilizer and Chemical Works
Rallis India Ltd
Samriddhi Crops India Pvt. Ltd
Swaroop Agrochemical Industries
Valagro
제7장 CEO에 대한 주요 전략적 질문
제8장 부록
세계 개요
개요
Porter's Five Forces 분석 프레임워크
세계의 밸류체인 분석
시장 역학(DROs)
정보원 및 참고문헌
도표 일람
주요 인사이트
데이터 팩
용어집
AJY
영문 목차
영문목차
The India Agricultural Biologicals Market size is estimated at 3.19 billion USD in 2025, and is expected to reach 4.43 billion USD by 2030, growing at a CAGR of 6.78% during the forecast period (2025-2030).
The overuse of chemical fertilizers and pesticides is one of the serious challenges in the country. The continuous use of nitrogen at fixed sites had a negative impact on the health of the soil and crop yield, indicating deficiencies in several macro and micronutrients. Even with recommended doses of NPK and more, deficiency of micro and secondary nutrients has become a yield-limiting factor.
The adoption of sustainable agricultural practices or organic farming can decrease the effect of chemical fertilizers on the environment. The Indian Council of Agricultural Research (ICAR) recommends integrated nutrient management through conjunctive use of both inorganic and organic sources of plant nutrients to reduce the use of chemical fertilizers, preventing deterioration of soil health and environment and contamination of groundwater.
These factors and the growing organic agricultural cultivation area are driving the Indian agricultural biologicals market. The crop protection segment is dominating the market. It was valued at about USD 1.85 billion in 2022. The crop nutrition segment was valued at USD 759.3 million in the same year.
Row crop cultivation is dominant in the country, accounting for about 87.7% of the Indian agricultural biologicals market in 2022. The country is promoting organic farming under the Parampragat Krishi Vikas Yojana (PKVY) and the Mission Organic Value Chain Development for North East Region (MOVCD-NER). The demand for organic products in domestic and international markets is also expected to drive the Indian agricultural biologicals market between 2023 and 2029.
India Agricultural Biologicals Market Trends
Growing number of organic producers helping the increase in area under organic cultivation, primarily in row crops
India is the largest country, in terms of the total number of certified organic producers in the world, with 1.3 million organic producers in 2019. Despite having a large number of organic producers, organic cultivation areas in the country account for around 2.0% of the total agriculture area in the country. In 2021, the organic area in the country was recorded as 0.7 million hectares, which increased by about 3.4% compared to 2017.
The top ten organic farming states in the country account for about 80.0% of the total organic crop area. A few states have taken the lead in improving organic farming including Madhya Pradesh, Rajasthan, and Maharashtra, the top organic farming states, with Madhya Pradesh accounting for 27.0% in 2019.
Organic cultivation of row crops is dominant in the country, which accounted for about 59.7% of the total organic crop area in 2021. Cereal crop production is dominant rice, wheat, millet, and maize are the major cereals produced. Most cereal crops are grown in the kharif season (June - September). The crops grown in this season are mainly rain-dependent or require more water, like rice, maize, cotton, and soybean.
The overall organic cash crop cultivation area increased from 0.27 million hectares in 2017 to 0.28 million hectares in 2021. The major cash crops produced in the country are cotton, sugarcane, tea, and spices. There is a limited growth of organic horticultural crops currently in the country. The increasing demand for organic products and Indian government initiatives to go organic are anticipated to increase organic crop area between 2023 and 2029.
Growing demand and their easy accessibility through e-commerce channels, rising the per capita spending on organic food
India's per capita spending on organic products is relatively low at USD 0.23 compared to the average per capita spending on organic products in Asia-Pacific. However, in recent years, shifting consumer demand has increased toward organic products as more customers perceive these items offer better immunity, higher quality, and more accessibility through e-commerce channels. India is a promising and developing market for organic foods and beverages. India's domestic organic food and beverage industry is expected to be worth USD 138.0 million by 2024, rising at a compound annual growth rate of 13% between 2019 to 2024.
In 2022, the total combined organic food and beverages worth USD 108.0 million consumed in the country. The consumption value of organic products in the country increased from USD 45 million in 2016 to USD 96.0 million in 2021. Organic food sales have seen an increasing trend mainly due to increasing consumer awareness, and high-income consumers are propelling organic food and beverage consumption. Categories that gained the most demand included essential foods, such as organic eggs, dairy, and fruits and vegetables.
Organic beverage consumption dominated the market and accounted for about 85.2% of the total combined organic food and beverages market value in 2022. The organic beverages segment includes organic packaged food and beverages that are certified by the approved certification body. Organic beverage consumption value increased at a CAGR of 14% between 2020 to 2022. The price premium associated with organic products hampers lower-income consumer access and is the major limiting factor for organic food consumption. However, organic products' active promotion and advantages drive the organic food market during the forecast period.
India Agricultural Biologicals Industry Overview
The India Agricultural Biologicals Market is fragmented, with the top five companies occupying 20.64%. The major players in this market are Coromandel International Ltd, Gujarat State Fertilizers & Chemicals Limited, Madras Fertilizers Limited, Prabhat Fertilizer and Chemical Works and Swaroop Agrochemical Industries (sorted alphabetically).
Additional Benefits:
The market estimate (ME) sheet in Excel format
3 months of analyst support
TABLE OF CONTENTS
1 EXECUTIVE SUMMARY & KEY FINDINGS
2 REPORT OFFERS
3 INTRODUCTION
3.1 Study Assumptions & Market Definition
3.2 Scope of the Study
3.3 Research Methodology
4 KEY INDUSTRY TRENDS
4.1 Area Under Organic Cultivation
4.2 Per Capita Spending On Organic Products
4.3 Regulatory Framework
4.3.1 India
4.4 Value Chain & Distribution Channel Analysis
5 MARKET SEGMENTATION (includes market size in Value in USD and Volume, Forecasts up to 2030 and analysis of growth prospects)
5.1 Function
5.1.1 Crop Nutrition
5.1.1.1 Biofertilizer
5.1.1.1.1 Azospirillum
5.1.1.1.2 Azotobacter
5.1.1.1.3 Mycorrhiza
5.1.1.1.4 Phosphate Solubilizing Bacteria
5.1.1.1.5 Rhizobium
5.1.1.1.6 Other Biofertilizers
5.1.1.2 Biostimulants
5.1.1.2.1 Amino Acids
5.1.1.2.2 Fulvic Acid
5.1.1.2.3 Humic Acid
5.1.1.2.4 Protein Hydrolysates
5.1.1.2.5 Seaweed Extracts
5.1.1.2.6 Other Biostimulants
5.1.1.3 Organic Fertilizer
5.1.1.3.1 Manure
5.1.1.3.2 Meal Based Fertilizers
5.1.1.3.3 Oilcakes
5.1.1.3.4 Other Organic Fertilizers
5.1.2 Crop Protection
5.1.2.1 Biocontrol Agents
5.1.2.1.1 Macrobials
5.1.2.1.2 Microbials
5.1.2.2 Biopesticides
5.1.2.2.1 Biofungicides
5.1.2.2.2 Bioherbicides
5.1.2.2.3 Bioinsecticides
5.1.2.2.4 Other Biopesticides
5.2 Crop Type
5.2.1 Cash Crops
5.2.2 Horticultural Crops
5.2.3 Row Crops
6 COMPETITIVE LANDSCAPE
6.1 Key Strategic Moves
6.2 Market Share Analysis
6.3 Company Landscape
6.4 Company Profiles (includes Global Level Overview, Market Level Overview, Core Business Segments, Financials, Headcount, Key Information, Market Rank, Market Share, Products and Services, and Analysis of Recent Developments).
6.4.1 Coromandel International Ltd
6.4.2 Gujarat State Fertilizers & Chemicals Limited
6.4.3 Indian Farmers Fertiliser Cooperative Limited
6.4.4 Koppert Biological Systems Inc.
6.4.5 Madras Fertilizers Limited
6.4.6 Prabhat Fertilizer and Chemical Works
6.4.7 Rallis India Ltd
6.4.8 Samriddhi Crops India Pvt. Ltd
6.4.9 Swaroop Agrochemical Industries
6.4.10 Valagro
7 KEY STRATEGIC QUESTIONS FOR AGRICULTURAL BIOLOGICALS CEOS