ㅁ Add-on 가능: 고객의 요청에 따라 일정한 범위 내에서 Customization이 가능합니다. 자세한 사항은 문의해 주시기 바랍니다.
ㅁ 보고서에 따라 최신 정보로 업데이트하여 보내드립니다. 배송기일은 문의해 주시기 바랍니다.
한글목차
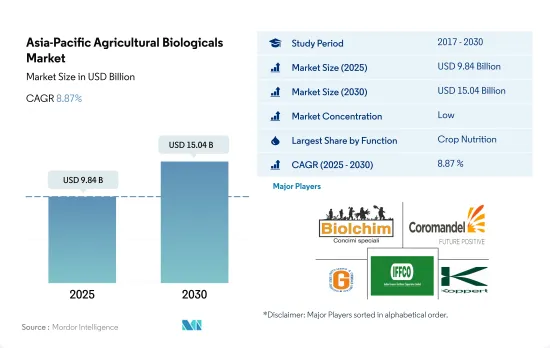
아시아태평양의 농업용 생물제제 시장 규모는 2025년에 98억 4,000만 달러에 이르고, 2030년에는 150억 4,000만 달러에 달할 것으로 예상되며, 예측 기간 중(2025-2030년) CAGR은 8.87%를 나타낼 전망입니다.
아시아태평양에서는 농업용 생물제제가 지속가능한 농업에서 중요한 역할을 하고 있습니다. 2017년부터 2022년까지 시장 가치는 연평균 2.2%씩 성장했습니다.
아시아태평양의 생물학적 솔루션에 대한 수요는 주로 일부 기존 농약 사용에 대한 규제를 강화하는 유럽 연합(EU)과 같은 수출 시장과보다 지속 가능한 방식으로 재배 된 식품에 대한 현지 소비자와 고객 수요에 의해 견인되고 있습니다.그 때문에 보다 많은 생산자가 대체 솔루션에 대한 관심을 높이고 있습니다.
농약 액션 네트워크의 5개 지역 센터 중 하나인 PAN 아시아태평양(PANAP)은 농약이 인간과 환경에 미치는 유해한 영향에 관한 의식 향상 캠페인을 전개하여 생물다양성에 의한 생태계 농업을 추진하고 있습니다.
중국, 인도, 호주, 인도네시아 등은 유기농업 전략을 채택하고 있습니다. 예를 들어 중국은 원예작물과 연작작물에 있어서의 농약 사용량을 각각 10%와 5% 삭감할 계획입니다.
아시아태평양은 세계 유수의 유기농업생산지입니다.
이 지역에서 유기농업을 운영하는 면적은 2017-2022년에 걸쳐 크게 증가했으며, 2017년 310만 헥타르에서 2022년에는 380만 헥타르로 증가하였습니다. 이 지역의 생물제제 시장은 과거 기간에 10.1% 증가했고, 예측 기간에는 약 65.1% 증가하고, 2029년에는 138억 1,000만 달러에 달할 것으로 예측됩니다.
국가별로는 중국이 2022년 아시아태평양 농업용 생물제제 시장의 50.5%, 78.6%를 차지했습니다.
2022년에는 아시아태평양의 연작작물이 보다 많은 생물학적 비료를 소비하여 시장총액의 80.1%를 차지했습니다.
유기농 작물 면적 증가 동향과 유기제품과 유기비료에 대한 수요 증가는 화학비료의 사용량을 전체적으로 감소시키고 있습니다.
아시아태평양의 농업용 생물제제 시장 동향
중국, 인도, 인도네시아, 호주 등 국가의 정부 지원 확대가 이 지역의 유기농업을 뒷받침
FiBL의 통계에 따르면 아시아태평양의 유기농지면적은 2021년에는 370만 헥타르를 넘어 세계의 유기농지면적의 26.4%를 차지했습니다. 중국, 인도, 인도네시아, 호주는 이 지역에서 유기 재배 면적이 큰 주요국입니다. Krishi Vikas Yojana나 All India Network Programme on Organic Farming(AI-NPOF) 등의 제도를 실시했습니다.
2021년에는 중국이 250만 헥타르로 66.1%의 최대 점유율을 차지했고, 이어 인도가 19.3%, 인도네시아가 1.5%, 호주가 1.4%였습니다. 연작 작물은 이 지역의 유기농지의 대부분을 차지하고 있으며, 2021년에는 250만 헥타르로 67.5%의 점유율을 차지했습니다.
환금작물의 점유율은 2위로, 2021년에는 70만 헥타르가 되어 유기농지의 18.5%를 차지했습니다. 설탕이나 유기차 등 유기환금작물에 대한 수요는 세계적으로 증가하고 있습니다. 세계적으로 중국과 인도는 각각 가장 큰 유기 녹차와 유기 홍차 생산국입니다. 국제 수요가 증가함에 따라 이 지역의 유기농 면적이 증가할 것으로 예측됩니다.
유기농 제품에 대한 1인당 지출은 호주가 압도적으로 많아 중국의 유기농 식품 시장이 크게 성장하고 있습니다.
인도의 유기 제품은 세계 수요의 1.0%로 멀지 않고 2021년 1인당 지출은 0.08달러에 불과했습니다. 그러나 유기농 식품 섭취의 장점에 대한 사람들의 의식이 높아지고, 차와 유기 주스 등의 카테고리에서 유기 제품에 대한 수요가 늘어나고 있기 때문에 인도는 향후 수년간 잠재적인 시장이 될 것입니다. 2025년에는 1억 5,330만 달러에 달할 것으로 예측됩니다. 현재이 지역의 유기농 제품 시장은 매우 단편적이며 일부 슈퍼마켓과 전문점에서만 판매됩니다.
중국은 지역평균과 세계평균을 뛰어넘는 유기성장을 계속하고 있으며, 2021년에는 13.3%의 확대를 기록했습니다. 플러스 성장 패턴은 앞으로도 계속될 것으로 예상되며 2023-2029년의 평균 CAGR은 7.1%를 나타낼 것으로 전망됩니다.
유기농 제품은 중국에서 강력한 성장을 이루며 2023-2029년 CAGR은 7.1%를 나타내며 2025년에는 총 64억 달러에 이를 것으로 예측됩니다. 경치에는 젊은 세대들 사이에서 유기농 제품의 중요성이 중시되고 있으며, 어머니의 근로자 수 증가로 인한 유기농 아기 식품 수요 증가, 건강과 웰빙 동향 향의 채용 증가 등이 있습니다. 소비자의 지식과 구매 의욕의 높아짐은 이 지역에 있어서의 유기 식품의 서스테이너블 특질에 대한 이해를 깊게 하는 것으로 예측됩니다.
아시아태평양의 농업용 생물제제 산업 개요
아시아태평양의 농업용 생물제제 시장은 세분화되어 있으며 상위 5개 기업에서 6.21%를 차지하고 있습니다.
기타 혜택
엑셀 형식 시장 예측(ME) 시트
3개월의 애널리스트 서포트
목차
제1장 주요 요약과 주요 조사 결과
제2장 보고서 제안
제3장 서론
조사의 전제조건과 시장 정의
조사 범위
조사 방법
제4장 주요 산업 동향
유기 재배 면적
1인당 유기농 제품에 대한 지출
규제 프레임워크
호주
중국
인도
인도네시아
일본
필리핀
태국
베트남
밸류체인과 유통채널 분석
제5장 시장 세분화
기능
작물 영양
바이오 비료
아조스피릴룸
아조토박터
마이코리자
인산염 가용화 박테리아
리조비움
기타 바이오 비료
생물촉진제
아미노산
풀빅산
휴믹산
단백질 가수분해물
해초 추출물
기타 생물촉진제
유기 비료
분뇨
식사 기반 비료
오일 케이크
기타 유기 비료
작물 보호
바이오 방제제
마크로비알
미생물
바이오 농약
바이오 살균제
바이오 제초제
바이오 살충제
기타 바이오 농약
작물 유형
환금작물
원예작물
경작작물
생산국
호주
중국
인도
인도네시아
일본
필리핀
태국
베트남
기타 아시아태평양
제6장 경쟁 구도
주요 전략 동향
시장 점유율 분석
기업 상황
기업 프로파일
Biolchim SpA
Coromandel International Ltd
Genliduo Bio-tech Corporation Ltd
Gujarat State Fertilizers & Chemicals Ltd
Indian Farmers Fertiliser Cooperative Limited
Koppert Biological Systems Inc.
Novozymes
Sustane Natural Fertilizer Inc.
Valagro
Valent Biosciences LLC
제7장 CEO에 대한 주요 전략적 질문
제8장 부록
세계 개요
개요
Five Forces 분석 프레임워크
세계의 밸류체인 분석
시장 역학(DROs)
정보원과 참고문헌
도표 일람
주요 인사이트
데이터 팩
용어집
KTH
영문 목차
영문목차
The Asia-Pacific Agricultural Biologicals Market size is estimated at 9.84 billion USD in 2025, and is expected to reach 15.04 billion USD by 2030, growing at a CAGR of 8.87% during the forecast period (2025-2030).
In the Asia-Pacific region, agricultural biologicals play a key role in sustainable agriculture. These products reduce the use of chemical fertilizers and pesticides by providing required nutrients and controlling pests and insects in crops. The agricultural biologicals market in the region is growing Y-o-Y. From 2017 to 2022, the market value grew by a CAGR of 2.2%.
The demand for biological solutions in Asia-Pacific is being driven primarily by export markets such as the European Union, which is tightening regulations on the use of some conventional pesticides and local consumer and customer demand for more sustainably grown food. Thus, more growers are showing a growing interest in alternative solutions. The most promising segments are high-value fruits and vegetables (e.g., berries and grapes) eaten fresh and crops grown in greenhouses.
PAN Asia Pacific (PANAP), one of five regional centers of the Pesticide Action Network, is creating an awareness campaign regarding the harmful effects of pesticides on humans and the environment and promoting biodiversity-based ecological agriculture.
Countries such as China, India, Australia, and Indonesia are adopting organic farming strategies. China and India are the major countries holding shares of 50.5% and 32.6%, respectively, of the agricultural biologicals market in the region. These countries are implementing different initiatives to encourage organic farming and agricultural biologicals usage widely. For instance, China is planning to reduce 10% and 5% pesticide usage in horticultural crops and row crops, respectively. India, through many initiatives like PKVY and MOVCDNER, provides financial support to farmers to buy agricultural biologicals for organic farming.
The Asia-Pacific region is one of the world's major organic producers. Rice, sugarcane, and fresh fruits and vegetables are among the major organic crops cultivated in the region. China and India are the region's main organic crop producers and have the highest organic product consumption markets.
The area of the region that was organically farmed increased significantly between 2017 and 2022, rising from 3.1 million hectares in 2017 to 3.8 million hectares in 2022. The region's biologicals market increased by 10.1% during the historical period and is expected to increase by about 65.1% over the forecast period, reaching USD 13.81 billion by 2029.
As an individual country, China dominated the Asia-Pacific agricultural biologicals market in 2022 by 50.5% of the market value and 78.6% of the market volume. India occupied second place with 32.6%, and the Rest of Asia-Pacific held 5.9% of the total Asia-Pacific biologicals market values the same year.
In 2022, row crops in the Asia-Pacific region consumed more biological fertilizers, accounting for 80.1% of the total market value. This is due to the region's huge area under cultivation of field crops, as they are the stable food in many countries in the region. This is followed by cash crops and horticultural crops, which had 10.9% and 8.3% shares, respectively, in the same year.
The rising trend in organic crop areas and the rising demand for organic products and organic fertilizers reduce overall chemical fertilizer use. The overall cost of crop production and government attempts to encourage organic farming are expected to drive the Asia-Pacific biologicals market between 2023 and 2029.
Growing government support in countries like China, India, Indonesia, and Australia, boosts organic farming in the region
The area under organic agricultural land in the Asia-Pacific region was over 3.7 million hectares in 2021, representing 26.4% of the global organic area, as per FiBL statistics. Moreover, the organic area under cultivation witnessed a growth of 19.3% between 2017-2022. As of 2020, the region recorded around 1.83 million organic producers, with India topping the list with 1.3 million organic producers. China, India, Indonesia, and Australia are the major countries with large organic cultivation areas in the region. Government authorities in countries such as China and India constantly promote organic agriculture to reduce reliance on chemical inputs for crop cultivation. For instance, India has implemented schemes such as Paramparagat Krishi Vikas Yojana and the All India Network Programme on Organic Farming (AI-NPOF).
In 2021, China accounted for the maximum share of 66.1% with 2.5 million hectares, followed by India, Indonesia, and Australia with 19.3%, 1.5%, and 1.4% shares, respectively. The crops grown in the total organic land can be divided into three types, namely row crops, horticultural crops, and cash crops. Row crops occupy a major share of organic agricultural land in the region, which accounted for a 67.5% share with 2.5 million hectares in 2021. The major row crops grown in the region include paddy, wheat, pulses, soybeans, and millets.
Cash crops held the second largest share, with 0.7 million hectares in 2021, accounting for an 18.5% share of organic cropland. The demand for organic cash crops, such as sugar and organic tea, is increasing globally. Globally, China and India are the largest organic green and black tea producers, respectively. The growing international demand is expected to increase the organic acreages in the region.
Per capita spending on organic product predominant in Australia and China's organic food market growing significantly
Organic products in India represent far less than 1.0% of the global value demand, with a per capita expenditure of just USD 0.08 in 2021. However, with people becoming more aware of the benefits of consuming organic food and the growth in demand for organic products in categories such as tea and organic juice, India represents a potential market over the coming years. It is expected to reach a value of USD 153.3 million by 2025. Currently, the market for organic goods in the region is very fragmented, with just a few supermarkets and specialty stores selling them, as only people from higher-income families are possible customers.
China continues to show organic growth above the regional and global averages, posting a 13.3% expansion in 2021. A positive growth pattern is expected to continue, with China averaging a CAGR of 7.1% between 2023 and 2029.
Organic products are anticipated to experience strong growth in China, registering a value CAGR of 7.1% between 2023 and 2029 and reaching a total of USD 6.4 billion by 2025. This growth can be attributed to an increasing emphasis on the importance of organic products among the younger generation, a rise in demand for organic baby food due to the growing number of mothers in the workforce, and the increasing adoption of the health and wellness trend. Growing consumer knowledge and buying motivations are expected to lead to a better understanding of the sustainable qualities of organic food in the region. Increased per capita income, along with increased consumer awareness of the importance of organic food intake, has the potential to raise per capita expenditure on organic food items in the Asia-Pacific region.
Asia-Pacific Agricultural Biologicals Industry Overview
The Asia-Pacific Agricultural Biologicals Market is fragmented, with the top five companies occupying 6.21%. The major players in this market are Biolchim SpA, Coromandel International Ltd, Gujarat State Fertilizers & Chemicals Ltd, Indian Farmers Fertiliser Cooperative Limited and Koppert Biological Systems Inc. (sorted alphabetically).
Additional Benefits:
The market estimate (ME) sheet in Excel format
3 months of analyst support
TABLE OF CONTENTS
1 EXECUTIVE SUMMARY & KEY FINDINGS
2 REPORT OFFERS
3 INTRODUCTION
3.1 Study Assumptions & Market Definition
3.2 Scope of the Study
3.3 Research Methodology
4 KEY INDUSTRY TRENDS
4.1 Area Under Organic Cultivation
4.2 Per Capita Spending On Organic Products
4.3 Regulatory Framework
4.3.1 Australia
4.3.2 China
4.3.3 India
4.3.4 Indonesia
4.3.5 Japan
4.3.6 Philippines
4.3.7 Thailand
4.3.8 Vietnam
4.4 Value Chain & Distribution Channel Analysis
5 MARKET SEGMENTATION (includes market size in Value in USD and Volume, Forecasts up to 2030 and analysis of growth prospects)
5.1 Function
5.1.1 Crop Nutrition
5.1.1.1 Biofertilizer
5.1.1.1.1 Azospirillum
5.1.1.1.2 Azotobacter
5.1.1.1.3 Mycorrhiza
5.1.1.1.4 Phosphate Solubilizing Bacteria
5.1.1.1.5 Rhizobium
5.1.1.1.6 Other Biofertilizers
5.1.1.2 Biostimulants
5.1.1.2.1 Amino Acids
5.1.1.2.2 Fulvic Acid
5.1.1.2.3 Humic Acid
5.1.1.2.4 Protein Hydrolysates
5.1.1.2.5 Seaweed Extracts
5.1.1.2.6 Other Biostimulants
5.1.1.3 Organic Fertilizer
5.1.1.3.1 Manure
5.1.1.3.2 Meal Based Fertilizers
5.1.1.3.3 Oilcakes
5.1.1.3.4 Other Organic Fertilizers
5.1.2 Crop Protection
5.1.2.1 Biocontrol Agents
5.1.2.1.1 Macrobials
5.1.2.1.2 Microbials
5.1.2.2 Biopesticides
5.1.2.2.1 Biofungicides
5.1.2.2.2 Bioherbicides
5.1.2.2.3 Bioinsecticides
5.1.2.2.4 Other Biopesticides
5.2 Crop Type
5.2.1 Cash Crops
5.2.2 Horticultural Crops
5.2.3 Row Crops
5.3 Country
5.3.1 Australia
5.3.2 China
5.3.3 India
5.3.4 Indonesia
5.3.5 Japan
5.3.6 Philippines
5.3.7 Thailand
5.3.8 Vietnam
5.3.9 Rest of Asia-Pacific
6 COMPETITIVE LANDSCAPE
6.1 Key Strategic Moves
6.2 Market Share Analysis
6.3 Company Landscape
6.4 Company Profiles (includes Global Level Overview, Market Level Overview, Core Business Segments, Financials, Headcount, Key Information, Market Rank, Market Share, Products and Services, and Analysis of Recent Developments).
6.4.1 Biolchim SpA
6.4.2 Coromandel International Ltd
6.4.3 Genliduo Bio-tech Corporation Ltd
6.4.4 Gujarat State Fertilizers & Chemicals Ltd
6.4.5 Indian Farmers Fertiliser Cooperative Limited
6.4.6 Koppert Biological Systems Inc.
6.4.7 Novozymes
6.4.8 Sustane Natural Fertilizer Inc.
6.4.9 Valagro
6.4.10 Valent Biosciences LLC
7 KEY STRATEGIC QUESTIONS FOR AGRICULTURAL BIOLOGICALS CEOS