미국의 농업용 생물제제 시장 : 시장 점유율 분석, 산업 동향, 통계, 성장 예측(2025-2030년)
United States Agricultural Biologicals - Market Share Analysis, Industry Trends & Statistics, Growth Forecasts (2025 - 2030)
상품코드:1693751
리서치사:Mordor Intelligence
발행일:2025년 03월
페이지 정보:영문
라이선스 & 가격 (부가세 별도)
ㅁ Add-on 가능: 고객의 요청에 따라 일정한 범위 내에서 Customization이 가능합니다. 자세한 사항은 문의해 주시기 바랍니다.
ㅁ 보고서에 따라 최신 정보로 업데이트하여 보내드립니다. 배송기일은 문의해 주시기 바랍니다.
한글목차
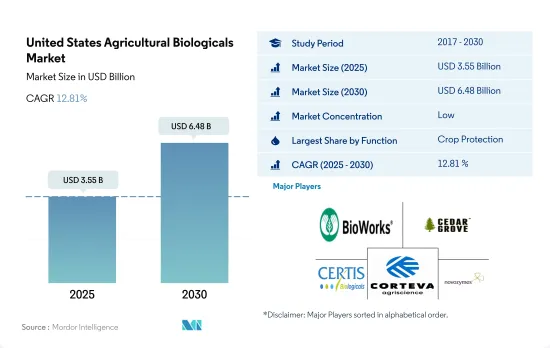
미국의 농업용 생물제제 시장 규모는 2025년에 35억 5,000만 달러로 추정되고, 2030년에는 64억 8,000만 달러에 이를 것으로 예측되며, 예측 기간인 2025-2030년 CAGR 12.81%로 성장할 전망입니다.
2022년에는 작물 보호제가 미국의 농업용 생물제제 시장을 견인했으며, 13억 5,000만 달러를 차지했습니다. 생물농약은 미국 농업용 생물제제 시장에서 가장 많이 소비되고 있으며, 2022년에는 작물보호 부문에서 83.5%의 최대 점유율을 차지했습니다. 생물농약은 생물농약 부문을 지배하고 있으며, 병원성 진균에 의해 야기되는 식물병해를 방제하기 위해 사용됩니다. 바이오 살균제에는 미생물 유래의 것과 식물 유래의 것이 있습니다. 바이오살균제 하위 부문의 2022년 시장 규모는 6억 5,090만 달러로 평가되었고, 같은 해 시장 점유율은 49.5%로 가장 많이 소비되고 있는 생물농약 유형입니다.
미국의 바이오 살충제 하위 부문의 2022년 시장 규모는 4억 390만 달러로, 점유율은 30.7%였습니다. 바이오 농약 중에서는 두 번째로 소비량이 많습니다.
2022년 미국 농업용 생물제제 시장에서 작물 영양제는 11억 5,000만 달러를 차지했습니다. 2022년 미국의 농업용 생물제제 시장에서 작물 영양제 부문에서 가장 많이 소비되는 것은 유기 비료였습니다. 비료는 미국에서 가장 많이 소비되는 유기 비료이며 2022년에는 최대 점유율 46.7%를 차지했습니다. 퇴비는 식물 유래와 동물 유래의 것이 있으며 배설물과 같은 식물이나 동물의 배설물을 분해한 것으로 일반적으로 유기물이 풍부합니다. 동물성 또는 식물성 배설물 퇴비, 농지 퇴비, 녹비는 농업에서 사용되는 일반적인 유형입니다.
농업 종사자들 사이에서 비료의 과도한 사용에 대한 의식이 높아지고, 지속 가능한 농법과 유기농업을 지원하는 정부의 대처에 의해 작물 영양 기반의 농업용 생물제제에 대한 수요가 높아지고 있습니다. 따라서 시장은 2023-2029년 증가할 것으로 예측되고 있습니다.
미국의 농업용 생물제제 시장 동향
국가의 법률 및 규제별, 특히 연작 작물에서 유기 재배 면적 증가
미국의 유기농업은 지난 20년간 대폭 증가했으나 이는 주로 특정 법규제 도입에 따른 것입니다. 2021년에는, 미국에서 유기농업이 행해지고 있는 면적은 62만 3,000 헥타르가 되었습니다.
캘리포니아는 농산물 전체에서 전미 최고 매출을 자랑하며 유기농 생산에서도 톱으로 3,000개 이상의 유기농 농장이 있습니다. 상대적으로 캘리포니아주보다 유기농업에 농지를 할애하고 있는 다른 주는 몇 개 있으며, 유기농장은 같은 주의 농지 면적의 약 4%에 불과합니다. 그 대신 유기농업 종사자가 상대적으로 많은 주의 대표는 메인 주, 뉴욕 주, 버몬트 주 등 북동부 주입니다.
전미의 유기농업을 지배하고 있는 것은 경작작물입니다. 2021년에는 전체 유기농 농지의 약 71.8%를 차지했습니다. 곡류 생산이 우세합니다. 주요 곡물은 옥수수, 밀, 쌀, 잡곡 등입니다. 유기농 제품의 소비는 미국 소비자들 사이에서 인기를 끌고 있으며, 다양한 건강상의 이점 때문에 유기농 식품을 선택하는 소비자들이 늘고 있습니다.
유기 원예 작물 전체의 재배 면적에는 증가 경향이 보이며, 2017년의 11만 2,900헥타르에서 2021년에는 15만 6,100헥타르가 되었습니다. 2021년 국내 생산에 대해서는 과일 및 채소 상위 5개 품목은 사과(31.1%), 딸기(9.5%), 오렌지(6.9%), 로메인 상추(6.7%), 감자(6.2%)였습니다. 무역의 경우, 수입이 많은 것은 바나나(53.1%), 아보카도(7.7%), 망고(5.8%), 블루베리(5.0%), 호박(4.3%)이며, 수출이 많은 것은 사과(80.0%), 배(14.4%), 체리(4.0%), 건조 양파 (1.5 %), 감자 (0.2 %)였습니다.
과일 및 야채 부문을 중심으로 하는 유기농산물에 대한 수요 증가, 유기식품에 대한 1인당 지출액 증가
미국은 세계 유수의 유기 제품 소비국입니다. 뉴트리션 비즈니스 저널지(NBJ, 2021년)에 의하면, 2020년의 이국의 유기 식품의 총 매출액은 516억 달러였습니다. 2021년에 미국은 북미 지역에서 유기농 제품에 대한 1인당 지출이 가장 많은 158달러에 해당했습니다.
유기농 신선한 과일 및 채소는 유기농 식품 소매 산업이 시작된 이래 유기농 식품의 주요 범주가 되었습니다. 2020년에는 이들 유기농 제품의 소매 매출액은 200억 달러로 평가되어 유기농 농산물에 대한 수요가 높아졌습니다. 유기농 신선 과일 및 채소의 수요는 지난 20년간 꾸준히 상승해 왔습니다. 유기농 식품의 매출이 증가하고 있는 것은, 특히 고소득층의 소비자 의식의 고조에 의한 것입니다. 가장 수요가 높은 유기농 식품 카테고리에는 계란, 유제품, 과일, 야채 등의 기본 식품이 포함됩니다.
유기농 식품의 기호는 인구층과 지역에 따라 다릅니다. 18-29세의 젊은층은, 65세 이상의 고령층에 비해 오가닉 제품을 찾는 경향이 강합니다(50% 이상). 소득과 지역도 관계하고 있어, 소득이 3만 달러 이하인 사람의 42%, 7만 5,000달러 이상인 사람의 49%가 오가닉 제품을 찾고 있습니다.
이 나라에서는 유기농 제품에 대한 1인당 지출이 증가하고 있으며, 2017-2021년 CAGR은 5.2%를 기록했습니다. 유기농 제품에 대한 수요의 증가는 미국의 유기농 생산자들이 국내외 고가치 시장을 개척할 기회를 창출하고 있습니다. 유기농 제품과 관련된 가격 프리미엄은 저소득 소비자에게 유기농 식품 소비의 주요 제한 요인 중 하나입니다.
미국의 농업용 생물제제 산업 개요
미국의 농업용 생물제제 시장은 세분화되어 있으며 상위 5개 기업에서 6.56%를 차지하고 있습니다. 이 시장의 주요 기업은 Bioworks Inc., Cedar Grove Composting Inc., Certis USA LLC, Corteva Agriscience, Novozymes 등입니다.
기타 혜택
엑셀 형식 시장 예측(ME) 시트
3개월의 애널리스트 서포트
목차
제1장 주요 요약 및 주요 조사 결과
제2장 보고서 제안
제3장 서문
조사의 전제조건 및 시장 정의
조사 범위
조사 방법
제4장 주요 산업 동향
유기 재배 면적
1인당 유기농 제품에 지출
규제 프레임워크
미국
밸류체인 및 유통채널 분석
제5장 시장 세분화
기능별
작물 영양
바이오 비료
아조스피리람
아조토박터
균근균
인산 가용화균
근립균
기타 바이오 비료
바이오 비료
아미노산
풀보산
부식산
단백질 가수분해물
해초 추출물
기타 바이오스티뮬란트
유기 비료
비료
밀베이스 비료
오일 케이크
기타 유기 비료
작물 보호
생물 방제제
매크로 미생물
미생물
바이오 농약
바이오 살균제
바이오 제초제
생물 살충제
기타 바이오 농약
작물 유형별
환금작물
원예작물
경작작물
제6장 경쟁 구도
주요 전략적 움직임
시장 점유율 분석
기업 상황
기업 프로파일
Andermatt Group AG
Bioline AgroSciences Ltd
Bioworks Inc.
Cedar Grove Composting Inc.
Certis USA LLC
Corteva Agriscience
Koppert Biological Systems Inc.
Novozymes
Sustane Natural Fertilizer Inc.
Symborg Inc.
제7장 CEO에 대한 주요 전략적 질문
제8장 부록
세계 개요
개요
Porter's Five Forces 분석 프레임워크
세계의 밸류체인 분석
시장 역학(DROs)
정보원 및 참고문헌
도표 일람
주요 인사이트
데이터 팩
용어집
AJY
영문 목차
영문목차
The United States Agricultural Biologicals Market size is estimated at 3.55 billion USD in 2025, and is expected to reach 6.48 billion USD by 2030, growing at a CAGR of 12.81% during the forecast period (2025-2030).
In 2022, crop protection led the US agricultural biologicals market, accounting for USD 1.35 billion. Biopesticides are the most consumed in the US agricultural biologicals market and accounted for a maximum share of 83.5% in the crop protection segment in 2022. Biofungicides dominate the biopesticides segment and are used to control plant diseases that are caused by pathogenic fungi. Biofungicides may be of microbial or botanical origin. The biofungicides sub-segment was valued at USD 650.9 million in 2022, and they are the most consumed biopesticide type, with a market share of 49.5% in the same year.
The bioinsecticides sub-segment in the United States was valued at USD 403.9 million in 2022, and it accounted for a share of 30.7%. They are the second-most consumed biopesticides.
Crop nutrients accounted for USD 1.15 billion in the US agricultural biologicals market in 2022. Organic fertilizers were the most consumed in the US agricultural biologicals market in the crop nutrition segment in 2022. Manures are the most consumed organic fertilizer in the United States, accounting for a maximum share of 46.7% in 2022. Manures can be of plant or animal origin, and they are a decomposed form of plant or animal waste like excreta, generally rich in organic matter. Animal or plant waste compost manure, farmyard manure, and green manure are the common types used in agriculture.
The increasing awareness about the overuse of fertilizers among farmers and the government initiatives to support sustainable agricultural practices and organic farming resulted in a rising demand for crop nutrition-based agricultural biologicals. Therefore, the market is anticipated to increase between 2023 and 2029.
United States Agricultural Biologicals Market Trends
Increase in organic area, particularly in row crops, due to country's laws and regulations
Organic agriculture in the United States has increased significantly over the last 20 years, owing mostly to the introduction of particular laws and regulations. In 2021, the area under organic agricultural farming in the United States was 623 thousand hectares.
California is the nation's top state for agricultural sales overall, and it is also the leader in organic production, with more than 3,000 organic farms. In relative terms, several other states devote a greater share of their farmland to organic farming than California, where organic farms represent only about 4% of the state's agricultural acreage. Instead, the list of top states for organic farms on a relative basis is led by northeastern states, including Maine, New York, and Vermont.
Row crops dominate organic farming in the nation. In 2021, they accounted for about 71.8% of all organic cropland. The production of cereal crops predominates. The main cereals include maize, wheat, rice, and millet. The consumption of organic products has become popular among US consumers, who increasingly choose to eat organic foods because of their various health benefits.
An increasing trend was observed in the overall organic horticulture crop cultivation area, from 112.9 thousand hectares in 2017 to 156.1 thousand hectares in 2021. Regarding domestic production in 2021, the top five fruits and vegetables were apples (31.1%), strawberries (9.5%), oranges (6.9%), romaine lettuce (6.7%), and potatoes (6.2%). In the case of trade, the most imported produce was bananas (53.1%), avocados (7.7%), mangoes (5.8%), blueberries (5.0%), and squash (4.3%), while the most exported were apples (80.0%), pears (14.4%), cherries (4.0%), dried onions (1.5%), and potatoes (0.2%).
Growing demand for organic produce especially in the fruits and vegetables sector, rise in per capita spending on organic food
The United States is one of the largest organic product consumers in the world. In 2020, the country's total sales of organic food products accounted for USD 51.6 billion, according to the Nutrition Business Journal (NBJ, 2021). In 2021, the United States had the largest per capita spending on organic products in the North American region, worth USD 158.0.
Organic fresh fruits and vegetables have been the leading organic food category since the organic food retail industry began. In 2020, retail sales for these organic products were valued at USD 20.0 billion, showing a growing demand for organic produce. The demand for organic fresh fruits and vegetables has steadily risen over the past two decades. Organic food sales are rising due to growing consumer awareness, especially among high-income consumers. The most in-demand organic categories include basic foods like eggs, dairy, fruits, and vegetables.
Organic food preferences vary by demographic and region. Younger people of age between 18-29 are more likely to seek out organic products (over 50%) compared to older people aged 65 and above. Income and region also play a role, with 42% of those with under USD 30 thousand income and 49% of those with over USD 75.0 thousand seeking organic products.
The per capita spending on organic products is increasing in the country, and it recorded a CAGR of 5.2% from 2017 to 2021. The growing demand for organic products creates opportunities for US organic producers to tap into high-value markets domestically and abroad. The price premium associated with organic products is one of the major limiting factors for organic food consumption for low-level income consumers.
United States Agricultural Biologicals Industry Overview
The United States Agricultural Biologicals Market is fragmented, with the top five companies occupying 6.56%. The major players in this market are Bioworks Inc., Cedar Grove Composting Inc., Certis USA LLC, Corteva Agriscience and Novozymes (sorted alphabetically).
Additional Benefits:
The market estimate (ME) sheet in Excel format
3 months of analyst support
TABLE OF CONTENTS
1 EXECUTIVE SUMMARY & KEY FINDINGS
2 REPORT OFFERS
3 INTRODUCTION
3.1 Study Assumptions & Market Definition
3.2 Scope of the Study
3.3 Research Methodology
4 KEY INDUSTRY TRENDS
4.1 Area Under Organic Cultivation
4.2 Per Capita Spending On Organic Products
4.3 Regulatory Framework
4.3.1 United States
4.4 Value Chain & Distribution Channel Analysis
5 MARKET SEGMENTATION (includes market size in Value in USD and Volume, Forecasts up to 2030 and analysis of growth prospects)
5.1 Function
5.1.1 Crop Nutrition
5.1.1.1 Biofertilizer
5.1.1.1.1 Azospirillum
5.1.1.1.2 Azotobacter
5.1.1.1.3 Mycorrhiza
5.1.1.1.4 Phosphate Solubilizing Bacteria
5.1.1.1.5 Rhizobium
5.1.1.1.6 Other Biofertilizer
5.1.1.2 Biostimulants
5.1.1.2.1 Amino Acids
5.1.1.2.2 Fulvic Acid
5.1.1.2.3 Humic Acid
5.1.1.2.4 Protein Hydrolysates
5.1.1.2.5 Seaweed Extracts
5.1.1.2.6 Other Biostimulants
5.1.1.3 Organic Fertilizer
5.1.1.3.1 Manure
5.1.1.3.2 Meal Based Fertilizers
5.1.1.3.3 Oilcakes
5.1.1.3.4 Other Organic Fertilizer
5.1.2 Crop Protection
5.1.2.1 Biocontrol Agents
5.1.2.1.1 Macrobials
5.1.2.1.2 Microbials
5.1.2.2 Biopesticides
5.1.2.2.1 Biofungicides
5.1.2.2.2 Bioherbicides
5.1.2.2.3 Bioinsecticides
5.1.2.2.4 Other Biopesticides
5.2 Crop Type
5.2.1 Cash Crops
5.2.2 Horticultural Crops
5.2.3 Row Crops
6 COMPETITIVE LANDSCAPE
6.1 Key Strategic Moves
6.2 Market Share Analysis
6.3 Company Landscape
6.4 Company Profiles (includes Global Level Overview, Market Level Overview, Core Business Segments, Financials, Headcount, Key Information, Market Rank, Market Share, Products and Services, and Analysis of Recent Developments).
6.4.1 Andermatt Group AG
6.4.2 Bioline AgroSciences Ltd
6.4.3 Bioworks Inc.
6.4.4 Cedar Grove Composting Inc.
6.4.5 Certis USA LLC
6.4.6 Corteva Agriscience
6.4.7 Koppert Biological Systems Inc.
6.4.8 Novozymes
6.4.9 Sustane Natural Fertilizer Inc.
6.4.10 Symborg Inc.
7 KEY STRATEGIC QUESTIONS FOR AGRICULTURAL BIOLOGICALS CEOS