북미의 농업용 생물제제 시장 : 시장 점유율 분석, 산업 동향, 성장 예측(2025-2030년)
North America Agricultural Biologicals - Market Share Analysis, Industry Trends & Statistics, Growth Forecasts (2025 - 2030)
상품코드:1693756
리서치사:Mordor Intelligence
발행일:2025년 03월
페이지 정보:영문
라이선스 & 가격 (부가세 별도)
ㅁ Add-on 가능: 고객의 요청에 따라 일정한 범위 내에서 Customization이 가능합니다. 자세한 사항은 문의해 주시기 바랍니다.
ㅁ 보고서에 따라 최신 정보로 업데이트하여 보내드립니다. 배송기일은 문의해 주시기 바랍니다.
한글목차
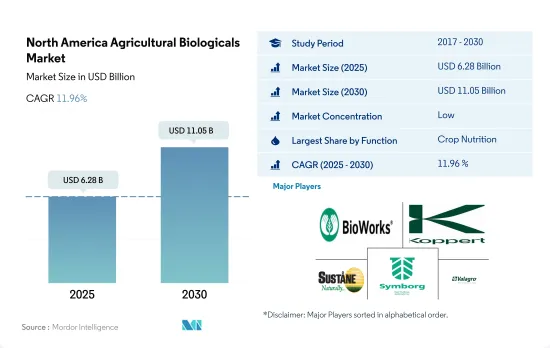
북미의 농업용 생물제제 시장 규모는 2025년에 62억 8,000만 달러로 추정되고, 2030년에는 110억 5,000만 달러에 이를 것으로 예측되며, 예측 기간인 2025-2030년 CAGR 11.96%로 성장할 것으로 예측됩니다.
농업용 생물제제는 북미의 지속 가능한 농업에서 중요한 역할을 합니다. 필요한 영양소를 공급하고 작물의 해충과 곤충을 관리함으로써 이러한 제품은 화학 비료와 농약의 사용량을 줄입니다. 이 지역의 농업용 생물제제 시장은 2017-2022년 63.1% 성장했습니다.
작물 영양 생물제제는 생물제제 시장을 독점하고 있으며, 작물 영양제 중 바이오 비료는 2022년 작물 영양제 부문을 지배했습니다. 바이오 비료는 식물의 성장을 돕는 살아있는 미생물을 포함하는 유기 물질입니다. 2017-2021년 바이오 비료 시장 규모는 약 49.3% 상승했습니다. 근립균 기반 바이오 비료는 북미의 바이오 비료 산업을 선도하며 2022년 바이오 비료 시장 규모의 약 36.5%를 차지했습니다. 이는 주로 근립균 기반 바이오 비료가 무기 질소 비료에 대한 의존성을 전반적으로 줄일 수 있기 때문입니다.
작물 보호는 작물 보호 카테고리의 94.1%를 차지하는 바이오 농약이 지배적입니다. 북미의 바이오 살균제 시장 규모는 2022년에 8억 9,120만 달러가 되었고, 같은 해 시장 점유율은 46.9%로, 가장 보급되고 있는 바이오 농약 유형이 되고 있습니다. 바이오 살균제는 병원성 곰팡이로 인한 질병을 예방하기 위해 식물에 살포되는 물질입니다. 바실러스, 트리코델마 및 슈도모나스는 시장에서 가장 널리 사용되는 바이오 살균제입니다.
화학 합성 비료의 악영향에 대한 소비자의 의식이 높아진 결과, 유기제품에 대한 수요가 국내외에서 높아지고 있습니다. 시장은 95.1% 성장했고, 2023-2029년의 CAGR은 11.8%였습니다.
2022년 시장 점유율은 55.5%로 미국이 북미의 생물제제 시장을 독점했습니다. 미국에서는 작물 보호제가 농업용 생물제제 시장을 견인해 13억 5,000만 달러를 차지했습니다. 바이오 농약은 미국에서 가장 많이 소비되는 생물학적 작물 보호 부문이며, 2022년에는 작물 보호 부문의 83.5%를 차지했습니다.
바이오 농약은 바이오 농약 부문을 지배하며 병원성 곰팡이로 인한 식물 병해를 방제하는 데 사용됩니다. 바이오 살균제에는 미생물 유래와 식물 유래의 것이 있습니다. 이 바이오 살균제의 2022년 시장 규모는 6억 5,090만 달러로, 동년 시장 점유율은 49.5%로, 가장 소비되는 유형의 바이오 농약이었습니다.
캐나다는 2022년 북미 농업용 생물제제 시장의 28.8%를 차지했으며 시장 규모는 12억 7,000만 달러였습니다. 이 나라 작물 보호 부문의 2022년 시장 규모는 약 4억 7,510만 달러였습니다. 이 나라의 작물 보호 부문은 생물 농약이 압도적이었으며 같은 해 작물 보호 시장 매출의 95.2%를 차지했습니다.
멕시코는 북미의 유기농 작물 작물 면적에서 2위의 나라입니다. 이 나라의 총 유기농 작물 면적은 2017년 51만 2,700헥타르에서 2022년 54만 1,500헥타르로 증가하고 2029년 말까지 10.9% 증가할 것으로 예측되고 있습니다. 이러한 유기농 작물 재배 면적의 증가 추세는 예측 기간 동안 생물제제의 수요를 직접적으로 증가시키고 있습니다.
지속 가능한 유기 재배 작물에 대한 수요 증가와 화학 비료의 과잉 사용에 의한 악영향이 생물제제 시장을 견인하는 요인이 되고 있습니다. 게다가 생물제제에는 생산 비용 전체를 삭감하는 능력이 있어, 시장의 성장에 한층 더 공헌하고 있습니다.
북미의 농업용 생물제제 시장 동향
미국 등 주요 국가에서 유기농산물 수요가 확대, 정부 지원으로 재배면적 증가
FibL 통계가 제공한 데이터에 따르면 북미에서의 농작물의 유기 재배 면적은 2021년에 150만 헥타르가 되었습니다. 이 지역의 유기농 총 면적은 2017-2021년 13.5% 증가했습니다. 북미 국가 중에서는 미국이 압도적이며, 유기농 농지 면적은 62만 3,000 헥타르로 캘리포니아주, 메인주, 뉴욕주가 농업을 실천하고 있는 주요 주입니다. 국내 생산에 대해서는, 주요 유기 농산물은 사과(31.1%), 딸기(9.5%), 오렌지(6.9%), 로메인 양상추(6.7%), 감자(6.2%)였습니다. 무역의 경우 2021년에 가장 많이 수입된 것은 바나나(53.1%), 아보카도(7.7%), 망고(5.8%), 블루베리(5.0%), 호박(4.3%)이었고, 가장 많이 수출된 것은 사과(80.0%), 배(14.4%), 체리(4.0%), 건조양파 (1.5%), 감자 (0.2%)였습니다.
멕시코의 2021년 유기농업 면적은 53만 1,000헥타르였습니다. 멕시코는 세계 유기농 식품 생산량 상위 20위에 올라 있습니다. 또한 국내 주요 유기농 식품 생산주로는 치아파스, 오악사카, 미초아칸, 치와와, 게레로주가 있으며 국내 유기농 면적의 80.0%를 차지하고 있습니다. 전국유기농업협회(National Association for Organic Agriculture) 등의 조직이 동 국에서 유기농업을 추진하고 있어 보다 많은 농업 종사자가 유기농업에 임하는 동기부여가 될 것으로 기대되고 있습니다.
캐나다의 유기농 작물 재배 면적은 2017년 40만 헥타르에서 2021년에는 45만 헥타르로 증가합니다. 2021년에는 420,000헥타르로 연작 작물이 최대 면적을 차지하고 있습니다. 캐나다 정부는 유기농업 종사자를 지원하기 위한 유기 개발 기금으로 2021년에 29만 7,330달러를 출연하겠다고 발표했습니다. 이러한 대처에 의해, 이 지역의 유기 재배 면적의 증가가 기대됩니다.
국내 및 국제 시장에서 유기농산물에 대한 수요 증가, 유기농 식품에 대한 1인당 지출 증가
북미의 유기농 식품에 대한 1인당 평균 지출액은 2021년에는 108달러로 기록되었습니다. 북미 국가 중에서는 미국이 1인당 지출액이 가장 높았고, 2021년 평균 지출액은 158달러였습니다.
팬데믹은 유기농 식품의 소비 증가의 주요 요인이 되고 있습니다. Organic Produce Network와 Category Partners의 보고서에 따르면 2020년 미국의 유기농 제품 매출은 14.2% 증가했으며 이는 10억 달러 증가에 해당하며 금액은 85억 달러에 달했습니다.
2021년 미국의 유기농 제품 매출은 전년대비 2.0% 증가한 630억 달러를 넘었습니다. 유기농 과일 및 채소는 유기농 제품 매출액 전체의 15.0%를 차지하며 2021년에는 210억 달러가 되었습니다.
캐나다 유기 연맹이 보고한 데이터에 따르면 캐나다에서 유기농 식품의 판매액은 2020년에 81억 달러에 달했습니다. 캐나다는 유기농 제품 세계 6위의 시장이며, 이 나라에서는 유기농 제품의 공급이 수요를 따라가지 못하고 있습니다. 2021년에는 1인당 유기농 식품에 대한 평균 지출액은 142.6달러였습니다. 오가닉트레이드협회에 따르면 2021년 멕시코 오가닉 제품 시장 규모는 6,300만 달러로 세계 순위 35위이며 2021-2026년 CAGR은 7.2%를 기록할 것으로 추정되고 있습니다. 그러나 이 나라의 유기농 제품에 대한 1인당 지출액은 2021년에는 0.49달러로 이 지역의 다른 나라에 비해 적습니다. 멕시코 시장에 진입하는 기업이 늘어남으로써 이 나라의 유기농 제품에 대한 수요가 높아질 것으로 기대됩니다.
북미의 농업용 생물제제 산업 개요
북미의 농업용 생물제제 시장은 세분화되어 있으며 상위 5개 기업에서 0.75%를 차지하고 있습니다. 이 시장의 주요 기업은 Bioworks Inc., Koppert Biological Systems Inc., Sustane Natural Fertilizer Inc., Symborg Inc., Valagro USA 등입니다.
기타 혜택
엑셀 형식 시장 예측(ME) 시트
3개월의 애널리스트 서포트
목차
제1장 주요 요약 및 주요 조사 결과
제2장 보고서 제안
제3장 서문
조사의 전제조건 및 시장 정의
조사 범위
조사 방법
제4장 주요 산업 동향
유기 재배 면적
1인당 유기농 제품에 대한 지출
규제 프레임워크
캐나다
멕시코
미국
밸류체인 및 유통 채널 분석
제5장 시장 세분화
기능별
작물 영양
바이오 비료
아조스피리람
아조토박터
균근균
인산 가용화균
근립균
기타 바이오 비료
바이오 비료
아미노산
풀보산
부식산
단백질 가수분해물
해초 추출물
기타 바이오스티뮬란트
유기 비료
비료
밀베이스 비료
오일 케이크
기타 유기 비료
작물 보호
생물 방제제
매크로 미생물
미생물
바이오 농약
바이오 살균제
바이오 제초제
생물 살충제
기타 바이오 농약
작물 유형별
환금작물
원예작물
경작작물
국가별
캐나다
멕시코
미국
기타 북미
제6장 경쟁 구도
주요 전략 동향
시장 점유율 분석
기업 상황
기업 프로파일
Agriculture Solutions Inc.
Andermatt Group AG
BioFert Manufacturing Inc.
BIOQUALITUM SA de CV
Bioworks Inc.
Koppert Biological Systems Inc.
Lallemand Inc.
Sustane Natural Fertilizer Inc.
Symborg Inc.
Valagro USA
제7장 CEO에 대한 주요 전략적 질문
제8장 부록
세계 개요
개요
Porter's Five Forces 분석 프레임워크
세계의 밸류체인 분석
시장 역학(DROs)
정보원 및 참고문헌
도표 일람
주요 인사이트
데이터 팩
용어집
AJY
영문 목차
영문목차
The North America Agricultural Biologicals Market size is estimated at 6.28 billion USD in 2025, and is expected to reach 11.05 billion USD by 2030, growing at a CAGR of 11.96% during the forecast period (2025-2030).
Agricultural biologicals play an important role in sustainable agriculture in North America. By delivering necessary nutrients and managing pests and insects in crops, these products decrease the usage of chemical fertilizers and pesticides. The regional agricultural biologicals market grew by 63.1% between 2017 and 2022.
Crop nutrition biologicals dominate the biologicals market, and among crop nutrients, biofertilizers dominated the crop nutrient segment in 2022. Biofertilizers are organic substances containing live microorganisms that help plants thrive. From 2017 to 2021, the biofertilizer market value rose by approximately 49.3%. Rhizobium-based biofertilizers lead the North American biofertilizer industry, accounting for approximately 36.5% of the biofertilizer market value in 2022. This is mostly owing to the potential of rhizobium-based biofertilizers to reduce overall reliance on inorganic nitrogen fertilizers.
Crop protection is dominated by biopesticides, which account for 94.1% of the crop protection category. The market for biofungicides in North America was valued at USD 891.2 million in 2022, making them the most popular biopesticide type with a 46.9% market share in the same year. Biofungicides are substances that are applied to plants to prevent diseases caused by pathogenic fungi. Bacillus, Trichoderma, and Pseudomonas are the most widely available biofungicides on the market.
The demand for organic products has grown both domestically and internationally as a result of consumers' growing awareness of the negative effects of synthetic fertilizers. The market grew by 95.1%, with a CAGR of 11.8% between 2023 and 2029.
The United States dominated the North American biologicals market with a market share of 55.5% in 2022. Crop protection led the agricultural biologicals market in the United States and accounted for USD 1.35 billion. Biopesticides are the most consumed biological crop protection segment in the United States and accounted for 83.5% of the crop protection segment in 2022.
Biofungicides dominate the biopesticide segment and are used to control plant diseases caused by pathogenic fungi. Biofungicides may be of microbial or botanical origin. The market for these biofungicides was valued at USD 650.9 million in 2022 and was the most consumed type of biopesticide, with a market share of 49.5% in the same year.
Canada accounted for 28.8% of the North American agricultural biologicals market in 2022, with a market value of USD 1.27 billion. The crop protection segment in the country was valued at about USD 475.1 million in 2022. Biopesticides dominated the crop protection segment in the country, accounting for 95.2% of the crop protection market value in the same year.
Mexico is the second-largest country in terms of organic crop area in the North American region. The total organic crop area in the country increased from 512.7 thousand hectares in 2017 to 541.5 thousand hectares in 2022 and is anticipated to increase by 10.9% by the end of 2029. This increasing trend in organic crop areas directly increases the demand for biologicals in the forecast period.
The increasing demand for sustainable or organically cultivated crops and the adverse effects of the overuse of chemical fertilizers are factors driving the market for biologicals. Additionally, biologicals have the ability to reduce the overall cost of production, further contributing to market growth.
North America Agricultural Biologicals Market Trends
Organic produce demand grows in major countries like the United States, increasing cultivation area with government support
According to the data provided by FibL statistics, the area under organic cultivation of crops in North America was 1.5 million hectares in 2021. The total organic area in the region increased by 13.5% between 2017 and 2021. Among the North American countries, the United States is dominant, with 623.0 thousand hectares of agricultural land under organic farming, with California, Maine, and New York being the major states practicing agriculture. Regarding domestic production, the main organic produce was apples (31.1%), strawberries (9.5%), oranges (6.9%), romaine lettuce (6.7%), and potatoes (6.2%). In the case of trade, the most imported products were bananas (53.1%), avocados (7.7%), mangoes (5.8%), blueberries (5.0%), and squash (4.3%), while the most exported were apples (80.0%), pears (14.4%), cherries (4.0%), dried onions (1.5%), and potatoes (0.2%) in 2021.
Mexico had 531.1 thousand hectares of area under organic farming in 2021. Mexico is among the top 20 organic food producers in the world. Moreover, the major organic food-producing states in the country include Chiapas, Oaxaca, Michoacan, Chihuahua, and Guerrero, which account for 80.0% of the total organic area in the country. Organizations such as the National Association for Organic Agriculture are promoting organic agriculture in the country, which is expected to motivate more farmers to take up organic agriculture.
Canada's area under organic crop cultivation increased from 400,000 hectares in 2017 to 450,000 hectares in 2021. Row crops occupied the maximum area, with 420,000 hectares in 2021. The Canadian government announced a sum of USD 297,330 in 2021 as an Organic Development Fund to support organic farmers. These initiatives are expected to increase the organic area in the region.
Growing demand for organic produce in domestic and international markets, rise in per capita spending on organic food
The average per capita spending on organic food products in North America was recorded as USD 108.0 in 2021. Among the North American countries, the United States had the highest per capita spending, with an average spending of USD 158.0 in 2021.
The pandemic has been a major factor in the increase of organic food consumption. In 2020, sales of organic products in the United States grew by 14.2%, which represented an increase of USD 1.0 billion, reaching a value of USD 8.50 billion, according to a report by Organic Produce Network and Category Partners.
In 2021, organic product sales in the United States crossed USD 63.00 billion with a 2.0% increase over the previous year. Organic fruits and vegetables accounted for 15.0% of the total organic product sales with a value of USD 21.0 billion in 2021.
According to data reported by the Organic Federation of Canada, organic food sales in Canada reached a value of USD 8.10 billion in 2020. Canada is the 6th largest market in the world for organic products, with the supply of organic products failing to keep up with the demand in the country. In 2021, the average spending on organic food per person was USD 142.6. In 2021, Mexico registered a market size of USD 63.0 million for organic products with a global rank of 35, and it is estimated to record a CAGR of 7.2% between 2021 and 2026, according to the Organic Trade Association. However, the per capita spending on organic products in the country is less compared to other countries in the region with a value of USD 0.49 in 2021. It is expected that more players entering the market in Mexico will increase the demand for organic products in the country.
North America Agricultural Biologicals Industry Overview
The North America Agricultural Biologicals Market is fragmented, with the top five companies occupying 0.75%. The major players in this market are Bioworks Inc., Koppert Biological Systems Inc., Sustane Natural Fertilizer Inc., Symborg Inc. and Valagro USA (sorted alphabetically).
Additional Benefits:
The market estimate (ME) sheet in Excel format
3 months of analyst support
TABLE OF CONTENTS
1 EXECUTIVE SUMMARY & KEY FINDINGS
2 REPORT OFFERS
3 INTRODUCTION
3.1 Study Assumptions & Market Definition
3.2 Scope of the Study
3.3 Research Methodology
4 KEY INDUSTRY TRENDS
4.1 Area Under Organic Cultivation
4.2 Per Capita Spending On Organic Products
4.3 Regulatory Framework
4.3.1 Canada
4.3.2 Mexico
4.3.3 United States
4.4 Value Chain & Distribution Channel Analysis
5 MARKET SEGMENTATION (includes market size in Value in USD and Volume, Forecasts up to 2030 and analysis of growth prospects)
5.1 Function
5.1.1 Crop Nutrition
5.1.1.1 Biofertilizer
5.1.1.1.1 Azospirillum
5.1.1.1.2 Azotobacter
5.1.1.1.3 Mycorrhiza
5.1.1.1.4 Phosphate Solubilizing Bacteria
5.1.1.1.5 Rhizobium
5.1.1.1.6 Other Biofertilizer
5.1.1.2 Biostimulants
5.1.1.2.1 Amino Acids
5.1.1.2.2 Fulvic Acid
5.1.1.2.3 Humic Acid
5.1.1.2.4 Protein Hydrolysates
5.1.1.2.5 Seaweed Extracts
5.1.1.2.6 Other Biostimulants
5.1.1.3 Organic Fertilizer
5.1.1.3.1 Manure
5.1.1.3.2 Meal Based Fertilizers
5.1.1.3.3 Oilcakes
5.1.1.3.4 Other Organic Fertilizer
5.1.2 Crop Protection
5.1.2.1 Biocontrol Agents
5.1.2.1.1 Macrobials
5.1.2.1.2 Microbials
5.1.2.2 Biopesticides
5.1.2.2.1 Biofungicides
5.1.2.2.2 Bioherbicides
5.1.2.2.3 Bioinsecticides
5.1.2.2.4 Other Biopesticides
5.2 Crop Type
5.2.1 Cash Crops
5.2.2 Horticultural Crops
5.2.3 Row Crops
5.3 Country
5.3.1 Canada
5.3.2 Mexico
5.3.3 United States
5.3.4 Rest of North America
6 COMPETITIVE LANDSCAPE
6.1 Key Strategic Moves
6.2 Market Share Analysis
6.3 Company Landscape
6.4 Company Profiles (includes Global Level Overview, Market Level Overview, Core Business Segments, Financials, Headcount, Key Information, Market Rank, Market Share, Products and Services, and Analysis of Recent Developments).
6.4.1 Agriculture Solutions Inc.
6.4.2 Andermatt Group AG
6.4.3 BioFert Manufacturing Inc.
6.4.4 BIOQUALITUM SA de CV
6.4.5 Bioworks Inc.
6.4.6 Koppert Biological Systems Inc.
6.4.7 Lallemand Inc.
6.4.8 Sustane Natural Fertilizer Inc.
6.4.9 Symborg Inc.
6.4.10 Valagro USA
7 KEY STRATEGIC QUESTIONS FOR AGRICULTURAL BIOLOGICALS CEOS