ㅁ Add-on 가능: 고객의 요청에 따라 일정한 범위 내에서 Customization이 가능합니다. 자세한 사항은 문의해 주시기 바랍니다.
ㅁ 보고서에 따라 최신 정보로 업데이트하여 보내드립니다. 배송기일은 문의해 주시기 바랍니다.
한글목차
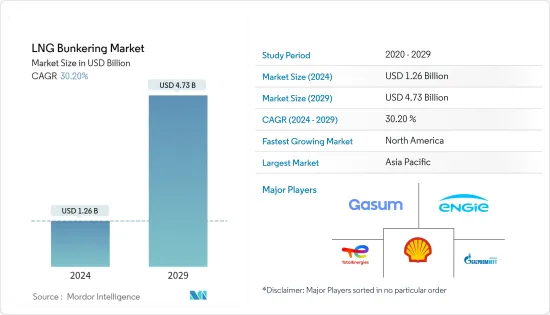
LNG 벙커링 시장 규모는 2024년 12억 6,000만 달러로 추정되고, 2029년까지 47억 3,000만 달러에 이를 것으로 예측되며, 예측 기간(2024-2029년) 동안 30.20%의 연평균 복합 성장률(CAGR)로 성장할 전망입니다.
COVID-19 감염의 팬데믹 중 일시적인 수출입 금지로 인해 시장이 침체되었습니다. 그러나 해운으로 인한 벙커 연료로 LNG 수요가 증가함에 따라 2021년 하반기 시장은 수익 감소에서 회복되었습니다. 시장 성장의 관점에서 기존 연료의 황 함량을 제한하는 기준과 효율성 향상으로 LNG 벙커링 인프라에 대한 수요가 증가하고 있습니다. 다양한 지역의 선박들은 추진용 연료로 LNG를 점차 채용하기 시작했습니다. 또한 기존 연료에서 유황을 줄이는 데는 비용이 많이 들고 경제성이 저하될 수 있습니다.
주요 하이라이트
유조선 플릿 부문은 예측 기간 동안 상당한 성장을 이룰 수 있습니다.
벙커 연료로서의 LNG는 준수 기간의 연장부터 GHG 배출량의 감소에 이르기까지 기존의 벙커 연료에 비해 헤아릴 수 없는 이점을 가져옵니다. IMO 규제의 시행은 선박이 유황 함량이 적은 연료로 전환하게 되기 때문에 LNG는 이상적인 선택이 되어 벙커링 시장에서의 기회로 이어집니다.
수요의 대부분은 미국과 캐나다에서 왔으며 북미가 시장을 독점할 것으로 예상됩니다.
액화천연가스(LNG) 벙커링 시장 동향
유조선 플릿이 상당한 성장을 보입니다.
유조선 플릿에는 소형 유조선, 중형 유조선, 중거리 1(MR1), 중거리 2(MR2), 대형 유조선 1(LR1), 대형 유조선 2(LR2), 초대형 원유 운반선(VLCC) 및 초대형 유조선이 포함됩니다. 대형 원유 운반선(ULCC)은 유조선 용량에 따라 다릅니다.
유조선 플릿은 많은 양의 가스 및 액체를 보관하거나 운반하는 데 사용됩니다. 이들은 석유, 가스, 화학물질, 식물성 기름, 담수, 와인, 당밀 등과 같은 다른 제품을 보관하고 운반하는 데 사용됩니다.
2020년 국제해사기관은 해양활동에 의한 온실가스 배출을 제한하기 위해 연료함량에 대한 세계 유황함량의 새로운 0.5% 상한을 시행하여 이전 3.5%에서 인하했습니다. 벙커 연료로서의 LNG는 NOx 배출량을 최대 80% 삭감하고, SOx 입자상 물질을 배제하는 등 다른 유형의 벙커 연료에 비해 큰 이점을 가져, 최신의 엔진 기술에 의해 GHG 배출량을 최대 23% 감소합니다. 경쟁력있는 설계로 LNG를 사용하여 작동하는 선박은 기존 설계보다 장기간의 컴플라이언스를 보장합니다. 이러한 요인으로 인해 벙커 연료로서 LNG의 채용이 증가하고 유조선에 의한 LNG 수송이 증가하고 있습니다.
2020년 말 현재 LNG 유조선의 총 플릿은 642척으로 구성되었으며 총 운영 능력은 9,340만 입방미터였습니다. 2020년에는 제조업체로부터 47척의 선박이 인도되었고 40척의 유조선이 새로 주문되었습니다. 주문은 2020년까지 147호, 2,270만 입방미터로 구성되어 있습니다.
따라서 연료 중의 황 함량에 관한 규제는 LNG가 향후 수년간 해양 활동에 의존하는 연료가 될 것으로 예측되어 유조선에 의한 LNG 벙커 연료 수송 증가로 이어질 것입니다.
북미가 시장을 독점합니다.
북미는 예측 기간 동안 LNG 벙커링 시장을 독점할 가능성이 높으며 수요의 대부분은 미국과 캐나다에서 온 것입니다.
LNG 벙커링 시장을 견인하는 주요 요인은 해운 산업에서 이산화탄소 배출량 감소를 위한 LNG 수요 증가입니다. 또한 LNG는 더 나은 대체 연료이며 정부는 LNG 적응에 대한 노력을 추진하고 있습니다.
2020년 국제해사기관은 해양활동에서 온실가스 배출을 억제하기 위해 벙커연료의 황함량을 줄였습니다. 이러한 요인으로 인해 IMO 규제 이후의 LNG는 선박용 연료의 경제적 대안이 될 가능성이 높으며, 미국의 LNG 벙커링 시장은 향후 수년간 성장할 것으로 예상됩니다.
2022년 1월, 미국 조선 회사인 Fincantieri Bay Shipbuilding은 미국에서 가장 큰 LNG 벙커링 바지의 건설을 시작했습니다. LNG 벙커링 바지는 길이 126.8m의 배로 구성되며 12,000입방 미터의 LNG를 수용할 수 있는 능력이 있습니다. 프로젝트 완성 예정일은 2023년입니다.
또한, 2021년 9월, Stabilis Solutions는 텍사스 주 포트 이자벨 물류 해양 터미널 및 루이지애나 주 카메론 교구 포트 하버 터미널 지구 및 선박용 LNG 급유 서비스를 개발하기 위한 각서(MoU)를 체결했습니다.
마찬가지로 2021년 4월 Wison Offshore &Marine(Wison)은 Pilot LNG의 캐나다 갤버스턴 LNG 벙커 항구 프로젝트의 프론트엔드 엔지니어링 개발(FEED) 계약을 수주하고 2024년에 운영을 시작할 예정입니다.
캐나다 정부는 온실가스 배출량을 크게 줄일 것을 약속하고 있으며, 이 나라에는 천연가스가 풍부하게 공급되고 있습니다. 천연가스를 연소시키면 온실가스 배출이 줄어들기 때문에 LNG는 캐나다 해운산업에 탁월한 대체 선박연료가 되고 있습니다.
LNG 기반 선박의 초기 설치 비용은 높지만 스크러버가 설치된 오래된 선박을 운용하는 경우에 비해 운용 비용은 낮습니다. 따라서 북미는 예측 기간 동안 전체 LNG 벙커링 시장을 지배할 수 있습니다.
액화 천연가스(LNG) 벙커링 산업 개요
LNG 벙커링 시장은 적당히 통합되어 있습니다. 주요 기업으로는 Shell PLC, Gazprom Neft PJSC, TotalEnergies SE, Gasum Oy, Engie SA 등이 있습니다.
기타 혜택
엑셀 형식 시장 예측(ME) 시트
3개월의 애널리스트 서포트
목차
제1장 서론
조사 범위
시장의 정의
조사의 전제조건
제2장 주요 요약
제3장 조사 방법
제4장 시장 개요
서문
시장 규모 및 수요 예측(100만 달러)(-2027년)
최근 동향 및 발전
정부의 정책 및 규제
시장 역학
성장 촉진요인
억제요인
공급망 분석
Porter's Five Forces 분석
공급기업의 협상력
소비자의 협상력
신규 참가업체의 위협
대체품의 위협
경쟁 기업간 경쟁 관계의 격렬
제5장 시장 세분화
최종 사용자별
탱커 플릿
컨테이너 플릿
장미 화물 및 일반화물 플릿
페리 및 OSV
기타 최종 사용자
지역별
북미
유럽
아시아태평양
중동 및 아프리카
남미
제6장 경쟁 구도
합병 및 인수, 합작사업, 협업 및 계약
유력 기업이 채용한 전략
기업 프로파일
Shell PLC
ENN Energy Holdings Ltd
Korea Gas Corporation
Harvey Gulf International Marine LLC
Gasum Oy
Engie SA
Gazprom Neft PJSC
TotalEnergies SE
Naturgy Energy Group SA
제7장 시장 기회 및 미래 동향
AJY
영문 목차
영문목차
The LNG Bunkering Market size is estimated at USD 1.26 billion in 2024, and is expected to reach USD 4.73 billion by 2029, growing at a CAGR of 30.20% during the forecast period (2024-2029).
During the COVID-19 pandemic, the market experienced a decline due to temporary bans on export and import. However, the market recovered from the declining revenues in the second half of 2021, owing to the rising demand for LNG as bunker fuel from maritime transport. In terms of market growth, the norms to restrict the sulfur content in conventional fuels and the increased efficiency are driving the demand for LNG bunkering infrastructure. The ships across various regions are slowly starting to adopt LNG as a fuel for propulsion. Moreover, reducing the sulfur content from conventional fuel requires high costs, which is likely to hamper its economic viability.
Key Highlights
The tanker fleet segment is likely to witness significant growth during the forecast period.
LNG as a bunker fuel presents immense benefits over conventional bunker fuel, ranging from increased length of compliance to reduced GHG emissions. With the IMO regulations in place, maritime vessels will be switching to less sulfur content fuel, making LNG an ideal choice and leading to opportunities in the bunkering market.
North America is expected to dominate the market, with most of the demand coming from the United States and Canada.
Liquefied Natural Gas (LNG) Bunkering Market Trends
Tanker Fleet to Witness Significant Growth
Tanker fleets include small tanker, intermediate tanker, medium-range 1 (MR1), medium-range 2 (MR2), large range 1 (LR1), large range 2 (LR2), very large crude carrier (VLCC), and ultra-large crude carrier (ULCC), which differ based on tanker capacity.
Tanker fleets are used to store or transport gases/liquids in bulk amounts. These are used to store and carry oil, gas, chemicals, and other products, like vegetable oil, freshwater, wine, molasses, etc.
In 2020, the International Maritime Organization enforced a new 0.5% global sulfur cap on fuel content, lowering from the earlier 3.5% to limit the greenhouse gas emissions from the marine activities. LNG as a bunker fuel presents significant advantages over other kinds of bunker fuels, such as reducing NOx emissions by up to 80% and eliminating SOx particulate matter, leading to a reduction in GHG emissions by up to 23% with modern engine technology. Vessels that run on LNG on a competitive design ensure longer compliance than conventional designs. These factors have led to increasing adoption of LNG as a bunker fuel and increasing transport of LNG through tankers.
At the end of 2020, the total LNG tanker fleet consisted of 642 vessels with a total operational capacity of 93.4 million cubic meters. In 2020, 47 more vessels were delivered by the manufacturers and 40 new orders for tankers. The order book consisted of 147 units of 22.7 million cubic meters by 2020.
Thus, with the regulations related to sulfur content in the fuel, LNG is projected to become a reliant fuel for maritime activity in the coming years, leading to the increased transportation of LNG bunker fuel through tankers.
North America to Dominate the Market
The North American region is likely to dominate the LNG bunkering market during the forecast period, with most demand coming from the United States and Canada.
The key factor driving the LNG bunkering market is the increased LNG demand to reduce the carbon footprint in the shipping industry. Furthermore, LNG is a better alternative fuel, and the governments have been taking initiatives for LNG adaptation.
In 2020, the International Maritime Organization implemented the reduced sulfur content in bunker fuels to contain the GHG emission from maritime activity. Due to this factor, the US LNG bunkering market is expected to witness growth in the coming years, as LNG is likely to be an economical alternative for marine fuel after IMO's regulation.
In January 2022, the US shipbuilder Fincantieri Bay Shipbuilding commenced the construction of the largest LNG bunkering barge in the United States. The LNG bunkering barge will consist of a 126.8 m vessel, which will have the capacity for 12,000 m3 of LNG. The expected completion date of the project is 2023.
Furthermore, in September 2021, Stabilis Solutions Inc. signed a memorandum of understanding (MoU) with Port Isabel Logistical Offshore Terminal in Texas and Louisiana's Cameron Parish Port, Harbor & Terminal District to develop LNG refueling services for ships.
Similarly, in April 2021, Wison Offshore & Marine (Wison) was awarded the Front-End Engineering Development (FEED) contract for Pilot LNG's Galveston LNG Bunker Port project in Canada, with operations slated to begin in 2024.
The Canadian government made commitments to significantly reduce greenhouse gas emissions, and the country has an abundant supply of natural gas. Natural gas on combustion produces less greenhouse gas emissions, making LNG a better alternative marine fuel for the Canadian shipping industry.
Although the initial installation cost of LNG-based vessels is high, the operational cost is lower compared to running old ships with installed scrubbers. Therefore, the North American region is likely to dominate the overall LNG bunkering market during the forecast period.
Liquefied Natural Gas (LNG) Bunkering Industry Overview
The LNG bunkering market is moderately consolidated. The major companies include Shell PLC, Gazprom Neft PJSC, TotalEnergies SE, Gasum Oy, and Engie SA.
Additional Benefits:
The market estimate (ME) sheet in Excel format
3 months of analyst support
TABLE OF CONTENTS
1 INTRODUCTION
1.1 Scope of the Study
1.2 Market Definition
1.3 Study Assumptions
2 EXECUTIVE SUMMARY
3 RESEARCH METHODOLOGY
4 MARKET OVERVIEW
4.1 Introduction
4.2 Market Size and Demand Forecast in USD million, till 2027
4.3 Recent Trends and Developments
4.4 Government Policies and Regulations
4.5 Market Dynamics
4.5.1 Drivers
4.5.2 Restraints
4.6 Supply Chain Analysis
4.7 Porter's Five Forces Analysis
4.7.1 Bargaining Power of Suppliers
4.7.2 Bargaining Power of Consumers
4.7.3 Threat of New Entrants
4.7.4 Threat of Substitutes Products and Services
4.7.5 Intensity of Competitive Rivalry
5 MARKET SEGMENTATION
5.1 End User
5.1.1 Tanker Fleet
5.1.2 Container Fleet
5.1.3 Bulk and General Cargo Fleet
5.1.4 Ferries and OSV
5.1.5 Other End Users
5.2 Geography
5.2.1 North America
5.2.2 Europe
5.2.3 Asia-Pacific
5.2.4 Middle-East and Africa
5.2.5 South America
6 COMPETITIVE LANDSCAPE
6.1 Mergers and Acquisitions, Joint Ventures, Collaborations, and Agreements