본 조사 패키지는 빠르게 변화하는 공유 모빌리티 시장에 대한 상세한 분석을 제공합니다. 공유 모빌리티 서비스 제공업체는 주요 모빌리티 트렌드와 과제, 잠재적 성장 기회, 경쟁 환경을 이해할 수 있습니다.
이 조사 자료집에는 공유 모빌리티 시장의 향후 성장을 예측할 수 있는 데이터에 대한 액세스가 포함되어 있습니다. 심층적인 조사를 통해 공유 모빌리티 시장의 최신 기회와 동향을 파악하고, 15개 공유 모빌리티 서비스 제공업체에 대한 광범위한 분석을 포함한 통찰력 있는 자료를 제공합니다. 일반 대중의 인식, 멀티모달 계획 능력, 접근성 문제 등 다양한 측면이 보고서 전반에 걸쳐 탐구되고 있습니다.
주요 특징
시장 역학 : 공유 모빌리티 시장의 주요 모빌리티 트렌드와 시장 확대 과제에 대한 인사이트를 제공합니다. 공공과 민간 부문의 분리, 규제의 복잡성, 운영 비용 유지, 접근성 문제, 공유 모빌리티의 다양한 사용 사례에 대한 분석과 함께 공유 모빌리티가 채택될 수 있는 다양한 사용 사례에 대한 분석도 제공합니다. 또한, 공유 모빌리티의 향후 전망에 대한 전망도 제시합니다.
주요 요점 및 전략적 제안 : 시장 개척의 주요 기회와 조사 결과를 상세히 분석하여, 공유 모빌리티 서비스 제공업체들에게 새로운 트렌드와 향후 시장 전개에 대한 전략적 제안을 제공합니다.
벤치마크 산업 예측 : 예측에는 라이드 헤일링, 카셰어링, e스쿠터, 바이크 셰어링으로 구분된 공유 모빌리티 관련 데이터가 포함됩니다. 여기에는 각 부문의 이동 횟수, 이동 거리 등의 지표가 포함됩니다. 이 예측에는 MaaS(Mobility-as-a-Service)와 대중교통에 대한 데이터도 포함되며, 소비자 사용자와 기업 사용자, 수익, 절감액으로 나뉘어져 있습니다.
주니퍼 리서치의 경쟁사 순위표 : 15개 공유 모빌리티 벤더의 역량을 평가하고, 공유 모빌리티 업계의 주요 기업을 중심으로 분석합니다.
샘플보기
시장 데이터 및 예측 보고서
샘플
시장 동향 및 전략 보고서
시장 데이터 및 예측 보고서
이 조사 제품군에는 132개의 표와 60,000개 이상의 데이터 포인트로 구성된 예측 데이터세트에 대한 액세스가 포함되어 있습니다. 조사 제품군에는 다음과 같은 지표가 포함되어 있습니다:
공유 모빌리티와 MaaS의 총 사용자 수
공유 모빌리티 및 MaaS 서비스 총 지출액
공유 모빌리티와 MaaS의 주행거리
공유 모빌리티 부분에는 다음과 같은 지표가 포함되어 있습니다:
공유 모빌리티 사용자 수
공유 모빌리티 서비스 총 지출액
공유 모빌리티 운행 횟수
공유 모빌리티 주행거리
이러한 지표는 다음과 같은 주요 시장에 대해 제공됩니다:
라이드 헤일링
카셰어링
전동 스쿠터
자전거 공유
조사에서 MaaS 부분에는 다음과 같은 지표가 포함됩니다:
MaaS 및 MaaS 지원 대중교통 사용자 수
MaaS 및 MaaS 지원 대중교통 이용자로부터의 수익 창출
MaaS 및 MaaS 지원 대중교통 운행 횟수
이러한 지표는 다음과 같은 시장별로 제공되고 있습니다:
소비자 대상 MaaS 사용자 수 및 수익 현황
기업용 MaaS 사용자 수와 수익
소비자 대상 MaaS를 통한 절감액
기업용 MaaS를 통한 절감액
버스 및 철도 서비스
주니퍼 리서치의 인터랙티브 예측(Excel)은 다음과 같은 기능을 제공합니다:
통계 분석 : 데이터 기간 동안 모든 지역과 국가에 대해 표시되는 특정 지표를 검색할 수 있습니다. 그래프는 쉽게 수정할 수 있으며, 클립보드로 내보내기도 가능합니다.
국가별 데이터 도구 : 이 도구에서는 예측 기간 동안 모든 지역과 국가의 지표를 확인할 수 있습니다. 사용자는 검색창을 통해 표시되는 지표를 좁힐 수 있습니다.
국가별 비교 도구 : 각 국가를 선택하여 비교할 수 있습니다. 이 도구에는 그래프를 내보내는 기능이 포함되어 있습니다.
What-if 분석 : 여기서 사용자는 예측 지표를 자신의 가정과 비교할 수 있습니다.
경쟁사 리더보드 보고서
경쟁사 리더보드 보고서는 공유 모빌리티 솔루션 분야의 15개 주요 벤더에 대한 상세한 평가와 시장에서의 포지셔닝을 제공합니다. 이들 업체는 역량 및 역량 평가, 어떤 공유 모빌리티 모드를 제공하는지, 경쟁사와 차별화할 수 있는 기술이 있는지 등에 따라 기존 리더, 주요 도전자, 또는 파괴자 및 도전자로 분류됩니다.
목차
시장 동향과 전략
제1장 중요 포인트와 전략적 제안
중요 포인트
전략적 제안
제2장 시장 상황
공유 모빌리티의 역사
공유 모빌리티는 왜 필요한가?
공유 모빌리티 종류
라이드 헤일링
마이크로모빌리티
전동 스쿠터
자전거 공유
라이드셰어링
마이크로 트랜짓과 셔틀 서비스
마이크로 트랜짓
셔틀 서비스
도심 항공 모빌리티(UAM)
공공교통기관
버스
버스 고속 운송 시스템(BRT)
열차
트램
메트로 시스템
페리
Mobility-as-a-Service
제3장 부문 분석
라이드 헤일링
현재 상황
최근 동향
과제
향후 전망
공유 마이크로모빌리티
현재 상황
최근 동향
과제
향후 전망
라이드셰어링
현재 상황
최근 동향
과제
향후 전망
도심 항공 모빌리티(UAM)
현재 상황
최근 동향
과제
향후 전망
공공교통기관
현재 상황
최근 동향
과제
향후 전망
Mobility-as-a-Service
현재 상황
최근 동향
과제
향후 전망
제4장 국가별 준비 지수
국가별 준비 지수 : 소개
초점 시장
성장 시장
포화 시장
신흥 시장
경쟁 리더보드
제1장 Juniper Research 경쟁 리더보드
제2장 기업 개요
벤더 개요
Bird Global
BlaBlaCar
Bolt
Cabify
DiDi Chuxing
Ford Smart Mobility
Grab
Hertz
Lime
Lyft
Ola
Siemens Mobility
Uber Technologies
Zipcar
Zoomcar
관련 조사
데이터와 예측
제1장 소개와 조사 방법
제2장 시장 요약
공유 모빌리티
공유 모빌리티 사용자수
공유 모빌리티 이용 회수
공유 모빌리티 서비스 지출액
제3장 부문 분할
라이드 헤일링
사용자수
서비스 지출액
카셰어링
사용자수
서비스 지출액
전동 스쿠터
사용자수
서비스 지출액
자전거 공유
사용자수
서비스 지출액
MaaS와 공공교통기관
사용자수
서비스 지출액
ksm
영문 목차
영문목차
'Shared Mobility Services to be Adopted by One Quarter of Global Population by 2028'
KEY STATISTICS
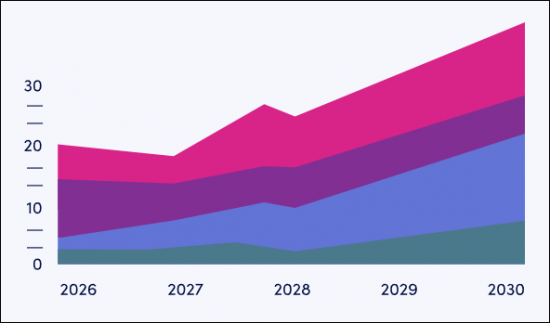
Shared mobility market value globally in 2025:
$104bn
Shared mobility market value globally in 2030:
$205bn
Total shared mobility market value growth between 2025 & 2030:
98%
Forecast period:
2025-2030
Overview
Our "Shared Mobility" Market research suite provides detailed analysis of this rapidly changing market; allowing shared mobility service providers to gain an understanding of key mobility trends and challenges, potential growth opportunities, and the competitive environment.
Providing multiple options which can be purchased separately, the research suite includes access to data mapping the future growth of the shared mobility market. The detailed study reveals the latest opportunities and trends within the market, and an insightful document containing an extensive analysis of 15 shared mobility service providers within the space. Aspects such as public attitudes, multimodal planning capabilities, and challenges to accessibility are explored throughout the report. The coverage can also be purchased as a Full Research Suite, which contains all these elements and includes a substantial discount.
Collectively, these elements provide an effective tool for understanding this rapidly evolving market; allowing shared mobility vendors to set out their future strategies to provide effective and efficient mobility services to their customers. Its unparalleled coverage makes this research suite an incredibly useful resource for gauging the future of this complex market.
Key Features
Market Dynamics: Insights into key mobility trends and market expansion challenges within the shared mobility market. It addresses the challenges posed by fragmentation between public and private sectors, regulatory complexity, maintaining operational costs, and accessibility problems, and also analyses multiple use cases where shared mobility is employed. Furthermore, the research provides a future outlook on the landscape of shared mobility.
Key Takeaways & Strategic Recommendations: In-depth analysis of key development opportunities and findings within the market, accompanied by key strategic recommendations for shared mobility service providers on emerging trends and how the market is expected to evolve.
Benchmark Industry Forecasts: The forecasts include data on shared mobility, split by ride-hailing, car sharing, e-scooter, and bike sharing. This includes metrics such as the number of journeys and distance covered for each segment. The forecast also includes data on Mobility-as-a-Service (MaaS) and public transport, split into consumer and corporate users, revenue, and savings.
Juniper Research Competitor Leaderboard: Key player capability and capacity assessment for 15 shared mobility vendors, via the Juniper Research Competitor Leaderboard; featuring analysis around major players in the shared mobility industry.
SAMPLE VIEW
Market Data & Forecasting Report
The numbers tell you what's happening, but our written report details why, alongside the methodologies.
SAMPLE VIEW
Market Trends & Strategies Report
A comprehensive analysis of the current market landscape, alongside strategic recommendations.
Market Data & Forecasting Report
The market-leading research suite for the "shared mobility" market includes access to the full set of forecast data, consisting of 132 tables and over 60,000 datapoints. Metrics in the research suite include:
Total Volume of Shared Mobility & MaaS Users
Total Spend on Shared Mobility & MaaS Services
Total Number of Shared Mobility & MaaS Journeys
The shared mobility portion of the research suite includes the following metrics:
Total Volume of Shared Mobility Users
Total Spend on Shared Mobility Services
Total Number of Shared Mobility Journeys
Total Distance Covered by Shared Mobility Journeys
These metrics are provided for the following key market verticals:
Ride-hailing
Car sharing
E-scooters
Bike sharing
The MaaS portion of the research suite includes the following metrics:
Total Number of MaaS & MaaS-enabled Public Transport Users
Total Revenue From MaaS & MaaS-enabled Public Transport Users
Total Number of MaaS & MaaS-enabled Public Transport Journeys
These metrics are provided for the following market verticals:
Consumer MaaS Users & Revenue
Corporate MaaS Users & Revenue
Consumer MaaS Savings
Corporate MaaS Savings
Bus & Train Services
The Juniper Research Interactive Forecast Excel contains the following functionality:
Statistics Analysis: Users benefit from the ability to search for specific metrics, displayed for all regions and countries across the data period. Graphs are easily modified and can be exported to the clipboard.
Country Data Tool: This tool allows the user to review metrics for all regions and countries in the forecast period. Users can refine the metrics displayed via the search bar.
Country Comparison Tool: Users can select and compare each of the countries. The ability to export graphs is included in this tool.
What-if Analysis: Here, users can compare forecast metrics against their own assumptions. 5 interactive scenarios.
Market Trends & Strategies Report
This report examines the "shared mobility" market landscape in detail. It assesses different market trends and factors that are shaping the evolution of this diverse market, such as collaboration between public services and private shared mobility providers, the trialling of autonomy in specific markets, and methods of first- and last-mile journey coverage; addressing key vertical and developing challenges, and how vendors should navigate these. As well as looking into shared mobility use cases, it also includes evaluation of the different methods of shared mobility with the highest usage rates, and those which some vendors are experimenting with; in order to assess their viability in this market.
Competitor Leaderboard Report
The Competitor Leaderboard report provides a detailed evaluation and market positioning for 15 leading vendors in the shared mobility solution space. These vendors are positioned as an established leader, leading challenger, or disruptor and challenger based on capacity and capability assessments, which modes of shared mobility they offer, and any technologies which set them apart from their competitors. The 15 vendors consist of:
Bird Global
BlaBlaCar
Bolt
Cabify
DiDi Global
Ford Smart Mobility
Grab
Hertz
Lime
Lyft
Ola
Siemens Mobility
Uber Technologies
Zipcar
Zoomcar
This document is centred around the Juniper Research Competitor Leaderboard; a vendor positioning tool that provides an at-a-glance view of the competitive landscape, backed by a robust methodology.
Table of Contents
Market Trends & Strategies
1. Key Takeaways & Strategic Recommendations
1.1. Key Takeaways
1.2. Strategic Recommendations
2. Market Landscape
2.1. Introduction
2.2. Shared Mobility History
2.3. Why Do We Need Shared Mobility?
2.4. Types of Shared Mobility
2.4.1. Ride-hailing
2.4.2. Micromobility
i. E-scooters
Figure 2.1: Example of Dockless E-scooter Parking Zone
ii. Bike Sharing
Figure 2.2: Example of Docked Bike Sharing Bikes
2.4.3. Ride Sharing
2.4.4. Microtransit & Shuttle Services
i. Microtransit
ii. Shuttle Services
2.4.5. Urban Aerial Mobility
Figure 2.3: An Electric Air Taxi Taking Off
2.5. Public Transport
i. Buses
ii. Bus Rapid Transit (BRT)
iii. Trains
iv. Trams
v. Metro Systems
vi. Ferries
2.6. Mobility-as-a-Service
3. Segment Analysis
3.1. Ride-hailing
3.1.1. Current Status
3.1.2. Recent Developments
3.1.3. Challenges
3.1.4. Future Outlook
Figure 3.1: Total Number of Ride-hailing Service Users (m), Globally, Split by 8 Key Regions, 2025-2030
3.2. Shared Micromobility
3.2.1. Current Status
3.2.2. Recent Developments
3.2.3. Challenges
3.2.4. Future Outlook
Figure 3.2: Total Number of Shared Micromobility Users (m), Globally, Split by Key Regions, 2025-2030
3.3. Ride Sharing
3.3.1. Current Status
3.3.2. Recent Developments
3.3.3. Challenges
3.3.4. Future Outlook
3.4. Urban Aerial Mobility
3.4.1. Current Status
3.4.2. Recent Developments
3.4.3. Challenges
3.4.4. Future Outlook
3.5. Public Transport
3.5.1. Current Status
3.5.2. Recent Developments
3.5.3. Challenges
3.5.4. Future Outlook
3.6. Mobility-as-a-Service
3.6.1. Current Status
Figure 3.3: Total Number of MaaS Users (m), Globally, Split by 8 Key Regions, 2025-2030
3.6.2. Recent Developments
3.6.3. Challenges
3.6.4. Future Outlook
Figure 3.4: Total Number of MaaS & MaaS-enabled Public Transport Users (m), Globally, Split by 8 Key Regions, 2025-2030
4. Country Readiness Index
4.1. Introduction to Country Readiness Index
Figure 4.1: Shared Mobility Country Readiness Index: Regional Definitions
Table 4.2: Juniper Research's Country Readiness Index Scoring Criteria: Shared Mobility
Figure 4.3: Juniper Research's Country Readiness Index: Shared Mobility
Figure 4.4: Shared Mobility Country Readiness Index: Market Segments
4.1.1. Focus Markets
i. Youth-driven Adoption
Figure 4.5: Total Spend on Bike Sharing Services ($m), Split by 8 Key Regions, 2025-2030
ii. Increasing Accessibility to Public Transportation
4.1.2. Growth Markets
i. Potential to Introduce Emerging Forms of Shared Mobility
Figure 4.6: Total Number of Shared Mobility Users (m), Split by Six Growth Markets, 2025-2030
ii. Strong Investment Opportunities
Figure 4.7: Total Spend on Shared Mobility ($m), Split by Six Growth Markets, 2025-2030
4.1.3. Saturated Markets
Figure 4.8: Total Volume of Ride-hailing Users (m), Split by Four Saturated Markets, 2025-2030
4.1.4. Developing Markets
Figure 4.9: Total Spend on Shared Mobility Services ($m), Split by Top Eight Developing Markets, 2025-2030