OTT 비즈니스 메시징 : Infobip, Gupshup, Twilio가 시장 리더로 부상
주요 통계
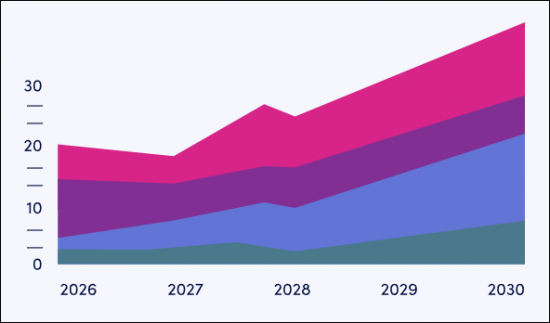
2024년 OTT 비즈니스 메시징 총 수익 :
24억 달러
2029년 OTT 비즈니스 메시징 총 수익 :
98억 달러
2029년 OTT 비즈니스 메시지 총 전송 건수 :
1조 1,000억 통
예측 기간 :
2024-2029년
이 조사 패키지는 기업의 옴니채널 커뮤니케이션 전략에서 OTT 비즈니스 메시징의 역할에 대한 분석과 실용적인 인사이트를 제공하여 CPaaS(Communications Platform-as-a-Service), OTT 메시징 벤더 등 주요 이해관계자들이 이 다양하고 복잡한 시장을 효과적으로 탐색할 수 있도록 돕습니다. WhatsApp, WeChat, Messenger, LINE, Telegram, Viber, KakaoTalk, Zalo 등 광범위한 OTT 비즈니스 메시징 채널을 커버하고 있습니다.
WhatsApp의 가격 개정(메시지 단가, 무료 서비스 메시지, 24시간 고객 서비스 기간 내 유틸리티 메시지 부활), RCS(Rich Communication Service) 비즈니스 메시징의 성장이 OTT 비즈니스 메시징 시장에 미치는 영향 등 OTT 비즈니스 메시징 시장의 최근 동향에 대한 상세한 평가도 포함되어 있습니다. 또한 OTT 비즈니스 메시징 벤더들이 방송 메시지, 채널 메시지, 클릭투채팅 광고 등의 기능을 어떻게 활용할 수 있는지에 대한 전략적 제언과 분석도 제공합니다.
또한 OTT 비즈니스 메시징 벤더들이 대화형 AI 및 챗봇 서비스, 위치 기반 메시징 서비스, 대화형 커머스 서비스, 고객 데이터 플랫폼, 슈퍼앱을 개발하고 수익을 창출하는 방법에 대한 전략적 제안과 분석도 제공합니다.
주요 특징
시장 역학 : WhatsApp의 가격 모델 변경, 클릭 투 채팅 광고 개발, WhatsApp의 국제 인증 비율 확대, AI 챗봇 및 대화형 AI 개발 등 OTT 비즈니스 메시징 시장의 주요 동향과 비즈니스 기회에 대한 인사이트, OTT 비즈니스 메시징 벤더가 대화형 커머스, 채널, 브로드캐스트 메시지, 고객 데이터 플랫폼, 슈퍼앱 수익화 전략을 어떻게 전개하는 것이 가장 좋은지에 대한 전략적 제언과 분석이 포함되어 있습니다.
주요 요점 및 전략적 제언 : OTT 비즈니스 메시징 시장의 주요 개발 기회와 인사이트를 상세히 분석하고, 수익 확대와 서비스 개선을 목표로 하는 OTT 비즈니스 메시징 벤더를 위한 전략적 제언을 담고 있습니다.
벤치마크 산업 예측 : 세계 OTT 비즈니스 메시징 시장의 5년 예측을 제공합니다. 월간 활성 OTT 메시징 사용자 수, 연간 전송된 OTT 메시지 수, 연간 전송된 OTT 비즈니스 메시지 수, OTT 비즈니스 메시징으로 인한 총 수익에 대한 데이터를 제공합니다. 광고, 뱅킹, 컨텐츠 결제, 헬스케어, 리테일, 티켓 판매, 기타로 시장 분야별로 구분하여 제공합니다.
Juniper Research의 Future Leaders'Index : 20개 OTT 비즈니스 메시징 벤더의 역량을 평가하고, 각 벤더가 제공하는 서비스에 대한 시장 규모와 상세한 분석을 제공합니다.
샘플 보기
시장 데이터 및 예측 보고서:
시장 동향 및 전략 보고서:
시장 데이터 및 예측 보고서
이 조사 제품군에는 17,000개 이상의 데이터 포인트로 구성된 예측 데이터세트에 대한 액세스가 포함되어 있습니다. 이 조사 제품군에는 다음과 같은 지표가 포함되어 있습니다.
월별 OTT 메신저 앱 이용자 수
OTT 메시지 발송 건수
OTT 비즈니스 메시지 발송 총량
OTT 비즈니스 메시징으로 인한 총 수익
시장 업종별로는 광고, 은행, 컨텐츠 결제, 헬스케어, 소매, 티켓 판매, 기타 등 다양한 업종을 대상으로 합니다.
Juniper Research의 인터랙티브 예측(Excel)은 다음과 같은 기능을 제공합니다.
통계 분석 : 데이터 기간 동안 전체 지역 및 국가에 대해 표시되는 특정 지표를 검색할 수 있습니다. 그래프를 쉽게 수정하고 클립보드로 내보낼 수 있습니다.
국가별 데이터 도구 : 예측 기간 동안 모든 지역 및 국가의 지표를 볼 수 있습니다. 검색창을 통해 표시되는 지표를 세분화할 수 있습니다.
국가별 비교 도구 : 특정 국가를 선택하여 비교할 수 있습니다. 이 도구에는 그래프 내보내기 기능이 포함되어 있습니다.
What-if 분석 : 3가지 대화형 시나리오를 통해 사용자는 예측의 가정과 비교할 수 있습니다.
목차
시장 동향·전략
제1장 중요 포인트와 전략적 추천사항
중요 포인트
주요 전략적 추천사항
제2장 시장 상황
OTT 비즈니스 메시징의 주요 동향
RCS 비즈니스 메시징 개발이 OTT 비즈니스 메시징 시장에 미치는 영향
WhatsApp : 2025년 4월에 대화형 요금 설정을 종료, 요금 설정 심플함의 중요성을 강조
OTT 채널 선택에 있어 소비자의 통제력이 점점 더 중요해지고 있다.
OTT 비즈니스 메시징의 주요 채널
WhatsApp
WeChat
Messenger
Telegram
LINE
Viber
KakaoTalk
Zalo
제3장 향후 기회와 시장 전략
벤더에 대한 주요 수익화 기회와 전략
챗봇과 LLM
대화형 커머스
클릭 투 채팅 광고
채널과 방송
슈퍼앱
고객 데이터 플랫폼
제4장 국가별 준비 지수
국가별 준비 지수 : 소개
중점 시장
성장 시장
신흥 시장
경쟁 리더보드
제1장 경쟁 리더보드
제2장 벤더 개요
벤더 개요
Bird
Cequens
Clickatell
CM.com
Comviva
GMS
Gupshup
Infobip
LINK Mobility
Monty Mobile
Route Mobile
Soprano Design
Sinch
Syniverse
Tata Communications
Twilio
Vonage
Cisco Webex
Zenvia
Juniper Research 리더보드 평가 방법
제한과 해석
데이터·예측
제1장 소개·조사 방법
제2장 시장 개요·향후 시장 전망
OTT 메시징 사용자 총 수
전송된 OTT 비즈니스 메시지 총 수
OTT 비즈니스 메시징에서 총 매출
OTT 광고 메시지 총 수
OTT 광고 메시지에서 총 매출
OTT 헬스케어 메시지 총 수
OTT 헬스케어 메시지에서 총 매출
OTT 뱅킹 메시지 총 수
OTT 뱅킹 메시지에서 총 매출
OTT 컨텐츠 결제 메시지 총 수
OTT 컨텐츠 결제 메시지에서 총 매출
OTT 티켓 메시지에서 총 매출
OTT 소매 메시지 총 수
OTT 소매 메시지에서 총 매출
ksm
영문 목차
영문목차
'OTT Business Messaging: Infobip, Gupshup, and Twilio Revealed as Market Leaders'
KEY STATISTICS
Total OTT business messaging revenue in 2024:
$2.4bn
Total OTT business messaging revenue in 2029:
$9.8bn
Total number of OTT business messages sent in 2029:
1.1tn
Forecast period:
2024-2029
Overview
Our "OTT (Over the Top) Business Messaging" research suite provides analysis and actionable insights into the role of OTT business messaging in enterprises' omnichannel communications strategies; enabling key stakeholders such as CPaaS (Communications Platform-as-a-Service) and OTT messaging vendors to effectively navigate this diverse and complex market. The suite covers a wide range of OTT business messaging channels, including WhatsApp, WeChat, Messenger, LINE, Telegram, Viber, KakaoTalk, and Zalo.
Included is a detailed assessment of recent developments in the OTT business messaging market, such as WhatsApp's update to its pricing with the return of price per message, free service messages, and utility messages within the 24-hour customer service period, and how the growth of RCS (Rich Communication Services) business messaging will impact the OTT business messaging market. Alongside this it provides strategic recommendations and analysis of how OTT business messaging vendors can capitalise on features such as broadcast and channel messages, and click-to-chat ads.
The report also provides strategic recommendations and analysis of how OTT business messaging vendors can best develop and monetise conversational AI and chatbot services, location-based messaging services, conversational commerce services, customer data platforms, and super apps.
The market forecast suite includes several different options that can be purchased separately, including access to data mapping and a forecast document, a strategy and trends document detailing critical trends in the market, and strategic recommendations for monetising and developing OTT business messaging solutions and services.
The research suite includes a Competitor Leaderboard, which can be purchased separately; containing analysis and market sizing for 20 leading OTT business messaging vendors, who each provide support for one or more OTT messaging channels.
Collectively, the suite provides a critical tool for understanding the OTT business messaging market, which allows OTT business messaging providers, and other stakeholders, to shape their future strategies for service development and monetisation. Its unparalleled coverage makes this research suite an incredibly useful resource for charting the future of a key telecommunications market.
Key Features
Market Dynamics: Insights into the key trends and opportunities within the OTT business messaging market, including the changes to WhatsApp's pricing model, the development of click-to-chat ads, the expansion of international authentication rates by WhatsApp, and the development of AI chatbots and conversational AIs. It also includes strategic recommendations and analysis of how OTT business messaging vendors can best develop strategies for monetising conversational commerce, channels and broadcast messages, customer data platforms, and super apps.
Key Takeaways & Strategic Recommendations: In-depth analysis of key development opportunities and findings within the OTT business messaging market, accompanied by strategic recommendations for OTT business messaging vendors seeking to grow their revenue and improve their offerings.
Benchmark Industry Forecasts: The suite provides five-year forecasts for the global OTT business messaging market; providing data for the total number of monthly active OTT messaging users, total number of OTT messages sent each year, total number of OTT business messages sent each year, and total revenue from OTT business messaging. This is split by the following market verticals: advertising, banking, content payment, healthcare, retail, ticketing, and other.
Juniper Research Future Leaders' Index: Key player capability and capacity assessment for 20 OTT business messaging vendors, with market sizing and detailed analysis for each vendor's offering.
SAMPLE VIEW
Market Data & Forecasting Report:
The numbers tell you what's happening, but our written report details why, alongside the methodologies.
Market Trends & Strategies Report:
A comprehensive analysis of the current market landscape, alongside strategic recommendations.
Market Data & Forecasting Report
The market-leading research suite for the OTT Business Messaging market includes access to the full set of forecast data, comprising more than 17,000 datapoints. Metrics in the research suite include:
Total Number of Monthly Active OTT Messenger App Users
Total Number of OTT Messages Sent
Total Number of OTT Business Messages Sent
Total Revenue from OTT Business Messaging
Market vertical splits are provided for the following market verticals: Advertising, Banking, Content Payment, Healthcare, Retail, Ticketing, and Other.
Juniper Research's Interactive Forecast Excel contains the following functionality:
Statistics Analysis: Users benefit from the ability to search for specific metrics, displayed for all regions and countries across the data period. Graphs are easily modified and can be exported to the clipboard.
Country Data Tool: This tool lets users look at metrics for all regions and countries in the forecast period. Users can refine the metrics displayed via a search bar.
Country Comparison Tool: Users can select and compare specific countries. The ability to export graphs is included in this tool.
What-if Analysis: Here, users can compare forecast metrics against their own assumptions, via three interactive scenarios.
Market Trends & Strategies Report
The report thoroughly examines the global "OTT Business Messaging" market, assessing market trends and factors shaping the evolution of these rapidly growing channels for enterprise communications. Alongside these trends, the report delivers a comprehensive analysis of the strategic business opportunities for OTT business messaging vendors, such as CPaaS providers.
The innovative ecosystem report addresses how OTT business messaging vendors can maximise their revenue from OTT business messaging through the development of omnichannel messaging services, chatbots and conversational AI, channels and broadcast messages, and click-to-chat ads.
The innovative ecosystem report addresses how OTT business messaging vendors can best capitalise on key trends and factors affecting the OTT business messaging market, such as the changes in WhatsApp's pricing strategy and its expansion of free messaging, and the growing use of RCS business messaging by enterprises.
It also includes a Country Readiness Index, which assesses the current and future development of the OTT business messaging market in each of the 60 countries included in the market forecast. This provides detailed insight into which markets will offer the greatest revenue opportunities, both at present and over the next five years, enabling effective strategic planning by stakeholders in the OTT business messaging market.
Competitor Leaderboard Report
The Competitor Leaderboard included in this report provides detailed evaluation and market positioning for 20 OTT business messaging vendors. These key companies are positioned as established leaders, leading challengers, or disruptors and challengers, based on a capacity, capability, and product assessment. This includes analysis of the key advantages in the market, future development plans, and key partnerships.
The OTT business messaging Competitor Leaderboard includes the following key vendors:
Bird
Cequens
Clickatell
CM.com
Comviva
GMS
Gupshup
Infobip
LINK Mobility
Mitto
Monty Mobile
Route Mobile
Soprano Design
Sinch
Syniverse
Tata Communications
Twilio
Vonage
Cisco Webex
Zenvia
Table of Contents
Market Trends & Strategies
1. Key Takeaways & Strategic Recommendations
1.1 Key Takeaways
1.2 Key Strategic Recommendations
2. Market Landscape
2.1. Introduction
2.2 Key Trends in OTT Business Messaging
Figure 2.1: Total Number of OTT Messenger Users (m), Split By 8 Key Regions, 2024-2029
Figure 2.2: Total OTT Business Messaging Revenue ($m), Split By 8 Key Regions, 2024-2029
2.2.2. How the Development of RCS Business Messaging Will Impact the OTT Business Messaging Market
Figure 2.3: RCS Key Features and Capabilities
Figure 2.4: Global Growth in OTT Messenger and RCS Users (m), Split By 8 Key Regions, 2024-2029
2.2.3. WhatsApp to End Conversational Pricing in April 2025, Highlighting Importance of Simplicity in Pricing
2.2.4. Consumer Control Over OTT Channel Selection to be Increasingly Important
2.3 Key Channels for OTT Business Messaging
Figure 2.5: Largest OTT Channel in Each Country
2.3.1. WhatsApp
i. Introduction
Table 2.6: Key WhatsApp Metrics, 2024
ii. Business Messaging Pricing
Table 2.7: Example of Pricing of Different WhatsApp Categories (November 1st 2024)
iii. WhatsApp Messaging Features
Figure 2.8: WhatsApp Chat Button
Figure 2.9: Example of WhatsApp Catalogue
Figure 2.10: WhatsApp Business Directory
Figure 2.11: WhatsApp Pay Example
Figure 2.12: WhatsApp Channels
2.3.2. WeChat
i. Introduction
Table 2.13: WeChat Key Metrics, 2024
Figure 2.14: WeChat Evolution Over the Years
ii. WeChat Business Messaging
2.3.3. Messenger
i. Introduction
Table 2.15: Messenger Key Metrics
ii. Business Messaging
2.4. Telegram
i. Introduction
Table 2.16: Telegram Key Statistics
ii. Business Messaging
Figure 2.17: Telegram Business Chatbots
2.5. LINE
i. Introduction
Table 2.18: Global Line Key Statistics
Figure 2.19: Adding Friends Using LINE Pay
ii. Business Messaging
Table 2.20: Three Different Plans for a LINE Official Account
Figure 2.21: LINE Broadcast Message Example
Figure 2.22: LINE Rich Menu Feature
Figure 2.23: Example of LINE Beacon
2.6. Viber
i. Introduction
Table 2.24: Viber Key Statistics in 2024
ii. Business Messaging
Figure 2.25: Viber Business Messaging Pricing Models
Figure 2.26: Examples of Viber Business Messaging Costs (November 2024)
2.7. KakaoTalk
i. Introduction
Table 2.27: KakaoTalk Key Statistics
ii. Business Messaging
2.8. Zalo
i. Introduction
Table 2.28: Global Zalo Key Statistics in 2024
ii. Business Messaging
3. Future Opportunities and Market Strategies
3.1 Key Monetisable Opportunities and Strategies for Vendors
3.1.1. Chatbots and LLMs
Figure 3.1: Total Number of Messaging Chatbots Accessed per Year (m), Split by 8 key Regions, 2023-2028
3.1.2. Conversational Commerce
Figure 3.2: Total Conversational Commerce Revenue ($m), Split By 8 Key Regions, 2023-2028
3.1.3. Click-to-Chat Ads
Figure 3.3: WhatsApp Click-to-Chat Ad Example
3.1.4. Channels and Broadcasts
Figure 3.4: Example of WhatsApp Channel
3.1.5. Super Apps
Figure 3.5: WeChat Store Example
Figure 3.6: WhatsApp Pay Example
3.1.6. Customer Data Platform
4. Country Readiness Index
4.1. Introduction to Country Readiness Index
Figure 4.1: OTT Business Messaging Country Readiness Index Regional Definitions
Table 4.2: Juniper Research Country Readiness Index Scoring Criteria
Figure 4.3: OTT Business Messaging Country Readiness Index: Market Status 2024
Table 4.4: OTT Business Messaging Country Readiness Index: Market Segments
4.2. Focus Market
Figure 4.5: Select OTT Focus Markets' OTT Messaging Application Penetration Rate (%), 2024-2029
4.2.2. Brazil
Figure 4.6: Total Number of OTT Business Messages Sent in Brazil (bn), 2024-2029
4.2.3. China
Figure 4.7: Total Number of Monthly Active OTT Messaging Users in China (m), 2024-2029
4.2.4. India
Figure 4.8: Total Number of OTT Business Messages Sent in India (bn), 2024-2029
4.2.5. Indonesia
Figure 4.9: Total OTT Business Messaging Revenue in Indonesia ($m), 2024-2029
4.3. Growth Markets
i. The US
Figure 4.10: Total Revenue from OTT Business Messaging in the US ($m), 2024-2029
4.4. Developing Markets
Table 4.11: Juniper Research's Country Readiness Index Heatmap: North America
Table 4.12: Juniper Research's Country Readiness Index Heatmap: Latin America
Table 4.13: Juniper Research's Country Readiness Index Heatmap: West Europe
Table 4.14: Juniper Research's Country Readiness Index Heatmap: Central & East Europe
Table 4.15: Juniper Research's Country Readiness Index Heatmap: Far East & China
Table 4.16: Juniper Research's Country Readiness Index Heatmap: Indian Subcontinent
Table 4.17: Juniper Research's Country Readiness Index Heatmap: Rest of Asia Pacific
Table 4.18: Juniper Research's Country Readiness Index Heatmap: Africa & Middle East
Competitor Leaderboard
1. Competitor Leaderboard
1.1. Why Read This Report
Table 1.1: Juniper Research Competitor Leaderboard Vendors and Product Portfolios (One)
Table 1.2: Juniper Research Competitor Leaderboard Vendors and Product Portfolios (Two)
Figure 1.3: Juniper Research Competitor Leaderboard: OTT Business Messaging
Table 1.4: Juniper Research Competitor Leaderboard: OTT Business Messaging Vendors & Positioning
Table 1.5: Juniper Research Competitor Leaderboard Heatmap: OTT Business Messaging (1 of 2)
Table 1.6: Juniper Research Competitor Leaderboard Heatmap: OTT Business Messaging (2 of 2)
2. Vendor Profiles
2.1. Vendor Profiles
2.1.1. Bird
i. Corporate Information
ii. Geographical Spread
iii. Key Clients & Strategic Partnerships
iv. High-level View of Offerings
v. Juniper Research's View: Key Strengths & Strategic Development Opportunities
2.1.2. Cequens
i. Corporate Information
Table 2.1: Cequens' Acquisitions Since 2016
ii. Geographical Spread
iii. Key Clients & Strategic Partnerships
iv. High-level View of Offerings
v. Juniper Research's View: Key Strengths & Strategic Development Opportunities
2.1.3. Clickatell
i. Corporate Information
ii. Geographical Spread
iii. Key Clients & Strategic Partnerships
iv. High-level View of Offerings
v. Juniper Research's View: Key Strengths & Strategic Development Opportunities
2.1.4. CM.com
i. Corporate Information
Table 2.2: CM.com's Select Financial Information (Euro-m), 2022-2023
ii. Geographical Spread
iii. Key Clients & Strategic Partnerships
iv. High-level View of Offerings
v. Juniper Research's View: Key Strengths & Strategic Development Opportunities
2.1.5. Comviva
i. Corporate Information
Table 2.3: Comviva's Select Financial Information ($m), 2021-2023
ii. Geographical Spread
iii. Key Clients & Strategic Partnerships
iv. High-level View of Offerings
v. Juniper Research's View: Key Strengths & Strategic Development Opportunities
2.1.6. GMS
i. Corporate Information
ii. Geographical Spread
iii. Key Clients & Strategic Partnerships
iv. High-level View of Offerings
v. Juniper Research's View: Key Strengths & Strategic Development Opportunities
2.1.7. Gupshup
i. Corporate Information
ii. Geographical Spread
iii. Key Clients & Strategic Partnerships
iv. High-level View of Offerings
v. Juniper Research's View: Key Strengths & Strategic Development Opportunities
2.1.8. Infobip
i. Corporate Information
Table 2.4: Infobip's Acquisitions - April 2021 to Present
ii. Geographical Spread
iii. Key Clients & Strategic Partnerships
iv. High-level View of Offerings
v. Juniper Research's View: Key Strengths & Strategic Development Opportunities
2.1.9. LINK Mobility
Table 2.5: LINK Mobility Select Financial Information (NOK 000)
i. Juniper Research's View: Key Strengths & Strategic Development Opportunities
2.1.10. Mitto
i. Corporate Information
ii. Geographical Spread
iii. Key Clients & Strategic Partnerships
iv. High-level View of Offerings
v. Juniper Research's View: Key Strengths & Strategic Development Opportunities
2.1.11. Monty Mobile
i. Corporate Information
ii. Geographical Spread
iii. Key Clients & Strategic Partnerships
iv. High-level View of Offerings
v. Juniper Research's View: Key Strengths & Strategic Development Opportunities
2.1.12. Route Mobile
i. Corporate Information
Table 2.6: Route Mobile Total Consolidated Revenue (Indian Rupee), 2021-2023
ii. Geographical Spread
iii. Key Clients & Strategic Partnerships
iv. High-level View of Offerings
Figure 2.7: How OmniCent Works
v. Juniper Research's View: Key Strengths & Strategic Development Opportunities
2.1.13. Soprano Design
i. Corporate Information
Table 2.8: Soprano Design Acquisitions Since 2020
ii. Geographical Spread
Figure 2.9: Soprano Design Global Reach and Support Network
iii. Key Clients & Strategic Partnerships
Figure 2.10: Soprano Design Global Carrier Partners
iv. High-level View of Offerings
v. Juniper Research's View: Key Strengths & Strategic Development Opportunities
2.1.14. Sinch
i. Corporate Information
Table 2.11: Sinch Select Financial Information ($m), 2021-2023
ii. Geographical Spread
iii. Key Clients & Strategic Partnerships
iv. High-level View of Offerings
v. Juniper Research's View: Key Strengths & Strategic Development Opportunities
2.1.15. Syniverse
Figure 2.12: Syniverse CPaaS Channels
i. Juniper Research's View: Key Strengths & Strategic Development Opportunities
2.1.16. Tata Communications
i. Corporate Information
Table 2.13: Tata Communications' Select Financial Information (Indian Rupee in crore), FY 2022-23 & FY 2023-24
ii. Geographical Spread
iii. Key Clients & Strategic Partnerships
iv. High-level View of Offerings
Figure 2.14: Tata Communications Kaleyra Chatbots
v. Juniper Research's View: Key Strengths & Strategic Development Opportunities
2.1.17. Twilio
i. Corporate Information
Table 2.15: Twilio's Revenue ($m), 2021-2023
Table 2.16: Twilio Acquisitions, 2020 to Present
ii. Geographical Spread
iii. Key Clients & Strategic Partnerships
iv. High-level View of Offerings
Figure 2.17: Twilio Programmable Messaging APIs
v. Juniper Research's View: Key Strengths & Strategic Development Opportunities
2.1.18. Vonage
i. Corporate Information
ii. Geographical Spread
iii. Key Clients & Strategic Partnerships
iv. High-level View of Offerings
v. Juniper Research's View: Key Strengths & Strategic Development Opportunities
2.1.19. Cisco Webex
i. Corporate Information
Table 2.18: Cisco's Financial Information ($m), 2021-2023
ii. Geographical Spread
iii. Key Clients & Strategic Partnerships
iv. High-level View of Offerings
Figure 2.19: Cisco Low-code Flow Builder
v. Juniper Research's View: Key Strengths & Strategic Development Opportunities
2.1.20. Zenvia
i. Corporate Information
Figure 2.20: Select Financial Information Zenvia Financial Year 2022 to Financial Year 2023 (BRL Million)
ii. Geographical Spread
iii. Key Clients & Strategic Partnerships
iv. High-level View of Offerings
v. Juniper Research's View: Key Strengths & Strategic Development Opportunities
2.2. Juniper Research Leaderboard Assessment Methodology
2.3. Limitations & Interpretations
Table 2.21: Juniper Research Competitor Leaderboard: Global OTT Business Messaging Market, 2024-2029
Data & Forecasting
1. Introduction and Methodology
1.1. Introduction
Figure 1.1: Proportion of Smartphone Users Using OTT Messaging Applications (%), 2024-2029
1.2. Forecast Methodology
Figure 1.2: OTT Business Messaging Forecast Methodology
2. Market Summary and Future Market Outlook
2.1. Total Number of OTT Messaging Users
Figure & Table 2.1: Total Number of OTT Messaging Users (m), Split By 8 Key Regions, 2024-2029
2.2. Total Number of OTT Business Messages Sent
Figure & Table 2.2: Total Number of OTT Business Messages Sent (m), Split By 8 Key Regions, 2024-2029
2.3. Total Revenue from OTT Business Messaging
Figure & Table 2.3: Total Revenue from OTT Business Messaging ($m), Split By 8 Key Regions, 2024-2029
2.4. Total Number of OTT Advertising Messages
Figure & Table 2.4: Total Number of OTT Advertising Messages (m), Split By 8 Key Regions, 2024-2029
2.5. Total Revenue from OTT Advertising Messages
Figure & Table 2.5: Total Revenue from OTT Advertising Messages ($m), Split By Key Regions, 2024-2029
2.6. Total Number of OTT Healthcare Messages
Figure & Table 2.6: Total Number of OTT Healthcare Messages (m), Split By 8 Key Regions, 2024-2029
2.7. Total Revenue from OTT Healthcare Messages
Figure & Table 2.7: Total Revenue from OTT Healthcare Messages ($m), Split By 8 Key Regions, 2024-2029
2.8. Total Number of OTT Banking Messages
Figure & Table 2.8: Total Number of OTT Banking Messages (m), Split By 8 Key Regions, 2024-2029
2.9. Total Revenue from OTT Banking Messages
Figure & Table 2.9: Total Revenue from OTT Banking Messages ($m), Split By 8 Key Regions, 2024-2029
2.10. Total Number of OTT Content Payment Messages
Figure & Table 2.10: Total Number of OTT Content Payment Messages (m), Split By 8 Key Regions, 2024-2029
2.11. Total Revenue from OTT Content Payment Messages
Figure & Table 2.11: Total Revenue from OTT Content Payment Messages ($m), Split By 8 Key Regions, 2024-2029
2.12. Total Revenue from OTT Ticketing Messages
Figure & Table 2.12: Total Revenue from OTT Ticketing Messages ($m), Split By 8 Key Regions, 2024-2029
2.13. Total Number of OTT Retail Messages
Figure & Table 2.13: Total Number of OTT Retail Messages (m), Split By 8 Key Regions, 2024-2029
2.14. Total Revenue from OTT Retail Messages
Figure & Table 2.14: Total Revenue from OTT Retail Messages ($m), Split By 8 Key Regions, 2024-2029