라스트 마일 배송용 자동차 시장 : 시장 기회, 성장 촉진요인, 산업 동향 분석, 예측(2025-2034년)
Last Mile Delivery Vehicle Market Opportunity, Growth Drivers, Industry Trend Analysis, and Forecast 2025 - 2034
상품코드:1858817
리서치사:Global Market Insights Inc.
발행일:2025년 10월
페이지 정보:영문 209 Pages
라이선스 & 가격 (부가세 별도)
ㅁ Add-on 가능: 고객의 요청에 따라 일정한 범위 내에서 Customization이 가능합니다. 자세한 사항은 문의해 주시기 바랍니다.
한글목차
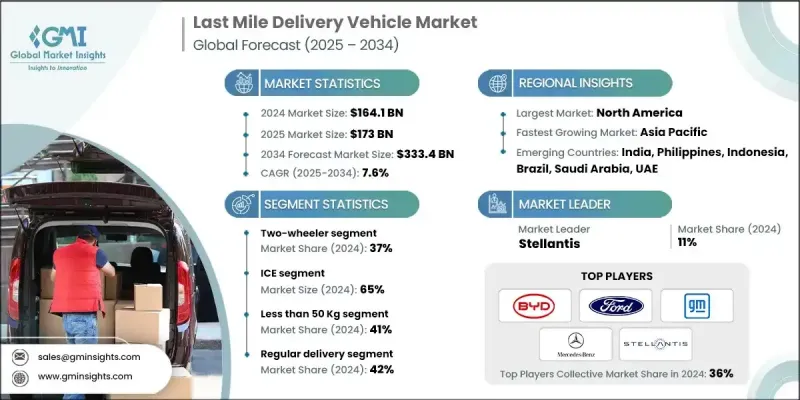
세계의 라스트 마일 배송용 자동차 시장 규모는 2024년 1,641억 달러로 평가되었고, CAGR 7.6%로 성장할 전망이며, 2034년에는 3,334억 달러에 이를 것으로 예측됩니다.
전자상거래 활동의 활성화, 밀집한 도시화, 신속한 배달에 대한 수요 증가가 시장의 양상을 일변시키고 있습니다. 소형 트럭, 소형 상용 밴, 삼륜차, 화물용 이륜차 등의 차량은 서비스 제공업체가 배송 속도를 높이고 교통을 탐색하며 연료 및 유지 보수 비용을 줄이는 데 도움이 됩니다. 실시간 차량 추적, 고급 텔레매틱스 및 예측 유지 보수는 운영자가 성능을 최적화하는 중요한 도구입니다. 전략적으로 배치된 급유 스테이션과 저장소 허브는 또한 차량 가동률을 향상시키고 유휴 시간을 최소화합니다. 소비자의 행동이 더 빠르고 유연한 선택을 선호하는 동안, 시장 기업들은 도심과 교외에서 똑같이 증가하는 물류에 대한 기대에 부응하기 위해 신속하게 적응하고 있습니다.
시장 범위
시작 연도
2024년
예측 연도
2025-2034년
시장 규모
1,641억 달러
예측 금액
3,334억 달러
CAGR
7.6%
팬데믹(세계적 유행)에 의해 제조업이 혼란했음에도 불구하고, 온라인 소매의 급증에 의해 배송 차량에 대한 투자가 급증하고 있습니다. 유연성과 운영의 신뢰성을 확보하기 위해 구독 기반 임대, 원격 진단 및 차량 공유 솔루션이 기세를 늘리고 있습니다. 헬스케어, 식품, 식료품 및 전자상거래의 배송 수요 증가는 소형 배송 차량의 보급을 뒷받침하고 있습니다. 사업자와 OEM은 현재 IoT 플랫폼, 마이크로모빌리티 혁신, 지능형 플릿 시스템을 통합하여 물류를 간소화하고 도시 교통 전략을 지원합니다.
이륜차 부문은 2024년에 37%의 점유율을 차지하였고, 2034년까지 CAGR 6.8%로 성장이 예측되고 있습니다. 이 차량은 합리적인 가격, 교통 혼잡에서 신속한 내비게이션 및 낮은 운영 비용으로 널리 사용됩니다. 식품 배달, 소포 물류, 식료품 유통에 종사하는 기업들은 근거리 이동에 자전거와 스쿠터를 계속 선호하고 있습니다. 아시아태평양과 같은 지역에서는 비용 이점이 있으며 조종이 용이하기 때문에 오토바이 스쿠터가 우위를 유지하고 있습니다. 전동 유형이 인기를 끌고 있기 때문에 사업자는 플릿 전체에서 지속가능성 및 저배출 가스를 우선하고 있습니다.
내연기관(ICE) 부문은 2024년에 65%의 점유율을 차지하였고, 2034년까지 CAGR 7.1%로 성장이 예상됩니다. 이 차량은 항속 거리의 길이, 빠른 연료 보급 및 강력한 적재 능력으로 함대 사업자에게 계속 지지를 받고 있습니다. ICE 모델은 널리 이용 가능하며 세계적인 인프라에 지원되기 때문에 특히 충전 네트워크가 제한된 지역에서 대량의 일상 배송에 이상적입니다.
정기 배송 서비스 부문은 2024년에 42%의 점유율을 차지했습니다. 이 부문에는 소포, 식료품, 일용품과 같은 일상적인 물류가 포함됩니다. 정기적 인 수요, 예측 가능한 배송 경로 및 정기 배송에 대한 소비자의 광범위한 신뢰는 이 부문에서 꾸준한 성장의 원동력이 되고 있습니다. 기업은 비용 효율적이고 루트 계획을 세우기 쉬운 정기 배송 일정을 선호하기 때문에 이 부문은 차량 활용의 최전선이 되고 있습니다.
미국의 라스트 마일 배송용 자동차 시장은 2024년 535억 달러를 창출해, 85%의 점유율을 차지했습니다. 그 리더십은 개발된 전자상거래 생태계와 녹색 운송에 대한 투자 증가로 지원됩니다. 주요 물류업체는 지속 가능한 배송 전략의 일환으로 전기 밴, 카고 자전거, 전자 트라이크를 적극적으로 도입하고 있습니다. EV에 대한 세제 우대조치와 보조금 제도를 포함한 정부 정책은 차량의 전동화를 가속화하고 ICE에서 전동 모델로의 전환을 사업자에게 촉구하고 있습니다.
세계의 라스트 마일 배송용 자동차 산업에서 활약하는 주요 기업은 Tata Motors, Mercedes-Benz, GreenPower Motor, Stellantis, Rivian, General Motors, Mahindra Electric, Ford, Xos, BYD를 포함합니다. 라스트 마일 배송용 자동차 시장에서 보다 견고한 발판을 확보하기 위해 기업은 전기화, 디지털화, 유연한 비즈니스 모델의 조합에 주력하고 있습니다. 차량 운행을 최적화하기 위해 배터리 기술, 실시간 차량 인텔리전스 및 커넥티드 플랫폼에 대한 전략적 투자가 이루어지고 있습니다. 대기업은 단거리 배송용으로 설계된 전용 EV를 전개하는 한편, 물류기업과 제휴해 시험적인 도입을 진행하고 있습니다. 텔레매틱스 시스템은 예측 유지 보수 및 경로 최적화를 위해 통합되고 있습니다. 확장 가능하고 저비용 배송 서비스 진입을 목표로 하는 중소기업과 기그 이코노미의 드라이버를 끌어들이기 위해서, 구독 모델이나 차량 리스 플랜도 도입되고 있습니다.
목차
제1장 조사 방법
시장 범위 및 정의
조사 디자인
조사 접근
데이터 수집 방법
데이터 마이닝 정보원
세계
지역 및 국가
기본 추정 및 계산
기준 연도의 산출
시장 추계의 주요 동향
1차 조사 및 검증
1차 정보
예측 모델
조사의 전제조건 및 한계
제2장 주요 요약
제3장 업계 인사이트
생태계 분석
공급자의 상황
이익률 분석
비용 구조
각 단계에서의 부가가치
밸류체인에 영향을 주는 요인
혁신
업계에 미치는 영향요인
성장 촉진요인
전자상거래 및 당일 배송의 성장
정부의 인센티브 및 도시의 저배출 정책
도시 인구 증가 및 교통 정체
배터리 기술 및 급속 충전 솔루션의 진보
업계의 잠재적 위험 및 과제
차량과 인프라에 대한 높은 초기 투자
제한된 충전 인프라 및 차량 항속 거리 제한
시장 기회
전동화 및 하이브리드차 도입 증가
커넥티드 플릿 관리 솔루션의 급증
아시아태평양 및 라틴아메리카와 같은 신흥 시장에서의 수요 증가
물류 공급자 및 OEM 간의 지속가능성을 중시한 파트너십 증가
성장 가능성 분석
규제 상황
북미
유럽
아시아태평양
라틴아메리카
중동 및 아프리카
Porter's Five Forces 분석
PESTEL 분석
기술 및 혁신의 전망
현재의 기술 동향
신흥 기술
가격 동향
지역별
제품별
생산 통계
생산 거점
소비 거점
수출입
코스트 내역 분석
특허 분석
지속가능성 및 환경 측면
지속가능한 대처
폐기물 감축 전략
생산에서의 에너지 효율
환경 친화적인 노력
탄소발자국의 고려
시장 도입 통계
전기배송차 도입률
플릿전화의 진전
충전 인프라 개발
기술적 특징의 채용
지역별 채용 패턴
고객 만족도 지표
업무 퍼포먼스 측정
전자상거래 및 배송 시장의 통합
온라인 소매 성장 임팩트
라스트 마일 배송용 자동차 수요 분석
배송 속도 및 효율성 요건
고객의 기대의 진화
피크 시즌 수요 관리
도시 배송 밀도의 최적화
지속가능성에 관한 소비자의 기호
투자 환경 분석
자동차 제조업체의 투자
플릿 오퍼레이터의 자본 배분
정부의 인프라 자금 조달
프라이빗 충전 네트워크에 대한 투자
배달 기술의 벤처 캐피탈
투자 유형별 ROI 분석
그린본드 및 지속가능한 자금 조달
고객 행동 분석
플릿 오퍼레이터의 의사 결정 요인
차량 선택 기준
기술 도입의 기호
총소유 비용 우선순위
서비스 및 지원 요건
지속가능성에 대한 헌신의 영향
지역에 의한 기호의 차이
비즈니스 모델의 진화
종래의 자동차 판매 모델
VaaS 모델
임대 및 금융 솔루션
통합 플릿 솔루션
CaaS(Charging As A Service) 모델
퍼포먼스 기반의 계약
성능 및 품질 기준
상용차의 성능 지표
배터리 성능 및 내구성
충전 속도 및 효율
신뢰성 및 가용성 기준
안전 및 보안 요건
환경 성능 기준
리스크 평가의 틀
기술 도입 위험
배터리 성능 및 열화 위험
충전 인프라 이용 가능성 위험
규제 준수 위험
시장 수요 변동
공급망의 혼란 위험
경쟁 기술 위험
제4장 경쟁 구도
서문
기업의 시장 점유율 분석
북미
유럽
아시아태평양
라틴아메리카
중동 및 아프리카
주요 시장 기업의 경쟁 분석
경쟁 포지셔닝 매트릭스
전략적 전망 매트릭스
주요 발전
합병 및 인수
파트너십 및 협업
신제품 발표
확장 계획 및 자금 조달
제5장 시장 추계 및 예측 : 차량별(2021-2034년)
주요 동향
이륜차
오토바이 및 자전거
스쿠터
이륜차
삼륜차
오토리키샤
삼륜차
경상용 삼륜차
사륜차
소형 상용차
소형 상용차(LCV)
중형 상용차
특수 사륜차
마이크로 모빌리티
퍼스널 모빌리티
카고 마이크로 모빌리티
제6장 시장 추계 및 예측 : 최종 용도별(2021-2034년)
주요 동향
물류 및 운송 서비스
소매 및 전자상거래 기업
외식 산업
헬스케어 및 제약 업계
정부 및 공공 서비스
유틸리티 및 필드 서비스
기타
제7장 시장 추계 및 예측 : 페이로드 용량별(2021-2034년)
주요 동향
50Kg 미만
50-500 Kg
500-1500 Kg
1500Kg 이상
제8장 시장 추계 및 예측 : 배송 모드별(2021-2034년)
주요 동향
정기 배송
당일 배송
익스프레스
제9장 시장 추계 및 예측 : 추진력별(2021-2034년)
주요 동향
ICE
전기
하이브리드
제10장 시장 추계 및 예측 : 지역별(2021-2034년)
주요 동향
북미
미국
캐나다
유럽
독일
영국
프랑스
이탈리아
스페인
러시아
북유럽 국가
아시아태평양
중국
인도
일본
호주
한국
필리핀
인도네시아
라틴아메리카
브라질
멕시코
아르헨티나
중동 및 아프리카
남아프리카
사우디아라비아
아랍에미리트(UAE)
제11장 기업 프로파일
세계 기업
Arrival Limited
BYD
Ford
General Motors
GreenPower Motor Company
Mercedes-Benz
Nissan
Rivian
Stellantis
Workhorse
지역 기업
Bollinger Motors
Canoo
Chanje Energy
Isuzu Motors
Lightning eMotors
Mahindra Electric
Renault
Tata Motors
Volkswagen
신흥 기업
Alke
Cenntro Electric
Einride
Goupil
SEA Electric
StreetScooter
Tevva Motors
Volta Trucks
Xos
AJY
영문 목차
영문목차
The Global Last Mile Delivery Vehicle Market was valued at USD 164.1 billion in 2024 and is estimated to grow at a CAGR of 7.6% to reach USD 333.4 billion by 2034.
Rising e-commerce activity, dense urbanization, and increasing demand for rapid delivery are transforming the market landscape. Vehicles like small trucks, light commercial vans, three-wheelers, and cargo two-wheelers are helping service providers enhance delivery speed, navigate traffic, and cut down on fuel and maintenance costs. Real-time vehicle tracking, advanced telematics, and predictive maintenance are key tools operators are turning to for optimizing performance. Strategically located refueling stations and depot hubs are also improving vehicle utilization and minimizing idle time. With consumer behavior favoring faster and more flexible options, market players are adapting quickly to meet growing logistics expectations in city centers and suburban areas alike.
Market Scope
Start Year
2024
Forecast Year
2025-2034
Start Value
$164.1 Billion
Forecast Value
$333.4 Billion
CAGR
7.6%
Despite manufacturing disruptions during the pandemic, the surge in online retail has sharply increased investments in delivery vehicle fleets. Subscription-based leasing, remote diagnostics, and fleet-sharing solutions are gaining momentum to ensure flexibility and operational reliability. Growing demand for healthcare, food, grocery, and e-commerce deliveries has driven the widespread use of compact delivery vehicles. Operators and OEMs are now embedding IoT platforms, micro-mobility innovations, and intelligent fleet systems to streamline logistics and support urban transportation strategies.
The two-wheeler segment held a 37% share in 2024 and is projected to grow at a CAGR of 6.8% through 2034. These vehicles are widely used due to their affordability, quick navigation in traffic, and low operating costs. Businesses involved in food delivery, parcel logistics, and grocery distribution continue to favor bikes and scooters for short-distance trips. In regions like Asia Pacific, they remain dominant due to cost advantages and easier maneuverability. With electric variants gaining traction, operators are also prioritizing sustainability and low emissions across fleets.
The internal combustion engines (ICE) segment held a 65% share in 2024 and is expected to grow at a CAGR of 7.1% through 2034. These vehicles remain favored by fleet operators thanks to their longer range, quick refueling, and strong payload capacity. ICE models are widely available and supported by global infrastructure, making them ideal for high-volume daily deliveries, especially in areas with limited charging networks.
The regular delivery services segment accounted for a 42% share in 2024. This segment includes routine logistics such as parcels, groceries, and household items. Its steady growth is driven by recurring demand, predictable delivery routes, and widespread consumer reliance on scheduled shipments. Companies prefer regular delivery schedules for their cost-effectiveness and easier route planning, keeping the segment at the forefront of vehicle utilization.
U.S. Last Mile Delivery Vehicle Market generated USD 53.5 billion in 2024 and held an 85% share. Its leadership is supported by a well-developed e-commerce ecosystem and increasing investment in green transportation. Major logistics providers are actively deploying electric vans, cargo bikes, and e-trikes as part of sustainable delivery strategies. Government policies, including tax breaks and grant programs for EVs, are accelerating fleet electrification and encouraging operators to transition from ICE to electric models.
Key players active in the Global Last Mile Delivery Vehicle Industry include Tata Motors, Mercedes-Benz, GreenPower Motor, Stellantis, Rivian, General Motors, Mahindra Electric, Ford, Xos, and BYD. To secure a stronger foothold in the last mile delivery vehicle market, companies are focusing on a mix of electrification, digitalization, and flexible business models. Strategic investments are being made in battery technology, real-time vehicle intelligence, and connected platforms to optimize fleet operations. Leading manufacturers are rolling out purpose-built EVs designed for short-haul deliveries, while also partnering with logistics firms for pilot deployments. Telematics systems are being integrated for predictive maintenance and route optimization. Subscription models and vehicle leasing plans are also being introduced to attract SMEs and gig-economy drivers looking for scalable, low-cost entry into delivery services.
Table of Contents
Chapter 1 Methodology
1.1 Market scope and definition
1.2 Research design
1.2.1 Research approach
1.2.2 Data collection methods
1.3 Data mining sources
1.3.1 Global
1.3.2 Regional/Country
1.4 Base estimates and calculations
1.4.1 Base year calculation
1.4.2 Key trends for market estimation
1.5 Primary research and validation
1.5.1 Primary sources
1.6 Forecast model
1.7 Research assumptions and limitations
Chapter 2 Executive Summary
2.1 Industry 3600 synopsis, 2021 - 2034
2.2 Key market trends
2.2.1 Regional
2.2.2 Vehicle
2.2.3 Payload Capacity
2.2.4 End Use
2.2.5 Delivery Mode
2.2.6 Propulsion
2.3 TAM Analysis, 2025-2034
2.4 CXO perspectives: Strategic imperatives
2.4.1 Executive decision points
2.4.2 Critical success factors
2.5 Future outlook and strategic recommendations
Chapter 3 Industry Insights
3.1 Industry ecosystem analysis
3.1.1 Supplier landscape
3.1.2 Profit margin analysis
3.1.3 Cost structure
3.1.4 Value addition at each stage
3.1.5 Factor affecting the value chain
3.1.6 Disruptions
3.2 Industry impact forces
3.2.1 Growth drivers
3.2.1.1 Growth of e-commerce & same-day deliveries
3.2.1.2 Government incentives & urban low-emission policies
3.2.1.3 Urban population growth & traffic congestion
3.2.1.4 Advancements in battery technology and fast-charging solutions.
3.2.2 Industry pitfalls & challenges
3.2.2.1 High initial investment in vehicles and infrastructure.
3.2.2.2 Limited charging infrastructure and restricted vehicle range.
3.2.3 Market opportunities
3.2.3.1 Rise in electrification and hybrid vehicle adoption.
3.2.3.2 Surge in connected fleet management solutions.
3.2.3.3 Rise in demand from emerging markets like Asia-Pacific and Latin America.
3.2.3.4 Increase in sustainability-focused partnerships between logistics providers and OEMs.