Vans Market Opportunity, Growth Drivers, Industry Trend Analysis, and Forecast 2026 - 2035
상품코드:1892874
리서치사:Global Market Insights Inc.
발행일:2025년 12월
페이지 정보:영문 225 Pages
라이선스 & 가격 (부가세 별도)
ㅁ Add-on 가능: 고객의 요청에 따라 일정한 범위 내에서 Customization이 가능합니다. 자세한 사항은 문의해 주시기 바랍니다.
한글목차
세계의 밴 시장은 2025년에 3,253억 달러로 평가되었으며, 2035년까지 CAGR 7.3%로 성장하여 6,501억 달러에 달할 것으로 예측됩니다.
이 시장에는 물류, 의료, 접객, 정부 업무, E-Commerce 등 다양한 활동을 지원하는 소형 상용차, 화물 밴, 승용 밴이 포함됩니다. 기업들은 유연하고 비용 효율적인 이동 수단으로 이러한 차량에 의존하고 있으며, 차량 텔레매틱스, 커넥티비티, 데이터 기반 관리 시스템의 발전으로 업무 성과가 변화하고 있습니다. 전기밴은 초기 투자비용이 높지만 에너지 비용과 유지보수 비용이 낮기 때문에 차량에 점점 더 유리한 선택이 되고 있습니다. 시장의 진화는 규제 압력, 변화하는 고객 기대치, 차량 기술의 발전에 의해 형성되고 있습니다. 급속한 전동화, 자율주행 시스템과 커넥티드 시스템의 통합 확대, 라스트 마일 배송 네트워크의 변화 등의 트렌드가 제품 개발 및 차량 전략에 큰 영향을 미치고 있습니다. 지속가능성 목표, 정부 인센티브, 운영 효율성에 대한 강조는 세계 시장에서 전기 밴 플랫폼으로의 전환을 가속화하고 있습니다.
시장 범위
시작 연도
2025년
예측 연도
2026-2035
시작 가치
3,253억 달러
예측 금액
6,501억 달러
CAGR
7.3%
소형 상용 밴 카테고리는 2025년 47%의 점유율을 차지했으며, 2026년부터 2035년까지 연평균 7.6%의 성장률을 기록할 것으로 전망됩니다. 이 밴은 일반적으로 총 중량(GVWR)이 6,000-1만 파운드 범위에 속하며, 연비 효율성, 적재 능력, 조작성의 실용적인 균형을 제공하여 밀집된 도시 지역에서의 주행에 적합합니다. 리비안, 포드 모터, 메르세데스, GM 등 주요 제조업체들은 배송 및 서비스 용도에 특화된 신형 전기자동차를 잇달아 출시하며 이 부문의 전동화 전환을 강력하게 추진하고 있습니다.
전륜구동(FWD) 차량 부문은 2025년 59%의 점유율을 차지했으며, 2035년까지 연평균 7.2%의 성장이 예상됩니다. 그 매력은 제조 비용 절감, 연비 효율성 향상, 포장 도로에서의 견인력 강화, 사용 가능한 화물 공간을 확대하는 최적화된 실내 레이아웃 등의 장점에서 비롯됩니다. 이러한 장점으로 인해 FWD 구성은 특히 도시 및 교외 지역에서의 비용 관리와 효율적인 이동을 중시하는 배송 차량 및 서비스 사업자에게 최적의 선택이 될 수 있습니다.
중국 밴 시장은 2025년 39%의 점유율을 차지했으며, 증가하는 차량 수요, 광범위한 국내 생산능력, 전기 소형 상용차 보급 가속화에 힘입어 성장세를 이어갈 것입니다. 이 나라의 물류, 서비스, 배송 부문은 소규모 사업자부터 대규모 차량 사업자를 대상으로 다목적 밴 모델의 보급을 추진하고 있습니다. 청정 차량을 촉진하는 정책적 조치, 충전 네트워크에 대한 투자, 배출가스 기준 강화로 인해 차량의 전기화가 가속화되고 있으며, 기업들이 저공해 밴으로 교체하도록 동기를 부여하고 있습니다.
목차
제1장 조사 방법
제2장 주요 요약
제3장 업계 인사이트
생태계 분석
공급업체 상황
이익률 분석
비용 구조
각 단계의 부가가치
밸류체인에 영향을 미치는 요인
디스럽션
업계에 대한 영향요인
성장 촉진요인
E-Commerce 확대와 라스트 마일 배송 수요 증가
도시화와 인프라 정비 진전
전기자동차 및 저배출 가스 밴으로의 전환
중소기업 성장
플릿 관리와 안전성의 기술적 진보
업계의 잠재적 리스크와 과제
전기자동차 및 첨단 밴의 높은 초기 비용
지역별 복잡한 규제
시장 기회
전기 밴 보급 확대
E-Commerce 배송의 수요 증가
신흥 시장의 확대
스마트한 차량 관리 기술의 도입
성장 가능성 분석
규제 상황
북미
미국 : 연방 자동차 안전 기준(FMVSS)
캐나다 : 캐나다 자동차 안전 기준(CMVSS)
유럽
독일 : EU 형식 승인 규정 (EU) 2018/858
영국 : GB 형식 인증 (브렉시트 이후 UNECE 규정)
프랑스 : EU 밴용 CO2 배출 성능 기준 (EU 규정) 2019/631
이탈리아 : EU 완성차 형식 인증 (WVTA) 프레임워크
아시아태평양
중국 : 중국 강제성 제품 안전 감독 관리 제도(CCC)-GB 규격
인도 : 바라트 스테이지(BS) VI 배기 가스 규제
일본 : 국토교통성(MLIT) 형식 인증
한국 : 한국 자동차 안전 기준(KMVSS)
라틴아메리카
브라질 : CONTRAN 차량 인증(환경·기술 분석)
멕시코 : NOM(Norma Oficial Mexicana) 안전·배출 기준
중동 및 아프리카
사우디아라비아 : SASO(사우디 규격·계량·품질 기구) 기술 규제
Porters 분석
PESTEL 분석
기술과 혁신 동향
현재 기술 동향
신기술
가격 동향
지역별
제품별
생산 통계
생산 거점
소비 거점
수출입
비용 내역 분석
제조 비용 구조
연구개발비 분석
규제 준수 비용
유통·물류 비용
마케팅·판매 비용
특허 분석
지속가능성과 환경면
지속가능한 대처
폐기물 절감 전략
생산의 에너지 효율
친환경적인 대처
탄소발자국에 관한 고려사항
향후 전망과 기회
제4장 경쟁 구도
소개
기업의 시장 점유율 분석
북미
유럽
아시아태평양
라틴아메리카
중동 및 아프리카
주요 시장 기업 경쟁 분석
경쟁 포지셔닝 매트릭스
전략적 전망 매트릭스
주요 발전
인수합병
제휴·협업
신제품 발매
사업 확대 계획과 자금 조달
제5장 시장 추정 및 예측 : 차종별 2022 2035
소형 상업용 밴
승용 밴
화물 밴
제6장 시장 추정 및 예측 : 추진력별, 2022-2035
내연기관(ICE)
전기식
하이브리드
제7장 시장 추정 및 예측 : 규모별, 2022-2035
컴팩트
미들 사이즈
풀 사이즈
제8장 시장 추정 및 예측 : 구동별, 2022-2035
전륜구동(FWD)
후륜구동(RWD)
총륜구동(AWD)/4륜구동(4 x4)
제9장 시장 추정 및 예측 : 최종 용도별, 2022-2035
물류·운송
E-Commerce 및 소매
공공 부문
헬스케어
호스피탈리티
기타
제10장 시장 추정 및 예측 : 지역별, 2022-2035
북미
미국
캐나다
유럽
독일
영국
프랑스
이탈리아
스페인
러시아
북유럽 국가
베네룩스
아시아태평양
중국
인도
일본
호주
한국
싱가포르
태국
인도네시아
베트남
라틴아메리카
브라질
멕시코
아르헨티나
콜롬비아
중동 및 아프리카
남아프리카공화국
사우디아라비아
아랍에미리트
제11장 기업 개요
세계 기업
Ford Motor
General Motors
Hyundai Motor Company
Mercedes-Benz
Nissan
Renault
SAIC Motor
Stellantis
Tata Motors
Toyota Motor
지역 기업
Ashok Leyland
Foton Motor
Isuzu
Iveco
JMC
Mahindra &Mahindra
Maxus
Rivian
신흥 기업
Arrival
BYD
Canoo
Wuling Motors
KSM
영문 목차
영문목차
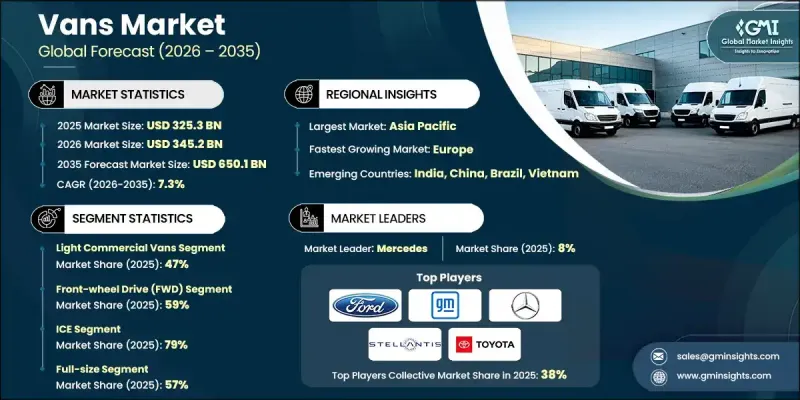
The Global Vans Market was valued at USD 325.3 billion in 2025 and is estimated to grow at a CAGR of 7.3% to reach USD 650.1 billion by 2035.
This market includes light commercial vans, cargo vans, and passenger vans that support a wide range of activities across logistics, healthcare, hospitality, government operations, and e-commerce. Businesses rely on these vehicles for flexible and cost-efficient mobility, and advancements in fleet telematics, connectivity, and data-driven management systems are reshaping operational performance. Although electric vans involve a higher initial investment, their lower energy and maintenance costs are making them an increasingly favorable option for fleets. Market evolution is being shaped by regulatory pressures, shifting customer expectations, and advances in vehicle technologies. Trends such as rapid electrification, growing integration of autonomous and connected systems, and the transformation of last-mile delivery networks are heavily influencing product development and fleet strategies. Sustainability goals, government incentives, and an emphasis on operational efficiency continue to accelerate the transition toward electric van platforms across global markets.
Market Scope
Start Year
2025
Forecast Year
2026-2035
Start Value
$325.3 Billion
Forecast Value
$650.1 Billion
CAGR
7.3%
The light commercial vans category held a 47% share in 2025 and is expected to grow at a CAGR of 7.6% from 2026 to 2035. These vans, typically within the 6,000 to 10,000-pound GVWR range, offer a practical mix of fuel economy, payload capabilities, and maneuverability suitable for dense urban corridors. Leading manufacturers, including Rivian, Ford Motor, Mercedes, and GM, are rolling out new electric designs built specifically for delivery and service applications, reinforcing the segment's strong shift toward electrification.
The front-wheel drive (FWD) vehicles segment held 59% share in 2025 and is forecast to grow at a rate of 7.2% through 2035. Their appeal stems from benefits such as reduced production costs, enhanced fuel efficiency, improved traction on paved streets, and optimized interior layouts that increase usable cargo space. These advantages make FWD configurations particularly well-suited for delivery fleets and service operators focused on cost control and efficient mobility in urban and suburban landscapes.
China Vans Market held a 39% share in 2025, supported by rising fleet demand, extensive domestic production capacity, and accelerating adoption of electric light commercial vehicles. The country's logistics, service, and delivery sectors are driving widespread use of versatile van models designed for both small business owners and large-scale fleet operators. Policy measures promoting cleaner vehicles, investment in charging networks, and stricter emission standards are speeding up fleet electrification and motivating companies to upgrade to low-emission vans.
Major companies active in the Global Vans Market include Ford Motor, Hyundai Motor, Nissan, SAIC Motor, Renault, Stellantis, Tata Motors, Toyota Motor, Mercedes, and General Motors. Companies in the Vans Market are strengthening their competitive position through a combination of strategic initiatives. Many automakers are accelerating investments in electric platforms to meet rising sustainability requirements and appeal to fleet operators seeking lower total cost of ownership. Firms are expanding their connected vehicle ecosystems, enabling real-time diagnostics, predictive maintenance, and performance optimization for large fleets. Collaborations with logistics providers and technology partners are helping companies integrate advanced driver-assistance systems and autonomous capabilities into van lineups.
Table of Contents
Chapter 1 Methodology
1.1 Market scope and definition
1.2 Research design
1.2.1 Research approach
1.2.2 Data collection methods
1.3 Data mining sources
1.3.1 Global
1.3.2 Regional/Country
1.4 Base estimates and calculations
1.4.1 Base year calculation
1.4.2 Key trends for market estimation
1.5 Primary research and validation
1.5.1 Primary sources
1.6 Forecast model
1.7 Research assumptions and limitations
Chapter 2 Executive Summary
2.1 Industry 360° synopsis, 2022 - 2035
2.2 Key market trends
2.2.1 Regional
2.2.2 Vehicle
2.2.3 Propulsion
2.2.4 Size
2.2.5 Drive
2.2.6 End Use
2.3 TAM Analysis, 2026-2035
2.4 CXO perspectives: Strategic imperatives
2.4.1 Executive decision points
2.4.2 Critical success factors
2.5 Future outlook and strategic recommendations
Chapter 3 Industry Insights
3.1 Industry ecosystem analysis
3.1.1 Supplier landscape
3.1.2 Profit margin analysis
3.1.3 Cost structure
3.1.4 Value addition at each stage
3.1.5 Factor affecting the value chain
3.1.6 Disruptions
3.2 Industry impact forces
3.2.1.1 Growth drivers
3.2.1.2 Rising e-commerce and last-mile delivery demand
3.2.1.3 Urbanization and improved infrastructure
3.2.1.4 Shift towards electric and low-emission vans
3.2.1.5 Growth of small and medium enterprises (SMEs)
3.2.1.6 Technological advancements in fleet management and safety
3.2.2 Industry pitfalls and challenges
3.2.2.1 High upfront costs of electric and advanced vans
3.2.2.2 Complex regulations across regions
3.2.3 Market opportunities
3.2.3.1 Growth in electric van adoption
3.2.3.2 Rising demand from e-commerce deliveries
3.2.3.3 Expansion in emerging markets
3.2.3.4 Use of smart fleet management technologies
3.3 Growth potential analysis
3.4 Regulatory landscape
3.4.1 North America
3.4.1.1 US: Federal Motor Vehicle Safety Standards (FMVSS)
3.4.1.2 Canada: Canada Motor Vehicle Safety Standards (CMVSS)
3.4.2 Europe
3.4.2.1 Germany: EU Type Approval Regulation (EU) 2018/858
3.4.2.2 UK: GB Type Approval (Post-Brexit UNECE Regulations)
3.4.2.3 France: EU CO2 Emission Performance Standards for Vans (Regulation EU 2019/631)
3.4.2.4 Italy: EU Whole Vehicle Type Approval (WVTA) Framework
3.4.3 Asia Pacific
3.4.3.1 China: China Compulsory Certification (CCC) - GB Standards
3.4.3.2 India: Bharat Stage (BS) VI Emission Standards
3.4.3.3 Japan: Ministry of Land, Infrastructure, Transport and Tourism (MLIT) Type Approval
3.4.3.4 South Korea: Korea Motor Vehicle Safety Standards (KMVSS)