OTT Content Market, By Revenue Model, By Streaming Platform, By Geography
상품코드:1673953
리서치사:Coherent Market Insights
발행일:2025년 02월
페이지 정보:영문
라이선스 & 가격 (부가세 별도)
ㅁ Add-on 가능: 고객의 요청에 따라 일정한 범위 내에서 Customization이 가능합니다. 자세한 사항은 문의해 주시기 바랍니다.
한글목차
세계의 OTT 컨텐츠 시장은 2025년에 2,921억 5,000만 달러로 추정되며, 2032년에는 7,967억 2,000만 달러에 달할 것으로 예측되며, 2025-2032년에 15.4%의 CAGR로 성장할 것으로 예측됩니다.
보고서 범위
보고서 상세 내용
기준연도
2024년
2025년 시장 규모
2,921억 5,000만 달러
실적 데이터
2020-2024년
예측 기간
2025-2032년
예측 기간 : 2025-2032년 CAGR
15.40%
2032년 금액 예측
7,967억 2,000만 달러
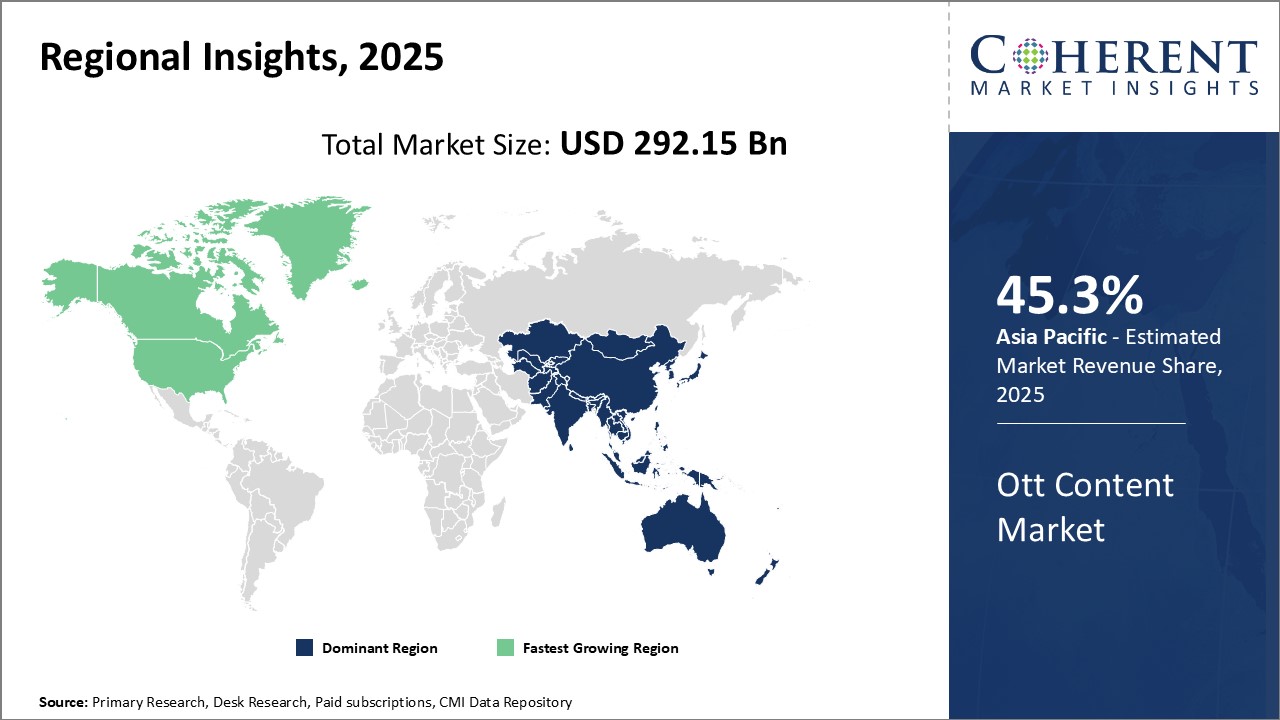
도표. 2025년 지역별 OTT 컨텐츠 시장 점유율(%)
OTT(Over The Top Content)는 기존의 케이블TV나 위성방송의 유료방송 서비스 가입 없이 인터넷을 통해 영화나 TV 컨텐츠를 제공하는 것을 말합니다. 컨텐츠를 인터넷을 통해 제공하는 것을 말합니다. 전 세계에서 스마트폰과 인터넷 보급률이 높아지면서 소비자들, 특히 젊은 층은 스마트 기기를 통해 원하는 영화나 TV 프로그램을 어디서든 원하는 시간에 시청할 수 있는 OTT 미디어 스트리밍 서비스를 선호하는 경향이 높아지고 있습니다. 제공하는 유연성과 편의성은 기존의 유료 TV 모델을 파괴하고 있습니다.
시장 역학
세계 OTT 컨텐츠 시장의 성장은 주로 소비자들 사이에서 스트리밍 미디어 서비스의 채택 증가, 저렴한 인터넷 연결, 네트워크 인프라의 발전으로 인한 것입니다. 온디맨드 미디어 소비에 대한 선호도 증가와 스트리밍 앱을 통한 미디어 라이브러리의 급격한 증가는 시장 성장을 가속할 수 있습니다. 그러나 저개발 지역에서는 클라우드 연결이 부족하고 디지털 저작권 침해에 대한 우려가 시장 성장에 걸림돌이 될 수 있습니다. 연결성이 향상된 저가형 스마트폰의 보급은 신흥 국가 시장 성장에 큰 기회가 될 수 있습니다. 시장 진출 기업은 전략적 파트너십에 초점을 맞추고 현지 언어로 현지화된 컨텐츠를 제공함으로써 지역내 입지를 확대하고 있습니다.
본 조사의 주요 특징
세계의 OTT 컨텐츠 시장을 상세하게 분석했으며, 2024년을 기준 연도로 하여 예측 기간(2025-2032년) 시장 규모와 연평균 성장률(CAGR)에 대해 조사 분석하여 전해드립니다.
또한 다양한 부문에 걸친 잠재적 매출 기회를 밝히고, 이 시장의 매력적인 투자 제안 매트릭스를 설명합니다.
또한 시장 성장 촉진요인, 억제요인, 기회, 신제품 출시 및 승인, 시장 동향, 지역별 전망, 주요 기업의 경쟁 전략 등에 대한 주요 인사이트를 제공합니다.
이 보고서에서는 세계 OTT 컨텐츠 시장의 주요 기업 개요을 기업 개요, 제품 포트폴리오, 주요 특징, 재무 실적, 전략 등의 정보를 바탕으로 정리하여 전해드립니다.
이 보고서의 인사이트를 통해 마케팅 담당자와 기업 경영진은 향후 제품 출시, 유형화, 시장 확대, 마케팅 전술에 대한 정보에 입각한 의사결정을 내릴 수 있습니다.
세계 OTT 컨텐츠 시장 보고서는 투자자, 공급업체, 제품 제조업체, 유통업체, 신규 시장 진출기업, 재무 분석가 등 다양한 이해관계자를 대상으로 합니다.
이해관계자들은 세계 OTT 컨텐츠 시장 분석에 사용되는 다양한 전략 매트릭스를 통해 의사결정을 쉽게 할 수 있습니다.
목차
제1장 조사의 목적과 전제조건
조사 목적
전제조건
약어
제2장 시장 전망
리포트 설명
시장의 정의와 범위
개요
COM(Coherent Opportunity Map)
제3장 시장 역학, 규제, 동향 분석
시장 역학
촉진요인
억제요인
시장 기회
규제 시나리오
산업 동향
합병과 인수
신시스템 출시/승인
COVID-19 팬데믹의 영향
제4장 세계의 OTT 컨텐츠 시장, 매출 모델별, 2020-2032년
서론
서브스크립션 기반
광고 기반
트랜잭션 기반
제5장 세계의 OTT 컨텐츠 시장, 스트리밍 플랫폼별, 2020-2032년
서론
데스크톱과 랩톱
게임기
OTT 스트리밍 디바이스
스마트폰과 태블릿
스마트 TV
기타
제6장 세계의 OTT 컨텐츠 시장, 지역별, 2020-2032년
서론
북미
유럽
아시아태평양
라틴아메리카
중동 및 아프리카
제7장 경쟁 구도
기업 개요
Amazon.com, Inc.
Apple Inc.
AT& T Inc.
BBC Studios
CANAL+Group
Comcast Corporation
Eros International Plc
Hulu LLC
iQIYI, Inc.
MEGOGO
Netflix Japan Inc.
Netflix, Inc.
Rakuten Group, Inc.
Sony Pictures Entertainment Inc.
Star India Private Limited
Tencent Holdings Limited
The Walt Disney Company
Warner Bros. Discovery
Youku Tudou Inc.
YouTube LLC
제8장 애널리스트의 권장사항
운명의 수레바퀴
COM(Coherent Opportunity Map)
제9장 섹션
참고 문헌
조사 방법
KSA
영문 목차
영문목차
Global Ott Content Market is estimated to be valued at USD 292.15 Bn in 2025 and is expected to reach USD 796.72 Bn by 2032, growing at a compound annual growth rate (CAGR) of 15.4% from 2025 to 2032.
Report Coverage
Report Details
Base Year:
2024
Market Size in 2025:
USD 292.15 Bn
Historical Data for:
2020 To 2024
Forecast Period:
2025 To 2032
Forecast Period 2025 to 2032 CAGR:
15.40%
2032 Value Projection:
USD 796.72 Bn
Figure. Ott Content Market Share (%), By Region 2025
Global OTT content market growth is driven by increasing proliferation of smart devices and high-speed internet connectivity. OTT or over-the-top content refers to the delivery of film and television content via the internet without requiring users to subscribe to traditional cable or satellite pay TV services. With rising smartphone and internet penetration worldwide, consumers, particularly young people, are increasingly adopting OTT media streaming services to watch their favorite movies and TV shows on demand from any location via their smart devices. The flexibility and convenience offered by OTT platforms has disrupted the traditional pay TV model.
Market Dynamics:
Global OTT content market growth is primarily driven by rising adoption of streaming media services among consumers, affordable internet connectivity and advancement of network infrastructure. Increasing preference for on-demand media consumption and proliferating media libraries across streaming apps can drive the market growth. However, inadequate cloud connectivity in underdeveloped regions and concerns around digital piracy can hamper the market growth. Proliferation of low-cost smartphones with improved connectivity can offer a significant opportunity for market growth in emerging countries. Market players are focusing on strategic partnerships and expanding regional presence by providing localized content in local languages.
Key features of the study:
This report provides in-depth analysis of the global OTT content market, and provides market size (US$ Bn) and compound annual growth rate (CAGR%) for the forecast period (2025-2032), considering 2024 as the base year.
It elucidates potential revenue opportunities across different segments and explains attractive investment proposition matrices for this market.
This study also provides key insights about market drivers, restraints, opportunities, new product launches or approval, market trends, regional outlook, and competitive strategies adopted by key players.
It profiles key players in the global OTT content market based on the following parameters - company highlights, products portfolio, key highlights, financial performance, and strategies.
Key companies covered as a part of this study include Amazon.com, Inc., Apple Inc., AT&T Inc., BBC Studios, CANAL+ Group, Comcast Corporation, Eros International Plc, Hulu LLC, iQIYI, Inc., MEGOGO, Netflix Japan Inc., Netflix, Inc., Rakuten Group, Inc., Sony Pictures Entertainment Inc., Star India Private Limited, Tencent Holdings Limited, The Walt Disney Company, Warner Bros. Discovery, Youku Tudou Inc., YouTube LLC.
Insights from this report would allow marketers and the management authorities of the companies to make informed decisions regarding their future product launches, type up-gradation, market expansion, and marketing tactics.
Global OTT content market report caters to various stakeholders in this industry including investors, suppliers, product manufacturers, distributors, new entrants, and financial analysts.
Stakeholders would have ease in decision-making through various strategy matrices used in analyzing the global OTT content market.
Detailed Segmentation:
By Revenue Model
Subscription Based
Advertising Based
Transaction Based
By Streaming Platform
Desktop and Laptop
Gaming Consoles
OTT Streaming Devices
Smartphones and Tablets
Smart TVs
Others
By Regional
North America
Europe
Asia Pacific
Latin America
Middle East
Africa
Key Players Insights
Amazon.com, Inc.
Apple Inc.
AT&T Inc.
BBC Studios
CANAL+ Group
Comcast Corporation
Eros International Plc
Hulu LLC
iQIYI, Inc.
MEGOGO
Netflix Japan Inc.
Netflix, Inc.
Rakuten Group, Inc.
Sony Pictures Entertainment Inc.
Star India Private Limited
Tencent Holdings Limited
The Walt Disney Company
Warner Bros. Discovery
Youku Tudou Inc.
YouTube LLC
Table of Contents
1. Research Objectives and Assumptions
Research Objectives
Assumptions
Abbreviations
2. Market Purview
Report Description
Market Definition and Scope
Executive Summary
Market Snippet, By Revenue Model
Market Snippet, By Streaming Platform
Market Snippet, By Region
Coherent Opportunity Map (COM)
3. Market Dynamics, Regulations, and Trends Analysis
Market Dynamics
Drivers
Restraints
Market Opportunities
Regulatory Scenario
Industry Trend
Merger and Acquisitions
New System Launch/Approvals
Impact of COVID-19 Pandemic
4. Global OTT Content Market, By Revenue Model, 2020-2032, (US$ Billion)
Introduction
Market Share Analysis, 2025 and 2032 (%)
Y-o-Y Growth Analysis, 2020-2032
Segment Trends
Subscription Based
Introduction
Market Size and Forecast, 2020-2032, (US$ Billion)
Advertising Based
Introduction
Market Size and Forecast, 2020-2032, (US$ Billion)
Transaction Based
Introduction
Market Size and Forecast, 2020-2032, (US$ Billion)
5. Global OTT Content Market, By Streaming Platform, 2020-2032, (US$ Billion)
Introduction
Market Share Analysis, 2025 and 2032 (%)
Y-o-Y Growth Analysis, 2020-2032
Segment Trends
Desktop and Laptop
Introduction
Market Size and Forecast, 2020-2032, (US$ Billion)
Gaming Consoles
Introduction
Market Size and Forecast, 2020-2032, (US$ Billion)
OTT Streaming Devices
Introduction
Market Size and Forecast, 2020-2032, (US$ Billion)
Smartphones and Tablets
Introduction
Market Size and Forecast, 2020-2032, (US$ Billion)
Smart TVs
Introduction
Market Size and Forecast, 2020-2032, (US$ Billion)
Others
Introduction
Market Size and Forecast, 2020-2032, (US$ Billion)
6. Global OTT Content Market, By Region, 2020-2032, (US$ Billion)
Introduction
Market Share Analysis, By Region, 2025 and 2032 (%)
Y-o-Y Growth Analysis, 2020-2032
North America
Regional Trends
Market Size and Forecast, By Revenue Model, 2020-2032, (US$ Billion)
Market Size and Forecast, By Streaming Platform, 2020-2032, (US$ Billion)
Market Size and Forecast, By Country, 2020-2032, (US$ Billion)
U.S.
Canada
Europe
Regional Trends
Market Size and Forecast, By Revenue Model, 2020-2032, (US$ Billion)
Market Size and Forecast, By Streaming Platform, 2020-2032, (US$ Billion)
Market Size and Forecast, By Country, 2020-2032, (US$ Billion)
U.K.
Germany
France
Russia
Rest of Europe
Asia Pacific
Regional Trends
Market Size and Forecast, By Revenue Model, 2020-2032, (US$ Billion)
Market Size and Forecast, By Streaming Platform, 2020-2032, (US$ Billion)
Market Size and Forecast, By Country, 2020-2032, (US$ Billion)
China
India
Japan
ASEAN
Australia
South Korea
Rest of Asia Pacific
Latin America
Regional Trends
Market Size and Forecast, By Revenue Model, 2020-2032, (US$ Billion)
Market Size and Forecast, By Streaming Platform, 2020-2032, (US$ Billion)
Market Size and Forecast, By Country, 2020-2032, (US$ Billion)
Brazil
Argentina
Mexico
Rest of Latin America
Middle East & Africa
Regional Trends
Market Size and Forecast, By Revenue Model, 2020-2032, (US$ Billion)
Market Size and Forecast, By Streaming Platform, 2020-2032, (US$ Billion)
Market Size and Forecast, By Country, 2020-2032, (US$ Billion)