합성연료 시장 : 연료 유형별, 상태별, 생산 방법별, 기술 유형별, 최종 사용자별, 지역별(-2035년)
E-Fuels Market Till 2035: Distribution by Type of Fuel, Type of State, Type of Production Method, Type of Technology, Type of End User, and Geographical Regions: Industry Trends and Global Forecast
상품코드:1883715
리서치사:Roots Analysis
발행일:On Demand Report
페이지 정보:영문 192 Pages
라이선스 & 가격 (부가세 별도)
한글목차
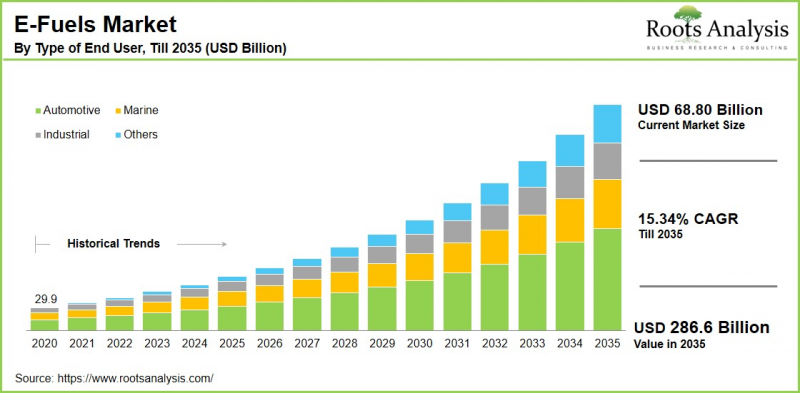
Roots Analysis의 조사에 따르면 세계의 합성연료 시장 규모는 현재 688억 달러로 평가되었고, 2035년까지 2,866억 달러로 성장할 전망이며, 예측 기간 동안 CAGR 15.34%로 추정되고 있습니다.
합성연료 시장 기회 : 분류
연료 유형별
e디젤
e가솔린
e수소
e등유
e메탄
e메탄올
기타
상태별
가스
액체
생산 방법별
생물 유래 연료
파워 투 가스
파워 투리키드
기술 유형별
직접 공기 회수
전해
피셔트롭슈 합성
메탄화
최종 사용자별
자동차
항공
산업
선박
철도
기타
지역별
북미
미국
캐나다
멕시코
기타 북미 국가
유럽
오스트리아
벨기에
덴마크
프랑스
독일
아일랜드
이탈리아
네덜란드
노르웨이
러시아
스페인
스웨덴
스위스
영국
기타 유럽 국가
아시아
중국
인도
일본
싱가포르
한국
기타 아시아 국가
라틴아메리카
브라질
칠레
콜롬비아
베네수엘라
기타 라틴아메리카 국가
중동 및 북아프리카
이집트
이란
이라크
이스라엘
쿠웨이트
사우디아라비아
아랍에미리트(UAE)
기타 중동 및 북아프리카 국가
세계 기타 지역
호주
뉴질랜드
기타 국가들
합성연료(e-fuel) 시장 : 성장 및 동향
이산화탄소 배출량이 증가함에 따라 합성연료(e-fuel)는 화석 연료의 유망한 대안으로 점점 더 주목을 받고 있습니다. 합성연료는 재생에너지원을 통해 생성되는 탄소 중립 연료입니다. 이 연료는 그린 수소와 대기 중 또는 산업 공정에서 회수된 이산화탄소를 통합하여 생산됩니다. 합성연료의 목적은 다양한 용도에서 화석연료의 대체 역할을 하고 항공, 해운, 중공업 등의 탈탄소화가 과제가 되는 분야에 지속가능한 옵션을 제공하는 것입니다.
유럽의 Sustainable and Smart Mobility Strategy와 같은 기후 목표 강화는 세계의 합성연료 시장 수요를 뒷받침하고 있습니다. 합성연료의 큰 장점은 합성방법에 따라 e케로신, e디젤, e가솔린, e메탄올 등 다양한 형태로 생산가능한 점에 있으며, 이로써 다양한 산업 분야에서의 용도 범위가 넓어집니다. 합성연료는 탄소 중립성, 드롭 인 능력 및 에너지 저장 기능을 제공하므로 신재생 자원이 풍부한 지역에서 실현 가능한 옵션이됩니다.
또한 기업의 넷 제로 배출 달성에 대한 노력 강화와 기후 변화 및 환경 문제에 대한 의식의 고조가 지속 가능한 에너지 솔루션에 대한 수요를 뒷받침하고 있습니다. 또한 칠레의 Oni 플랜트 등 대규모 합성연료 프로젝트에 대한 국제적인 협력과 자금 조달 증가도 합성연료 생산의 실용성을 보여줍니다. 이러한 요인을 고려하면, 합성연료 시장은 예측 기간 동안 상당한 성장을 보여줄 전망입니다.
본 보고서에서는 세계 합성연료(e-fuel) 시장을 조사했으며, 시장 개요, 배경, 시장 영향인자 분석, 시장 규모 추이 및 예측, 각종 구분, 지역별 상세 분석, 경쟁 구도, 주요기업 프로파일 등을 정리했습니다.
목차
섹션 I : 보고서 개요
제1장 서문
제2장 조사 방법
제3장 시장 역학
제4장 거시경제지표
섹션 II : 정성적 인사이트
제5장 주요 요약
제6장 서문
제7장 규제 시나리오
섹션 III : 시장 개요
제8장 주요 기업의 종합적 데이터베이스
제9장 경쟁 구도
제10장 화이트 스페이스 분석
제11장 기업의 경쟁력 분석
제12장 합성연료(e-fuel) 시장에서의 스타트업 에코 시스템
섹션 IV : 기업 프로파일
제13장 기업 프로파일
장의 개요
Archer Daniels Midland
Ballard Power Systems
Ceres Power Holding
Clean Fuels Alliance America
Climeworks
eFuel Corporation
eFuel Pacific
ExxonMobil
Hexagon Agility
HIF Global
Infinium
LanzaJet
Liquid Wind
Mitsubishi
Neste
Norsk e-Fuels
섹션 V : 시장 동향
제14장 메가트렌드 분석
제15장 언멧 요구 분석
제16장 특허 분석
제17장 최근 동향
섹션 VI : 시장 기회 분석
제18장 세계의 합성연료(e-fuel) 시장
제19장 연료 유형별 시장 기회
제20장 상태별 시장 기회
제21장 생산 방법별 시장 기회
제22장 기술 유형별 시장 기회
제23장 최종 사용자별 시장 기회
제24장 북미의 합성연료(e-fuel) 시장 기회
제25장 유럽의 합성연료(e-fuel) 시장 기회
제26장 아시아의 합성연료(e-fuel) 시장 기회
제27장 중동 및 북아프리카의 합성연료(e-fuel) 시장 기회
제28장 인접 시장 분석
섹션 VII : 전략 도구
제29장 중요한 승리 전략
제30장 Porter's Five Forces 분석
제31장 SWOT 분석
제32장 밸류체인 분석
제33장 ROOTS에 의한 전략 제안
섹션 VIII : 기타 독점적 인사이트
제34장 1차 조사로부터의 인사이트
제35장 보고서의 결론
섹션 IX : 부록
제36장 표 형식 데이터
제37장 기업 및 단체 일람
제38장 커스터마이즈 기회
제39장 ROOTS 구독 서비스
제40장 저자 상세
AJY
영문 목차
영문목차
E-Fuels Market Overview
As per Roots Analysis, the global e-fuels market size is estimated to grow from USD 68.80 billion in the current year USD 286.6 billion by 2035, at a CAGR of 15.34% during the forecast period, till 2035.
The opportunity for e-fuels market has been distributed across the following segments:
Type of Fuel
E-Diesel
E-Gasoline
E-Hydrogen
E-Kerosene
E-Methane
E-Methanol
Others
Type of State
Gas
Liquid
Type of Production Method
Biologically Derived Fuels
Power-to-Gas
Power-to-Liquid
Type of Technology
Direct air Capture
Electrolysis
Fischer-Tropsch Synthesis
Methanation
Type of End User
Automotive
Aviation
Industrial
Marine
Railway
Others
Geographical Regions
North America
US
Canada
Mexico
Other North American countries
Europe
Austria
Belgium
Denmark
France
Germany
Ireland
Italy
Netherlands
Norway
Russia
Spain
Sweden
Switzerland
UK
Other European countries
Asia
China
India
Japan
Singapore
South Korea
Other Asian countries
Latin America
Brazil
Chile
Colombia
Venezuela
Other Latin American countries
Middle East and North Africa
Egypt
Iran
Iraq
Israel
Kuwait
Saudi Arabia
UAE
Other MENA countries
Rest of the World
Australia
New Zealand
Other countries
E-Fuels Market: Growth and Trends
Given the rising levels of carbon emissions, e-fuels are becoming increasingly favored as a promising substitute for fossil fuels. E-fuel, also referred to as electro-fuel or synthetic fuel, is a carbon-neutral fuel generated through renewable energy sources. These fuels are made by integrating green hydrogen with carbon dioxide captured from the atmosphere or from industrial processes. The aim of e-fuels is to serve as a replacement for fossil fuels across various applications and provide a sustainable alternative for decarbonizing challenging sectors like aviation, shipping, and heavy industry.
The growing climate objectives, particularly in Europe, such as the Sustainable and Smart Mobility Strategy, have boosted the global demand for the e-fuels market. A significant advantage of e-fuels is their ability to be produced in diverse forms depending on the synthesis methods used, including e-kerosene, e-diesel, e-gasoline, e-methanol, among others, which broadens their applications across different industries. E-fuels offer carbon neutrality, drop-in capacity, and energy storage, making them a feasible option for regions rich in renewable resources.
Moreover, the increasing corporate dedication to achieving net-zero emissions and heightened awareness regarding climate change and environmental issues are strengthening the demand for sustainable energy solutions. Additionally, a rise in global partnerships and funding for large-scale e-fuel initiatives, such as the Oni plant in Chile, is showcasing the practicality of e-fuel production. Overall, considering the above mentioned factors, the e-fuels market is expected to grow significantly during the forecast period.
E-fuels Market: Key Segments
Market Share by Type of Fuel
Based on type of fuel, the global e-fuels market is segmented into various types. According to our estimates, currently, the e-kerosene segment captures the majority of the market share. This can be attributed to its use in hard-to-abate sectors such as aviation, shipping, and heavy-duty transport, as it can be utilized in existing aircraft engines without the need for modifications, thereby fostering growth in this segment.
However, the e-methanol segment is projected to experience a comparatively higher compound annual growth rate (CAGR) during the forecast period. This can be attributed to the fact that it serves as more environmentally friendly option compared to heavy fuel oil and can be employed in current ship engines with minimal adjustments, leading to increasing demand in important application areas.
Market Share by Type of State
Based on type of state, the global e-fuels market is segmented into gas and liquid. According to our estimates, currently, the liquid state segment captures the majority of the market share. This can be attributed to the benefits of liquid e-fuels like e-diesel and e-gasoline, which feature higher energy density, compatibility as drop-in alternatives, and broader applications for end-users.
In contrast, the gas segment is projected to experience a higher CAGR throughout the forecast period. This is due to the extensive use in industrial processes, electricity generation, and heating.
Market Share by Type of Production Method
Based on type of production method, the global e-fuels market is segmented into biologically derived fuels, power-to-gas, and power-to-liquid. According to our estimates, currently, the power-to-liquid method captures the majority of the market share. This can be attributed to the fact that it combines several technologies, such as green hydrogen, carbon capture, and synthesis processes, to generate high-quality drop-in fuels.
However, the power-to-gas production method is projected to experience a comparatively higher compound annual growth rate (CAGR) during the forecast period, driven by its increasing application in industrial activities, including heating and power generation.
Market Share by Type of Technology
Based on type of technology, the global e-fuels market is segmented into direct air capture, electrolysis, fischer-tropsch synthesis, and methanation. According to our estimates, currently, the electrolysis (hydrogen production) segment captures the majority of the market share. This can be linked to the fact that the green hydrogen is generated by separating water into hydrogen and oxygen through renewable electricity, making it a crucial element of e-fuels, which propels the growth of this segment.
On the other hand, the Fischer-Tropsch Synthesis technology segment is projected to experience a comparatively higher compound annual growth rate (CAGR) during the forecast period. This growth can be attributed to the fact that the Fischer-Tropsch (FT) process is a well-established method for transforming syngas into liquid hydrocarbons like e-diesel and e-kerosene. Further, the integration of green hydrogen and CO2 capture technologies for the production of carbon-neutral fuels bolsters the expansion of this segment.
Market Share by Type of End User
Based on type of end user, the global e-fuels market is segmented into a wide range of end users. According to our estimates, currently, the automotive segment captures the majority of the market share. This can be attributed to the increasing regulatory measures aimed at reducing carbon emissions and the expansion of electrification. High-performance and luxury vehicle producers like Porsche and Ferrari are investing in e-fuels to enhance the performance of internal combustion engine vehicles while minimizing emissions, thereby improving market prospects
However, the aviation sector is expected to grow at a higher CAGR during the forecast period, due to regulatory demands from entities such as the International Civil Aviation Organization (ICAO) and the EU's Fit for 55 Package. Airlines and aircraft manufacturers are pledging to achieve net-zero emissions by 2050, further increasing the market's potential.
Market Share by Geographical Regions
Based on geographical regions, the e-fuels market is segmented into North America, Europe, Asia, Latin America, Middle East and North Africa, and the rest of the world. According to our estimates, currently the market in Europe captures the majority share of the market. Additionally, North America ranks as the second largest market for e-fuels, driven by a greater adoption of sustainable solutions and stringent regulatory measures.
Further, Asia is emerging as the region with the fastest growth in the e-fuels sector, spurred by rapid industrialization and increasing energy demand. To address the escalating energy needs while decreasing dependence on fossil fuels, countries in Asia are investing in alternative energy options similar to e-fuels.
Example Players in E-Fuels Market
Archer Daniels Midland
Ballard Power Systems
Ceres Power Holding
Clean Fuels Alliance America
Climeworks
E-Fuel Corporation
eFuel Pacific
ExxonMobil
Hexagon Agility
HIF Global
Infinium
LanzaJet
Liquid Wind
Mitsubishi
Neste
Norsk e-Fuels
E-fuels Market: Research Coverage
The report on the e-fuels market features insights on various sections, including:
Market Sizing and Opportunity Analysis: An in-depth analysis of the e-fuels market, focusing on key market segments, including [A] type of fuel, [B] type of state, [C] type of production method, [D] type of technology, [E] type of end user, and [F] geographical regions.
Competitive Landscape: A comprehensive analysis of the companies engaged in the e-fuels market, based on several relevant parameters, such as [A] year of establishment, [B] company size, [C] location of headquarters and [D] ownership structure.
Company Profiles: Elaborate profiles of prominent players engaged in the e-fuels market, providing details on [A] location of headquarters, [B] company size, [C] company mission, [D] company footprint, [E] management team, [F] contact details, [G] financial information, [H] operating business segments, [I] portfolio, [J] moat analysis, [K] recent developments, and an informed future outlook.
Megatrends: An evaluation of ongoing megatrends in the e-fuels industry.
Patent Analysis: An insightful analysis of patents filed / granted in the e-fuels domain, based on relevant parameters, including [A] type of patent, [B] patent publication year, [C] patent age and [D] leading players.
Recent Developments: An overview of the recent developments made in the e-fuels market, along with analysis based on relevant parameters, including [A] year of initiative, [B] type of initiative, [C] geographical distribution and [D] most active players.
Porter's Five Forces Analysis: An analysis of five competitive forces prevailing in the e-fuels market, including threats of new entrants, bargaining power of buyers, bargaining power of suppliers, threats of substitute products and rivalry among existing competitors.
SWOT Analysis: An insightful SWOT framework, highlighting the strengths, weaknesses, opportunities and threats in the domain. Additionally, it provides Harvey ball analysis, highlighting the relative impact of each SWOT parameter.
Value Chain Analysis: A comprehensive analysis of the value chain, providing information on the different phases and stakeholders involved in the e-fuels market.
Key Questions Answered in this Report
How many companies are currently engaged in e-fuels market?
Which are the leading companies in this market?
What factors are likely to influence the evolution of this market?
What is the current and future market size?
What is the CAGR of this market?
How is the current and future market opportunity likely to be distributed across key market segments?
Reasons to Buy this Report
The report provides a comprehensive market analysis, offering detailed revenue projections of the overall market and its specific sub-segments. This information is valuable to both established market leaders and emerging entrants.
Stakeholders can leverage the report to gain a deeper understanding of the competitive dynamics within the market. By analyzing the competitive landscape, businesses can make informed decisions to optimize their market positioning and develop effective go-to-market strategies.
The report offers stakeholders a comprehensive overview of the market, including key drivers, barriers, opportunities, and challenges. This information empowers stakeholders to stay abreast of market trends and make data-driven decisions to capitalize on growth prospects.
Additional Benefits
Complimentary Excel Data Packs for all Analytical Modules in the Report
15% Free Content Customization
Detailed Report Walkthrough Session with Research Team
Free Updated report if the report is 6-12 months old or older
TABLE OF CONTENTS
SECTION I: REPORT OVERVIEW
1. PREFACE
1.1. Introduction
1.2. Market Share Insights
1.3. Key Market Insights
1.4. Report Coverage
1.5. Key Questions Answered
1.6. Chapter Outlines
2. RESEARCH METHODOLOGY
2.1. Chapter Overview
2.2. Research Assumptions
2.3. Database Building
2.3.1. Data Collection
2.3.2. Data Validation
2.3.3. Data Analysis
2.4. Project Methodology
2.4.1. Secondary Research
2.4.1.1. Annual Reports
2.4.1.2. Academic Research Papers
2.4.1.3. Company Websites
2.4.1.4. Investor Presentations
2.4.1.5. Regulatory Filings
2.4.1.6. White Papers
2.4.1.7. Industry Publications
2.4.1.8. Conferences and Seminars
2.4.1.9. Government Portals
2.4.1.10. Media and Press Releases
2.4.1.11. Newsletters
2.4.1.12. Industry Databases
2.4.1.13. Roots Proprietary Databases
2.4.1.14. Paid Databases and Sources
2.4.1.15. Social Media Portals
2.4.1.16. Other Secondary Sources
2.4.2. Primary Research
2.4.2.1. Introduction
2.4.2.2. Types
2.4.2.2.1. Qualitative
2.4.2.2.2. Quantitative
2.4.2.3. Advantages
2.4.2.4. Techniques
2.4.2.4.1. Interviews
2.4.2.4.2. Surveys
2.4.2.4.3. Focus Groups
2.4.2.4.4. Observational Research
2.4.2.4.5. Social Media Interactions
2.4.2.5. Stakeholders
2.4.2.5.1. Company Executives (CXOs)
2.4.2.5.2. Board of Directors
2.4.2.5.3. Company Presidents and Vice Presidents
2.4.2.5.4. Key Opinion Leaders
2.4.2.5.5. Research and Development Heads
2.4.2.5.6. Technical Experts
2.4.2.5.7. Subject Matter Experts
2.4.2.5.8. Scientists
2.4.2.5.9. Doctors and Other Healthcare Providers
2.4.2.6. Ethics and Integrity
2.4.2.6.1. Research Ethics
2.4.2.6.2. Data Integrity
2.4.3. Analytical Tools and Databases
3. MARKET DYNAMICS
3.1. Forecast Methodology
3.1.1. Top-Down Approach
3.1.2. Bottom-Up Approach
3.1.3. Hybrid Approach
3.2. Market Assessment Framework
3.2.1. Total Addressable Market (TAM)
3.2.2. Serviceable Addressable Market (SAM)
3.2.3. Serviceable Obtainable Market (SOM)
3.2.4. Currently Acquired Market (CAM)
3.3. Forecasting Tools and Techniques
3.3.1. Qualitative Forecasting
3.3.2. Correlation
3.3.3. Regression
3.3.4. Time Series Analysis
3.3.5. Extrapolation
3.3.6. Convergence
3.3.7. Forecast Error Analysis
3.3.8. Data Visualization
3.3.9. Scenario Planning
3.3.10. Sensitivity Analysis
3.4. Key Considerations
3.4.1. Demographics
3.4.2. Market Access
3.4.3. Reimbursement Scenarios
3.4.4. Industry Consolidation
3.5. Robust Quality Control
3.6. Key Market Segmentations
3.7. Limitations
4. MACRO-ECONOMIC INDICATORS
4.1. Chapter Overview
4.2. Market Dynamics
4.2.1. Time Period
4.2.1.1. Historical Trends
4.2.1.2. Current and Forecasted Estimates
4.2.2. Currency Coverage
4.2.2.1. Overview of Major Currencies Affecting the Market
4.2.2.2. Impact of Currency Fluctuations on the Industry
4.2.3. Foreign Exchange Impact
4.2.3.1. Evaluation of Foreign Exchange Rates and Their Impact on Market
4.2.3.2. Strategies for Mitigating Foreign Exchange Risk
4.2.4. Recession
4.2.4.1. Historical Analysis of Past Recessions and Lessons Learnt
4.2.4.2. Assessment of Current Economic Conditions and Potential Impact on the Market
4.2.5. Inflation
4.2.5.1. Measurement and Analysis of Inflationary Pressures in the Economy
4.2.5.2. Potential Impact of Inflation on the Market Evolution
4.2.6. Interest Rates
4.2.6.1. Overview of Interest Rates and Their Impact on the Market
4.2.6.2. Strategies for Managing Interest Rate Risk
4.2.7. Commodity Flow Analysis
4.2.7.1. Type of Commodity
4.2.7.2. Origins and Destinations
4.2.7.3. Values and Weights
4.2.7.4. Modes of Transportation
4.2.8. Global Trade Dynamics
4.2.8.1. Import Scenario
4.2.8.2. Export Scenario
4.2.9. War Impact Analysis
4.2.9.1. Russian-Ukraine War
4.2.9.2. Israel-Hamas War
4.2.10. COVID Impact / Related Factors
4.2.10.1. Global Economic Impact
4.2.10.2. Industry-specific Impact
4.2.10.3. Government Response and Stimulus Measures
4.2.10.4. Future Outlook and Adaptation Strategies
4.2.11. Other Indicators
4.2.11.1. Fiscal Policy
4.2.11.2. Consumer Spending
4.2.11.3. Gross Domestic Product (GDP)
4.2.11.4. Employment
4.2.11.5. Taxes
4.2.11.6. R&D Innovation
4.2.11.7. Stock Market Performance
4.2.11.8. Supply Chain
4.2.11.9. Cross-Border Dynamics
SECTION II: QUALITATIVE INSIGHTS
5. EXECUTIVE SUMMARY
6. INTRODUCTION
6.1. Chapter Overview
6.2. Overview of E-Fuels Market
6.2.1. Type of Fuel
6.2.2. Type of State
6.2.3. Type of Production Method
6.2.4. Type of Technology
6.2.5. Type of End User
6.3. Future Perspective
7. REGULATORY SCENARIO
SECTION III: MARKET OVERVIEW
8. COMPREHENSIVE DATABASE OF LEADING PLAYERS
9. COMPETITIVE LANDSCAPE
9.1. Chapter Overview
9.2. E-Fuel: Overall Market Landscape
9.2.1. Analysis by Year of Establishment
9.2.2. Analysis by Company Size
9.2.3. Analysis by Location of Headquarters
9.2.4. Analysis by Ownership Structure
10. WHITE SPACE ANALYSIS
11. COMPANY COMPETITIVENESS ANALYSIS
12. STARTUP ECOSYSTEM IN THE E-FUELS MARKET
12.1. E-Fuel: Market Landscape of Startups
12.1.1. Analysis by Year of Establishment
12.1.2. Analysis by Company Size
12.1.3. Analysis by Company Size and Year of Establishment
12.1.4. Analysis by Location of Headquarters
12.1.5. Analysis by Company Size and Location of Headquarters
12.1.6. Analysis by Ownership Structure
12.2. Key Findings
SECTION IV: COMPANY PROFILES
13. COMPANY PROFILES
13.1. Chapter Overview
13.2. Archer Daniels Midland *
13.2.1. Acuity Brands Overview
13.2.2. Company Mission
13.2.3. Company Footprint
13.2.4. Management Team
13.2.5. Contact Details
13.2.6. Financial Performance
13.2.7. Operating Business Segments
13.2.8. Service / Product Portfolio (project specific)
13.2.9. MOAT Analysis
13.2.10. Recent Developments and Future Outlook
13.3. Ballard Power Systems
13.4. Ceres Power Holding
13.5. Clean Fuels Alliance America
13.6. Climeworks
13.7. E-Fuel Corporation
13.8. eFuel Pacific
13.9. ExxonMobil
13.10. Hexagon Agility
13.11. HIF Global
13.12. Infinium
13.13. LanzaJet
13.14. Liquid Wind
13.15. Mitsubishi
13.16. Neste
13.17. Norsk e-Fuels
SECTION V: MARKET TRENDS
14. MEGA TRENDS ANALYSIS
15. UNMET NEED ANALYSIS
16. PATENT ANALYSIS
17. RECENT DEVELOPMENTS
17.1. Chapter Overview
17.2. Recent Funding
17.3. Recent Partnerships
17.4. Other Recent Initiatives
SECTION VI: MARKET OPPORTUNITY ANALYSIS
18. GLOBAL E-FUELS MARKET
18.1. Chapter Overview
18.2. Key Assumptions and Methodology
18.3. Trends Disruption Impacting Market
18.4. Demand Side Trends
18.5. Supply Side Trends
18.6. Global E-Fuels Market, Historical Trends (Since 2020) and Forecasted Estimates (Till 2035)
18.7. Multivariate Scenario Analysis
18.7.1. Conservative Scenario
18.7.2. Optimistic Scenario
18.8. Investment Feasibility Index
18.9. Key Market Segmentations
19. MARKET OPPORTUNITIES BASED ON TYPE OF FUEL
19.1. Chapter Overview
19.2. Key Assumptions and Methodology
19.3. Revenue Shift Analysis
19.4. Market Movement Analysis
19.5. Penetration-Growth (P-G) Matrix
19.6. E-Fuels Market for E-Diesel: Historical Trends (Since 2020) and Forecasted Estimates (Till 2035)
19.7. E-Fuels Market for E-Gasoline: Historical Trends (Since 202) and Forecasted Estimates (Till 2035)
19.8. E-Fuels Market for E-Hydrogen: Historical Trends (Since 202) and Forecasted Estimates (Till 2035)
19.9. E-Fuels Market for E-Kerosene: Historical Trends (Since 202) and Forecasted Estimates (Till 2035)
19.10. E-Fuels Market for E-Methane: Historical Trends (Since 202) and Forecasted Estimates (Till 2035)
19.11. E-Fuels Market for E-Methanol: Historical Trends (Since 202) and Forecasted Estimates (Till 2035)
19.12. E-Fuels Market for Others: Historical Trends (Since 202) and Forecasted Estimates (Till 2035)
19.13. Data Triangulation and Validation
19.13.1. Secondary Sources
19.13.2. Primary Sources
19.13.3. Statistical Modeling
20. MARKET OPPORTUNITIES BASED ON TYPE OF STATE
20.1. Chapter Overview
20.2. Key Assumptions and Methodology
20.3. Revenue Shift Analysis
20.4. Market Movement Analysis
20.5. Penetration-Growth (P-G) Matrix
20.6. E-Fuels Market for Gas: Historical Trends (Since 2020) and Forecasted Estimates (Till 2035)
20.7. E-Fuels Market for Liquid: Historical Trends (Since 2020) and Forecasted Estimates (Till 2035)
20.8. Data Triangulation and Validation
20.8.1. Secondary Sources
20.8.2. Primary Sources
20.8.3. Statistical Modeling
21. MARKET OPPORTUNITIES BASED ON TYPE OF PRODUCTION METHOD
21.1. Chapter Overview
21.2. Key Assumptions and Methodology
21.3. Revenue Shift Analysis
21.4. Market Movement Analysis
21.5. Penetration-Growth (P-G) Matrix
21.6. E-Fuels Market for Biologically Derived Fuels: Historical Trends (Since 2020) and Forecasted Estimates (Till 2035)
21.7. E-Fuels Market for Power-to-Gas: Historical Trends (Since 2020) and Forecasted Estimates (Till 2035)
21.8. E-Fuels Market for Power-to-Liquid: Historical Trends (Since 2020) and Forecasted Estimates (Till 2035)
21.9. Data Triangulation and Validation
21.9.1. Secondary Sources
21.9.2. Primary Sources
21.9.3. Statistical Modeling
22. MARKET OPPORTUNITIES BASED ON TYPE OF TECHNOLOGY
22.1. Chapter Overview
22.2. Key Assumptions and Methodology
22.3. Revenue Shift Analysis
22.4. Market Movement Analysis
22.5. Penetration-Growth (P-G) Matrix
22.6. E-Fuels Market for Direct Air Capture: Historical Trends (Since 2020) and Forecasted Estimates (Till 2035)
22.7. E-Fuels Market for Electrolysis: Historical Trends (Since 2020) and Forecasted Estimates (Till 2035)
22.8. E-Fuels Market for Fischer-Tropsch Synthesis: Historical Trends (Since 2020) and Forecasted Estimates (Till 2035)
22.9. E-Fuels Market for Methanation: Historical Trends (Since 2020) and Forecasted Estimates (Till 2035)
22.10. Data Triangulation and Validation
22.10.1. Secondary Sources
22.10.2. Primary Sources
22.10.3. Statistical Modeling
23. MARKET OPPORTUNITIES BASED ON TYPE OF END USER
23.1. Chapter Overview
23.2. Key Assumptions and Methodology
23.3. Revenue Shift Analysis
23.4. Market Movement Analysis
23.5. Penetration-Growth (P-G) Matrix
23.6. E-Fuels Market for Automotive: Historical Trends (Since 2020) and Forecasted Estimates (Till 2035)
23.7. E-Fuels Market for Aviation: Historical Trends (Since 2020) and Forecasted Estimates (Till 2035)
23.8. E-Fuels Market for Industrial: Historical Trends (Since 2020) and Forecasted Estimates (Till 2035)
23.9. E-Fuels Market for Marine: Historical Trends (Since 2020) and Forecasted Estimates (Till 2035)
23.10. E-Fuels Market for Railway: Historical Trends (Since 2020) and Forecasted Estimates (Till 2035)
23.11. E-Fuels Market for Others: Historical Trends (Since 2020) and Forecasted Estimates (Till 2035)
23.12. Data Triangulation and Validation
23.12.1. Secondary Sources
23.12.2. Primary Sources
23.12.3. Statistical Modeling
24. MARKET OPPORTUNITIES FOR E-FUELS IN NORTH AMERICA
24.1. Chapter Overview
24.2. Key Assumptions and Methodology
24.3. Revenue Shift Analysis
24.4. Market Movement Analysis
24.5. Penetration-Growth (P-G) Matrix
24.6. E-Fuels Market in North America: Historical Trends (Since 2020) and Forecasted Estimates (Till 2035)
24.6.1. E-Fuels Market in the US: Historical Trends (Since 2020) and Forecasted Estimates (Till 2035)
24.6.2. E-Fuels Market in Canada: Historical Trends (Since 2020) and Forecasted Estimates (Till 2035)
24.6.3. E-Fuels Market in Mexica: Historical Trends (Since 2020) and Forecasted Estimates (Till 2035)
24.6.4. E-Fuels Market in Other North American Countries: Historical Trends (Since 2020) and Forecasted Estimates (Till 2035)
24.7. Data Triangulation and Validation
25. MARKET OPPORTUNITIES FOR E-FUELS IN EUROPE
25.1. Chapter Overview
25.2. Key Assumptions and Methodology
25.3. Revenue Shift Analysis
25.4. Market Movement Analysis
25.5. Penetration-Growth (P-G) Matrix
25.6. E-Fuels Market in Europe: Historical Trends (Since 2020) and Forecasted Estimates (Till 2035)
25.6.1. E-Fuels Market in Austria: Historical Trends (Since 2020) and Forecasted Estimates (Till 2035)
25.6.2. E-Fuels Market in Belgium: Historical Trends (Since 2020) and Forecasted Estimates (Till 2035)
25.6.3. E-Fuels Market in Denmark: Historical Trends (Since 2020) and Forecasted Estimates (Till 2035)
25.6.4. E-Fuels Market in France: Historical Trends (Since 2020) and Forecasted Estimates (Till 2035)
25.6.5. E-Fuels Market in Germany: Historical Trends (Since 2020) and Forecasted Estimates (Till 2035)
25.6.6. E-Fuels Market in Ireland: Historical Trends (Since 2020) and Forecasted Estimates (Till 2035)
25.6.7. E-Fuels Market in Italy: Historical Trends (Since 2020) and Forecasted Estimates (Till 2035)
25.6.8. E-Fuels Market in Netherlands: Historical Trends (Since 2020) and Forecasted Estimates (Till 2035)
25.6.9. E-Fuels Market in Norway: Historical Trends (Since 2020) and Forecasted Estimates (Till 2035)
25.6.10. E-Fuels Market in Russia: Historical Trends (Since 2020) and Forecasted Estimates (Till 2035)
25.6.11. E-Fuels Market in Spain: Historical Trends (Since 2020) and Forecasted Estimates (Till 2035)
25.6.12. E-Fuels Market in Sweden: Historical Trends (Since 2020) and Forecasted Estimates (Till 2035)
25.6.13. E-Fuels Market in Switzerland: Historical Trends (Since 2020) and Forecasted Estimates (Till 2035)
25.6.14. E-Fuels Market in the UK: Historical Trends (Since 2020) and Forecasted Estimates (Till 2035)
25.6.15. E-Fuels Market in Other European Countries: Historical Trends (Since 2020) and Forecasted Estimates (Till 2035)
25.7. Data Triangulation and Validation
26. MARKET OPPORTUNITIES FOR E-FUELS IN ASIA
26.1. Chapter Overview
26.2. Key Assumptions and Methodology
26.3. Revenue Shift Analysis
26.4. Market Movement Analysis
26.5. Penetration-Growth (P-G) Matrix
26.6. E-Fuels Market in Asia: Historical Trends (Since 2020) and Forecasted Estimates (Till 2035)
26.6.1. E-Fuels Market in China: Historical Trends (Since 2020) and Forecasted Estimates (Till 2035)
26.6.2. E-Fuels Market in India: Historical Trends (Since 2020) and Forecasted Estimates (Till 2035)
26.6.3. E-Fuels Market in Japan: Historical Trends (Since 2020) and Forecasted Estimates (Till 2035)
26.6.4. E-Fuels Market in Singapore: Historical Trends (Since 2020) and Forecasted Estimates (Till 2035)
26.6.5. E-Fuels Market in South Korea: Historical Trends (Since 2020) and Forecasted Estimates (Till 2035)
26.6.6. E-Fuels Market in Other Asian Countries: Historical Trends (Since 2020) and Forecasted Estimates (Till 2035)
26.7. Data Triangulation and Validation
27. MARKET OPPORTUNITIES FOR E-FUELS IN MIDDLE EAST AND NORTH AFRICA (MENA)
27.1. Chapter Overview
27.2. Key Assumptions and Methodology
27.3. Revenue Shift Analysis
27.4. Market Movement Analysis
27.5. Penetration-Growth (P-G) Matrix
27.6. E-Fuels Market in Middle East and North Africa (MENA): Historical Trends (Since 2020) and Forecasted Estimates (Till 2035)
27.6.1. E-Fuels Market in Egypt: Historical Trends (Since 2020) and Forecasted Estimates (Till 205)
27.6.2. E-Fuels Market in Iran: Historical Trends (Since 2020) and Forecasted Estimates (Till 2035)
27.6.3. E-Fuels Market in Iraq: Historical Trends (Since 2020) and Forecasted Estimates (Till 2035)
27.6.4. E-Fuels Market in Israel: Historical Trends (Since 2020) and Forecasted Estimates (Till 2035)
27.6.5. E-Fuels Market in Kuwait: Historical Trends (Since 2020) and Forecasted Estimates (Till 2035)
27.6.6. E-Fuels Market in Saudi Arabia: Historical Trends (Since 2020) and Forecasted Estimates (Till 2035)
27.6.7. E-Fuels Market in United Arab Emirates (UAE): Historical Trends (Since 2020) and Forecasted Estimates (Till 2035)
27.6.8. E-Fuels Market in Other MENA Countries: Historical Trends (Since 2020) and Forecasted Estimates (Till 2035)