합성연료(e-fuel) 시장 : 유형별, 상태별, 최종 용도별, 용도별, 지역별 - 예측(-2030년)
E-fuels Market by Type, State, End Use, Application and Region - Global Forecast to 2030
상품코드:1800735
리서치사:MarketsandMarkets
발행일:2025년 08월
페이지 정보:영문 262 Pages
라이선스 & 가격 (부가세 별도)
ㅁ Add-on 가능: 고객의 요청에 따라 일정한 범위 내에서 Customization이 가능합니다. 자세한 사항은 문의해 주시기 바랍니다.
한글목차
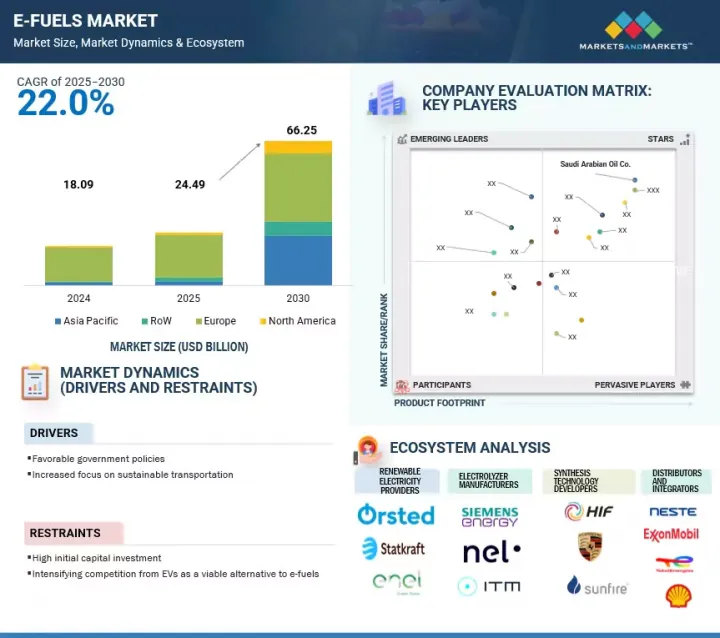
세계의 합성연료(e-fuel) 시장 규모는 2025년 244억 9,000만 달러에서 2030년까지 662억 5,000만 달러에 이를 것으로 예측되며, 예측 기간에 CAGR 22.0%의 성장이 전망됩니다.
시장은 항공, 해운, 중장비 운송 등 직접적으로 전기화가 어려운 부문의 탈탄소화 추진에 의해 주도되고 있습니다. 탄소 규제 강화, 재생 가능 연료 의무화, 정부 인센티브가 채택을 가속화하고 있습니다.
조사 범위
조사 대상 연도
2020-2030년
기준 연도
2024년
예측 기간
2025-2030년
단위
100만 달러/10억 달러, 리터
부문
유형, 상태, 최종 용도, 용도, 재생 자원, 지역
대상 지역
북미, 유럽, 아시아태평양, 기타 지역
그린 수소, 탄소 포집, Power-to-Liquid 공정의 기술 발전은 효율성과 확장성을 높입니다. 합성연료(e-fuel)는 기존 연료 인프라와 통합할 수 있기 때문에 매력적인 전환 솔루션이 될 수 있습니다. 에너지 안보에 대한 관심 증가와 기업의 지속가능성에 대한 노력은 저탄소 합성연료에 대한 세계 수요를 더욱 촉진하고 있습니다.
"연료 유형별로는 e-암모니아가 예측 기간 동안 합성연료(e-fuel) 시장에서 가장 유리한 부문이 될 것으로 예측됩니다. "
e-암모니아는 높은 수소 함량, 무탄소 연소, 다양한 활용 가능성으로 인해 연료 유형별 합성 연료(e-fuel) 시장에서 가장 큰 부문을 차지하고 있습니다. 사용 시 CO2를 배출하지 않는 중유를 대체할 수 있는 실행 가능한 연료로서, 해운 산업을 위한 청정 연료로 점점 더 많은 지지를 받고 있습니다. e-암모니아는 저장 및 운송이 용이하여 발전용 수소 운반체로서도 인기를 끌고 있습니다. 재생 가능한 수소와 질소를 이용한 그린 암모니아 생산에 대한 투자가 확대되고 있으며, 확장성이 높아지고 있습니다. 또한, 국가와 기업이 전 세계 탈탄소화 목표에 발맞추어 연구개발과 시범사업이 증가하고 있습니다. 순배출량 제로를 목표로 하는 정부의 지원 정책과 규제 인센티브가 수요를 더욱 촉진하고 있습니다. 연료와 원료라는 이중 역할로 인해 에너지 및 산업 부문 전체에서 시장에서의 입지가 강화되고 있습니다.
"상태별로는 액체 부문이 예측 기간 동안 가장 큰 부문으로 남을 것으로 예측됩니다. "
액체 부문은 기존 연료 인프라와의 호환성 및 주요 산업에서의 광범위한 사용으로 인해 합성연료(e-fuel) 시장에서 가장 큰 주별 부문으로 남을 것으로 예측됩니다. e-diesel, e-gasoline, e-kerosene, e-kerosene, e-methanol과 같은 액체 합성 연료(e-fuel)는 기존의 파이프라인, 탱크, 주유소를 이용하여 쉽게 저장, 운송, 유통할 수 있어 대규모 인프라 개발의 필요성이 감소합니다. 기존 연료의 드롭인 대체 연료로 사용할 수 있어 항공, 해상, 도로 운송에 이상적입니다. 또한, Power-to-Liquid 기술의 발전이 지속되고 있으며, 상업적 규모의 생산 설비에 대한 투자가 증가함에 따라 시장에 대한 즉각적인 대응력이 높아지고 있습니다. 특히 운송 부문에서 저탄소 액체 연료에 대한 강력한 정책적 지원은 예측 기간 동안 합성 연료(e-fuel) 시장의 액체 부문이 선도적 지위를 더욱 강화할 것으로 보입니다.
"지역별로는 아시아태평양이 예측 기간 동안 합성연료(e-fuel) 시장에서 두 번째로 큰 지역이 될 것으로 예측됩니다. "
아시아태평양은 급속한 산업화, 에너지 수요 증가, 청정 에너지 전환을 지원하기 위한 정부의 강력한 노력으로 인해 합성연료(e-fuel) 시장에서 두 번째로 큰 지역이 될 것으로 예측됩니다. 이 지역은 에너지 안보와 수입 화석연료 의존도를 낮추기 위해 노력하고 있으며, 국산 합성연료(e-fuel) 프로젝트의 성장이 가속화되고 있습니다. 또한 해운, 항공, 화학 등 탈탄소화가 어려운 부문에 대한 높은 관심이 수요를 견인하고 있습니다. 아태지역은 지지적인 정책 프레임워크, 민관 파트너십, 재생에너지 인프라에 대한 투자 증가로 인해 예측 기간 동안 세계 합성연료(e-fuel) 환경의 주요 지역으로서 위상을 더욱 강화할 것으로 보입니다. 또한, 아시아태평양의 산업 및 화학 부문은 저탄소 원료로서 합성연료(e-fuel), 특히 e-methanol과 e-암모니아에 대한 수요를 촉진하고 있습니다. 대규모 화학 제조 능력을 보유한 중국과 인도는 탄소 강도를 줄이는 친환경 대체 연료를 모색하고 있습니다.
세계의 합성연료(e-fuel) 시장에 대해 조사 분석했으며, 주요 촉진요인과 억제요인, 경쟁 구도, 향후 동향 등의 정보를 전해드립니다.
목차
제1장 서론
제2장 조사 방법
제3장 주요 요약
제4장 중요 지견
합성연료(e-fuel) 시장 기업에 있어서 매력적인 기회
합성연료(e-fuel) 시장 : 지역별
합성연료(e-fuel) 시장 : 주별
합성연료(e-fuel) 시장 : 유형별
합성연료(e-fuel) 시장 : 용도별
합성연료(e-fuel) 시장 : 용도별
유럽 합성연료(e-fuel) 시장 : 주별, 국가별
제5장 시장 개요
서론
시장 역학
성장 촉진요인
성장 억제요인
기회
과제
고객의 비즈니스에 영향을 미치는 동향/혼란
공급망 분석
생태계 분석
기술 분석
주요 기술
보완 기술
인접 기술
사례 연구 분석
특허 분석
주요 컨퍼런스 및 이벤트(2025년-2026년)
가격 결정 분석
합성연료(e-fuel) 평균 판매 가격 동향 : 유형별(2022년-2024년)
합성연료(e-fuel) 평균 판매 가격 동향 : 지역별(2022년-2024년)
무역 분석
수입 시나리오(HS코드 2814)
수출 시나리오(HS코드 2814)
규제 상황
규제기관, 정부기관 및 기타 조직
규제 구조
Porter의 Five Forces 분석
주요 이해관계자와 구입 기준
투자 및 자금조달 시나리오
합성연료(e-fuel) 시장에 대한 AI/생성형 AI의 영향
합성연료(e-fuel) 용도 AI/생성형 AI 채택
합성연료(e-fuel) 공급망에 대한 AI/생성형 AI의 영향 : 지역별
세계의 거시경제 전망
서론
탄소 중립인 모빌리티와 산업에 초점
기술 진보
자금조달과 정부 정책 지원
인플레이션 안에서의 고수준 설비 투자
합성연료(e-fuel) 시장에 대한 2025년 미국 관세의 영향
서론
주요 관세율
가격 영향 분석
국가 및 지역에 대한 영향
수입 및 수출에 대한 영향
관세 변화와 카타르 에너지의 글로벌 전자연료 시장에서의 성장
최종 용도에 대한 영향
제6장 합성연료(e-fuel) 생산에 사용되는 재생 자원
서론
태양에너지
풍력에너지
수력발전
제7장 합성연료(e-fuel) 시장 : 유형별
서론
e-메탄
e-메탄올
e-암모니아
e-가솔린
e-등유
e-디젤
제8장 합성연료(e-fuel) 시장 : 상태별
서론
기체(POWER-TO-GAS)
액체(POWER-TO-LIQUID)
제9장 합성연료(e-fuel) 시장 : 용도별
서론
연료
비연료
제10장 합성연료(e-fuel) 시장 : 용도별
서론
운송
화학제품
발전
그리드 인젝션
기타 용도
제11장 합성연료(e-fuel) 시장 : 지역별
서론
유럽
독일
노르웨이
영국
덴마크
스웨덴
기타 유럽
아시아태평양
중국
호주
인도
기타 아시아태평양
북미
미국
캐나다
기타 지역
중동 및 아프리카
남미
제12장 경쟁 구도
서론
주요 시장 진출기업의 전략/강점(2020년-2025년)
매출 분석(2020년-2024년)
시장 점유율 분석(2024년)
기업 평가와 재무 지표
제품 비교
기업 평가 매트릭스 : 주요 기업(2024년)
기업 평가 매트릭스 : 스타트업/중소기업(2024년)
경쟁 시나리오
제13장 기업 개요
주요 기업
SAUDI ARABIAN OIL CO.
AUDI AG
REPSOL
SUNFIRE SE
ELECTROCHAEA GMBH
UNIPER SE
ORSTED A/S
YARA
PERSTORP
HIF GLOBAL
INFINIUM
INERATEC GMBH
LIQUID WIND
NORSK E-FUEL
NORDIC ELECTROFUEL
EUROPEAN ENERGY
기타 기업
CARBON RECYCLING INTERNATIONAL
SYNHELION AG
ARCADIA EFUELS
SKYNRG
NATRAN
SKOVGAARD ENERGY
NESTE
TURN2X
P2X-EUROPE GMBH & CO. KG
제14장 부록
LSH
영문 목차
영문목차
The e-fuels market is estimated to reach USD 66.25 billion by 2030 from USD 24.49 billion in 2025, at a CAGR of 22.0% during the forecast period. The e-fuels market is driven by the global push for decarbonization in sectors where direct electrification is challenging, such as aviation, maritime, and heavy transport. Rising carbon regulations, renewable fuel mandates, and government incentives are accelerating adoption.
Scope of the Report
Years Considered for the Study
2020-2030
Base Year
2024
Forecast Period
2025-2030
Units Considered
Value (USD Million/Billion); Volume (Liters)
Segments
Type, State, End-use, Application, Renewable sources, and Region
Regions covered
North America, Europe, Asia Pacific, and the Rest of the World
Technological advancements in green hydrogen, carbon capture, and Power-to-Liquid processes enhance efficiency and scalability. The ability of e-fuels to integrate with existing fuel infrastructure makes them an attractive transitional solution. Increasing energy security concerns and corporate sustainability commitments also further propel demand for low-carbon, synthetic fuels worldwide.
"By fuel type, e-ammonia is projected to be the most lucrative segment of the e-fuels market during the forecast period."
E-ammonia is the largest segment of the e-fuels market by fuel type, driven by its high hydrogen content, carbon-free combustion, and diverse application potential. It is increasingly favored as a clean fuel for the maritime industry, offering a viable alternative to heavy fuel oil without producing CO2 emissions during use. E-ammonia is also gaining traction as a hydrogen carrier in power generation due to its ease of storage and transport. Growing investments in green ammonia production using renewable hydrogen and nitrogen are enhancing scalability. Additionally, countries and companies are aligning with global decarbonization goals, leading to increased R&D and pilot projects. Supportive government policies and regulatory incentives targeting net-zero emissions are further driving demand. Its dual role as both a fuel and feedstock strengthens its market position across energy and industrial sectors.
"By state, the liquid segment is expected to remain the largest segment throughout the forecast period."
The liquid segment is expected to remain the largest segment by state in the e-fuels market, primarily due to its compatibility with existing fuel infrastructure and widespread use across key industries. Liquid e-fuels such as e-diesel, e-gasoline, e-kerosene, and e-methanol can be easily stored, transported, and distributed using current pipelines, tanks, and refueling stations, reducing the need for major infrastructure overhauls. Their ability to serve as drop-in replacements for conventional fuels makes them ideal for aviation, maritime, and road transport applications. Additionally, ongoing advancements in Power-to-Liquid technologies and increasing investments in commercial-scale production facilities are enhancing their market readiness. Strong policy support for low-carbon liquid fuels, especially in the transport sector, further strengthens the liquid segment's leading position in the e-fuels market during the forecast period.
"By region, Asia Pacific is expected to be the second-largest region in the e-fuels market during the forecast period."
Asia Pacific is expected to be the second-largest region in the e-fuels market, driven by rapid industrialization, growing energy demand, and strong government initiatives supporting clean energy transitions. The region's focus on energy security and reducing reliance on imported fossil fuels is accelerating the development of domestic e-fuel projects. Additionally, a strong interest in decarbonizing hard-to-abate sectors like shipping, aviation, and chemicals is fueling demand. Supportive policy frameworks, public-private partnerships, and rising investment in renewable infrastructure further position Asia Pacific as a key player in the global e-fuels landscape during the forecast period. Moreover, Asia Pacific's industrial and chemical sectors are driving demand for e-fuels, especially e-methanol and e-ammonia, as low-carbon feedstocks. China and India, with large-scale chemical manufacturing capacities, are exploring green alternatives to reduce carbon intensity.
Breakdown of Primaries:
In-depth interviews have been conducted with various key industry participants, subject-matter experts, C-level executives of key market players, and industry consultants, among other experts, to obtain and verify critical qualitative and quantitative information and assess future market prospects. The distribution of primary interviews is as follows:
By Company Type: Tier 1- 65%, Tier 2- 24%, and Tier 3- 11%
By Designation: C-Level Executives - 30%, Managers- 25%, and Others- 45%
By Region: North America- 30%, Europe- 35%, Asia Pacific- 25%, and RoW- 10%
Note: Others include product engineers, product specialists, and engineering leads.
Note: The tiers of the companies are defined based on their total revenues as of 2023. Tier 1: > USD 1 billion, Tier 2: From USD 500 million to USD 1 billion, and Tier 3: < USD 500 million
The e-fuels market is dominated by a few major players that have a wide regional presence. The leading players in the e-fuels market are Saudi Arabian Oil Co. (Saudi Arabia), AUDI AG (Germany), Repsol (Spain), Sunfire SE (Germany), Electrochaea GmbH (Germany), Uniper SE (Germany), Orsted A/S (Denmark), Yara (Norway), Perstorp (Germany), HIF Global (US), INFINIUM (US), among others.
Study Coverage:
The report defines, describes, and forecasts the e-fuel market by size, application, and fuel type. It also offers a detailed qualitative and quantitative analysis of the market. The report provides a comprehensive review of the major market drivers, restraints, opportunities, and challenges. It also covers various important aspects of the market. These include an analysis of the competitive landscape, market dynamics, market estimates in terms of value, and future trends in the e-fuels market.
Key Benefits of Buying the Report
The e-fuels market is driven by the global shift toward decarbonization and sustainable energy solutions, particularly in sectors where direct electrification is challenging. With increasing concerns over climate change, carbon emissions, and fossil fuel dependency, e-fuels offer a carbon-neutral alternative by utilizing renewable hydrogen and captured CO2 to create synthetic fuels compatible with existing infrastructure. Their drop-in compatibility with conventional engines and fuel systems makes them ideal for hard-to-abate sectors such as aviation, shipping, heavy transport, and chemicals. As nations set ambitious net-zero targets, the demand for scalable, low-carbon liquid and gaseous fuels is rapidly growing. Supportive government policies, carbon pricing, and green fuel mandates are accelerating investment and innovation in the space. Technological advancements in Power-to-Liquid processes, carbon capture, and green hydrogen production are improving efficiency and cost viability. With growing energy security concerns and corporate sustainability goals, e-fuels are emerging as a key pillar in the global transition toward clean, circular energy systems.
Product Development/Innovation: The e-fuels market is advancing through product innovations focused on enhancing production efficiency, scalability, and environmental performance. Companies are developing advanced Power-to-Liquid (PtL) and Power-to-Gas (PtG) technologies that enable efficient conversion of renewable electricity, water, and captured CO2 into high-quality synthetic fuels. Innovations in electrolyzer technology, carbon capture systems, and reactor design are significantly improving energy conversion rates and reducing production costs. Modular and scalable e-fuel production units enable decentralized fuel generation, which is ideal for remote or off-grid applications. Integration with digital platforms supports process optimization, real-time emissions tracking, and energy flow monitoring. Furthermore, breakthroughs in catalyst development and synthetic fuel refining are improving fuel purity and engine compatibility. Research into direct air capture, co-electrolysis, and new feedstock pathways is expanding the versatility of e-fuel production. These innovations are not only accelerating commercialization but also enhancing the viability of e-fuels as a cornerstone of sustainable, net-zero energy systems.
Market Development: In October 2024, Saudi Arabian Oil Co., a global integrated energy and chemicals company, and ENOWA, NEOM's energy and water company, signed a joint development agreement to construct and establish a first-of-its-kind synthetic electro fuel (e-fuel) demonstration plant. It aims to demonstrate technical feasibility and commercial viability by producing 35 barrels per day of low-carbon, synthetic gasoline from renewable-based hydrogen and captured carbon dioxide (CO2).
Market Diversification: In May 2025, Uniper and thyssenkrupp Uhde partnered to develop a large-scale ammonia cracker plant in Gelsenkirchen, Germany, capable of converting 28 tons/day of ammonia into hydrogen. This demonstration project supports global hydrogen trade and the hydrogen import terminal in Wilhelmshaven, enabling ammonia to be an e-fuel carrier.
Competitive Assessment: Assessment of rankings of some of the key players, including of Saudi Arabian Oil Co. (Saudi Arabia), AUDI AG (Germany), Repsol (Spain), Sunfire SE (Germany), Electrochaea GmbH (Germany), Uniper SE (Germany), Orsted A/S (Denmark), Yara (Norway), Perstorp (Germany), HIF Global (US), INFINIUM (US), INERATEC GmbH (Germany), Liquid Wind (Sweden), Norsk e-fuel (Norway), Nordic Electrofuel (Norway), European Energy (Denmark) among others.
TABLE OF CONTENTS
1 INTRODUCTION
1.1 STUDY OBJECTIVES
1.2 MARKET DEFINITION
1.3 STUDY SCOPE
1.3.1 MARKETS COVERED AND REGIONAL SCOPE
1.3.2 INCLUSIONS AND EXCLUSIONS
1.3.3 YEARS CONSIDERED
1.4 CURRENCY CONSIDERED
1.5 UNIT CONSIDERED
1.6 LIMITATIONS
1.7 STAKEHOLDERS
1.8 SUMMARY OF CHANGES
2 RESEARCH METHODOLOGY
2.1 RESEARCH DATA
2.1.1 SECONDARY DATA
2.1.1.1 List of key secondary sources
2.1.1.2 Key data from secondary sources
2.1.2 PRIMARY DATA
2.1.2.1 List of primary interview participants
2.1.2.2 Key industry insights
2.1.2.3 Breakdown of primaries
2.1.2.4 Key data from primary sources
2.2 MARKET SIZE ESTIMATION
2.2.1 BOTTOM-UP APPROACH
2.2.1.1 Demand-side assumptions
2.2.1.2 Demand-side calculations
2.2.2 TOP-DOWN APPROACH
2.2.2.1 Supply-side assumptions
2.2.2.2 Supply-side calculations
2.3 MARKET BREAKDOWN AND DATA TRIANGULATION
2.4 FORECAST
2.5 RESEARCH LIMITATIONS
2.6 RISK ANALYSIS
3 EXECUTIVE SUMMARY
4 PREMIUM INSIGHTS
4.1 ATTRACTIVE OPPORTUNITIES FOR PLAYERS IN E-FUELS MARKET
4.2 E-FUELS MARKET, BY REGION
4.3 E-FUELS MARKET, BY STATE
4.4 E-FUELS MARKET, BY TYPE
4.5 E-FUELS MARKET, BY APPLICATION
4.6 E-FUELS MARKET, BY END USE
4.7 E-FUELS MARKET IN EUROPE, BY STATE AND COUNTRY
5 MARKET OVERVIEW
5.1 INTRODUCTION
5.2 MARKET DYNAMICS
5.2.1 DRIVERS
5.2.1.1 Rising implementation of supportive frameworks for low- carbon fuel adoption
5.2.1.2 Growing emphasis on sustainable transport to conform to strict emission standards
5.2.2 RESTRAINTS
5.2.2.1 High initial capital investment
5.2.2.2 Mounting adoption of electric vehicles (EVs)
5.2.3 OPPORTUNITIES
5.2.3.1 Depletion of fossil fuels and push for decarbonization
5.2.3.2 Rising need to decarbonize aviation and shipping industries
5.2.4 CHALLENGES
5.2.4.1 Requirement for significant energy for e-fuel production
5.2.4.2 Limited production capacity
5.3 TRENDS/DISRUPTIONS IMPACTING CUSTOMER BUSINESS
5.4 SUPPLY CHAIN ANALYSIS
5.5 ECOSYSTEM ANALYSIS
5.6 TECHNOLOGY ANALYSIS
5.6.1 KEY TECHNOLOGIES
5.6.1.1 Fischer-Tropsch (FT) synthesis
5.6.1.2 Methanation
5.6.1.3 Machine learning
5.6.2 COMPLEMENTARY TECHNOLOGIES
5.6.2.1 Reverse water-gas shift reaction
5.6.2.2 Electrolyzers
5.6.3 ADJACENT TECHNOLOGIES
5.6.3.1 Artificial intelligence
5.6.3.2 Advanced catalysts
5.7 CASE STUDY ANALYSIS
5.7.1 RESEARCHERS DEVELOP SIMULATION FRAMEWORK FOR MULTI-E-FUEL INFRASTRUCTURE TO DECARBONIZE HEAVY-DUTY TRANSPORT
5.7.2 HIF GLOBAL LAUNCHES HARU ONI PROJECT TO INTEGRATE RENEWABLE POWER, GREEN HYDROGEN, AND DAC-BASED CO2 CAPTURE FOR E-FUEL SYNTHESIS
5.7.3 BANKABLE FEASIBILITY STUDY SUPPORTS BIOAGRA'S TRANSITION INTO E-FUEL PRODUCTION
5.8 PATENT ANALYSIS
5.9 KEY CONFERENCES AND EVENTS, 2025-2026
5.10 PRICING ANALYSIS
5.10.1 AVERAGE SELLING PRICE TREND OF E-FUELS, BY TYPE, 2022-2024
5.10.2 AVERAGE SELLING PRICE TREND OF E-FUELS, BY REGION, 2022-2024
5.11 TRADE ANALYSIS
5.11.1 IMPORT SCENARIO (HS CODE 2814)
5.11.2 EXPORT SCENARIO (HS CODE 2814)
5.12 REGULATORY LANDSCAPE
5.12.1 REGULATORY BODIES, GOVERNMENT AGENCIES, AND OTHER ORGANIZATIONS
5.12.2 REGULATORY FRAMEWORK
5.13 PORTER'S FIVE FORCES ANALYSIS
5.13.1 THREAT OF NEW ENTRANTS
5.13.2 THREAT OF SUBSTITUTES
5.13.3 BARGAINING POWER OF SUPPLIERS
5.13.4 BARGAINING POWER OF BUYERS
5.13.5 INTENSITY OF COMPETITIVE RIVALRY
5.14 KEY STAKEHOLDERS AND BUYING CRITERIA
5.14.1 KEY STAKEHOLDERS IN BUYING PROCESS
5.14.2 BUYING CRITERIA
5.15 INVESTMENT AND FUNDING SCENARIO
5.16 IMPACT OF AI/GEN AI ON E-FUELS MARKET
5.16.1 ADOPTION OF AI/GEN AI IN E-FUEL APPLICATIONS
5.16.2 IMPACT OF AI/GEN AI ON E-FUEL SUPPLY CHAIN, BY REGION
5.17 GLOBAL MACROECONOMIC OUTLOOK
5.17.1 INTRODUCTION
5.17.2 FOCUS ON CARBON-NEUTRAL MOBILITY AND INDUSTRY
5.17.3 TECHNOLOGICAL ADVANCEMENTS
5.17.4 FINANCING AND GOVERNMENT POLICY SUPPORT
5.17.5 HIGH CAPEX AMID INFLATION
5.18 IMPACT OF 2025 US TARIFF ON E-FUELS MARKET
5.18.1 INTRODUCTION
5.18.2 KEY TARIFF RATES
5.18.3 PRICE IMPACT ANALYSIS
5.18.4 IMPACT ON COUNTRIES/REGIONS
5.18.4.1 US
5.18.4.2 Europe
5.18.4.3 Asia Pacific
5.18.5 IMPACT ON IMPORTS/EXPORTS
5.18.6 TARIFF SHIFTS AND QATAR ENERGY'S GROWTH IN GLOBAL E-FUELS SPACE
5.18.7 IMPACT ON END USES
6 RENEWABLE SOURCES USED IN E-FUEL PRODUCTION
6.1 INTRODUCTION
6.2 SOLAR ENERGY
6.3 WIND ENERGY
6.4 HYDROPOWER
7 E-FUELS MARKET, BY TYPE
7.1 INTRODUCTION
7.2 E-METHANE
7.2.1 HIGH ADAPTABILITY AND COST-EFFECTIVENESS FOR LARGE-SCALE ADOPTION TO FUEL SEGMENTAL GROWTH
7.3 E-METHANOL
7.3.1 SURGING DEMAND FOR GREEN MARINE FUELS AND CHEMICAL FEEDSTOCKS TO ACCELERATE SEGMENTAL GROWTH
7.4 E-AMMONIA
7.4.1 GROWING EMPHASIS ON SUSTAINABILITY IN FERTILIZER SECTOR TO BOLSTER SEGMENTAL GROWTH
7.5 E-GASOLINE
7.5.1 RISING IMPLEMENTATION OF CARBON PRICING AND RENEWABLE FUEL MANDATES TO EXPEDITE SEGMENTAL GROWTH
7.6 E-KEROSENE
7.6.1 ABILITY TO REDUCE LIFECYCLE GREENHOUSE GAS EMISSIONS TO CONTRIBUTE TO SEGMENTAL GROWTH
7.7 E-DIESEL
7.7.1 INCREASING REGULATORY PRESSURE TO CURB EMISSIONS FROM HEAVY-DUTY VEHICLES TO AUGMENT SEGMENTAL GROWTH
8 E-FUELS MARKET, BY STATE
8.1 INTRODUCTION
8.2 GASEOUS (POWER-TO-GAS)
8.2.1 ABILITY TO SUPPORT DECARBONIZATION EFFORTS ACROSS POWER GENERATION AND INDUSTRIAL SECTORS TO DRIVE MARKET
8.3 LIQUID (POWER-TO-LIQUID)
8.3.1 STRONG FOCUS ON SUSTAINABILITY, ENERGY SECURITY, AND EMISSION REDUCTION TO AUGMENT SEGMENTAL GROWTH
9 E-FUELS MARKET, BY APPLICATION
9.1 INTRODUCTION
9.2 FUEL
9.2.1 IMPLEMENTATION OF STRINGENT EMISSION REGULATIONS TO CONTRIBUTE TO SEGMENTAL GROWTH
9.3 NON-FUEL
9.3.1 INDUSTRIAL DECARBONIZATION AND GREEN CHEMICAL DEMAND TO BOOST SEGMENTAL GROWTH
10 E-FUELS MARKET, BY END USE
10.1 INTRODUCTION
10.2 TRANSPORTATION
10.2.1 GROWING EMPHASIS ON ACHIEVING NET-ZERO EMISSIONS TO FOSTER SEGMENTAL GROWTH
10.2.1.1 Automotive
10.2.1.2 Marine
10.2.1.3 Aviation
10.3 CHEMICALS
10.3.1 INCREASING DEVELOPMENT OF LOW-CARBON OR CLIMATE-NEUTRAL INGREDIENTS TO ACCELERATE SEGMENTAL GROWTH
10.4 POWER GENERATION
10.4.1 RISING INTEGRATION OF E-METHANE INTO ENERGY MIXES TO BALANCE INTERMITTENT RENEWABLES TO DRIVE MARKET
10.5 GRID INJECTION
10.5.1 GROWING FOCUS ON SYSTEMIC DECARBONIZATION OF THERMAL ENERGY NETWORKS TO BOLSTER SEGMENTAL GROWTH
10.6 OTHER END USES
11 E-FUELS MARKET, BY REGION
11.1 INTRODUCTION
11.2 EUROPE
11.2.1 GERMANY
11.2.1.1 High preference for renewable synthetic fuels to contribute to market growth
11.2.2 NORWAY
11.2.2.1 Growing emphasis on producing sustainable aviation fuels to boost market growth
11.2.3 UK
11.2.3.1 Rising implementation of clean ammonia and synthetic fuel projects to drive market
11.2.4 DENMARK
11.2.4.1 Increasing focus on reducing carbon dioxide emissions to foster market growth
11.2.5 SWEDEN
11.2.5.1 Growing consumption of renewable electricity to accelerate market growth
11.2.6 REST OF EUROPE
11.3 ASIA PACIFIC
11.3.1 CHINA
11.3.1.1 Mounting demand for clean fuels to achieve carbon neutrality to augment market growth
11.3.2 AUSTRALIA
11.3.2.1 Abundant renewable energy resources to contribute to market growth
11.3.3 INDIA
11.3.3.1 Rapid transition toward clean energy to meet decarbonization goals to create lucrative market growth opportunities
11.3.4 REST OF ASIA PACIFIC
11.4 NORTH AMERICA
11.4.1 US
11.4.1.1 Rising development of local supply chains for clean energy to expedite market growth
11.4.2 CANADA
11.4.2.1 Growing focus on sustainable aviation and low-carbon synthetic fuels to boost market growth
11.5 ROW
11.5.1 MIDDLE EAST & AFRICA
11.5.1.1 Strong focus on diversifying oil-dependent economies to foster market growth
11.5.2 SOUTH AMERICA
11.5.2.1 Burgeoning demand for low-carbon fuels to accelerate market growth
12 COMPETITIVE LANDSCAPE
12.1 INTRODUCTION
12.2 KEY PLAYER STRATEGIES/RIGHT TO WIN, 2020-2025
12.3 REVENUE ANALYSIS, 2020-2024
12.4 MARKET SHARE ANALYSIS, 2024
12.5 COMPANY VALUATION AND FINANCIAL METRICS
12.6 PRODUCT COMPARISON
12.7 COMPANY EVALUATION MATRIX: KEY PLAYERS, 2024
12.7.1 STARS
12.7.2 EMERGING LEADERS
12.7.3 PERVASIVE PLAYERS
12.7.4 PARTICIPANTS
12.7.5 COMPANY FOOTPRINT: KEY PLAYERS, 2024
12.7.5.1 Company footprint
12.7.5.2 Region footprint
12.7.5.3 Type footprint
12.7.5.4 State footprint
12.7.5.5 Application footprint
12.7.5.6 End use footprint
12.8 COMPANY EVALUATION MATRIX: STARTUPS/SMES, 2024