DevOps 시장 : 산업 동향 및 예측(-2035년) : 제공 구분, 전개 모델, 도구, 산업, 기업 규모 및 지역별
DevOps Market Till 2035: Distribution by Type of Offering, Type of Deployment Model, Type of Tools, Type of Industry Vertical, Company Size, and Key Geographical Regions: Industry Trends and Global Forecasts
상품코드:1787838
리서치사:Roots Analysis
발행일:On Demand Report
페이지 정보:영문 188 Pages
라이선스 & 가격 (부가세 별도)
한글목차
DevOps 시장 : 개요
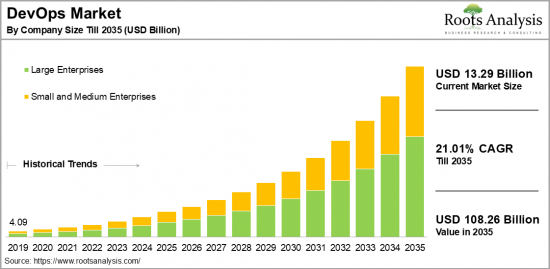
세계의 DevOps 시장 규모는 현재 132억 9,000만 달러에서 예측 기간 동안 CAGR 21.01%로 성장할 전망이고, 2035년에는 1,082억 6,000만 달러로 성장할 것으로 예측되고 있습니다.
DevOps 시장 기회 : 분류
제공 구분
서비스
솔루션
전개 모델
하이브리드 클라우드
프라이빗 클라우드
퍼블릭 클라우드
도구
개발 도구
운영 도구
테스트 도구
산업
BFSI
정부 및 공공기관
의료
제조
소매
통신 및 정보 기술 서비스(ITES)
기타
기업 규모
대기업
중소기업
지역
북미
미국
캐나다
멕시코
기타 북미 국가
유럽
오스트리아
벨기에
덴마크
프랑스
독일
아일랜드
이탈리아
네덜란드
노르웨이
러시아
스페인
스웨덴
스위스
영국
기타 유럽 국가
아시아
중국
인도
일본
싱가포르
한국
기타 아시아 국가
라틴아메리카
브라질
칠레
콜롬비아
베네수엘라
기타 라틴아메리카 국가
중동 및 북아프리카
이집트
이란
이라크
이스라엘
쿠웨이트
사우디아라비아
아랍에미리트(UAE)
기타 중동 및 북아프리카 국가
세계 기타 지역
호주
뉴질랜드
기타 국가
DevOps 시장 : 성장과 동향
DevOps는 개발 및 운영의 원칙을 결합하여 개인, 공정 및 기술을 통합하는 통합 프레임워크를 구축합니다. 주요 목표는 기존 방법에 비해 소프트웨어 개발 및 제공의 속도, 보안 및 효율성을 개선하는 것입니다. 민첩한 소프트웨어 개발 접근 방식에서 등장한 DevOps는 여러 부서의 기능을 통합한 전략을 활용하여 신속하고 반복적인 용도 배포를 촉진합니다. 지속적인 제공을 유지하고 고품질의 소프트웨어를 보장하면서 시스템 개발 라이프사이클을 단축하는 것이 목표입니다.
세계의 DevOps 시장은 조직 내에서 신속한 소프트웨어 제공 및 운영 효율성 향에 대한 요구가 증가함에 따라 상당한 확장을 경험하고 있습니다. 개발과 운영이 결합된 DevOps는 소프트웨어 개발 팀과 IT 운영 팀을 통합하여 궁극적으로 소프트웨어 개발 라이프 사이클의 속도와 품질을 모두 개선하기 위한 도구와 관행의 모음입니다. 이러한 요인으로 인해 DevOps 시장은 예측 기간 동안 상당한 성장을 보일 것으로 예상됩니다.
본 보고서에서는 세계의 DevOps 시장을 조사했으며, 시장 개요, 배경, 시장영향인자 분석, 시장 규모 추이와 예측, 각종 구분, 지역별 상세 분석, 경쟁 구도, 주요기업 프로파일 등을 정리했습니다.
목차
섹션 I : 보고서 개요
제1장 서문
제2장 조사 방법
제3장 시장 역학
제4장 거시경제지표
섹션 II : 정성적 인사이트
제5장 주요 요약
제6장 소개
제7장 규제 시나리오
섹션 III : 시장 개요
제8장 주요 기업의 종합적 데이터베이스
제9장 경쟁 구도
제10장 화이트 스페이스 분석
제11장 기업의 경쟁력 분석
제12장 DevOps 시장의 스타트업 생태계
섹션 IV : 기업 프로파일
제13장 기업 프로파일
개요
Amazon Web Services
Atlassian
Broadcom
CA Technologies
Cisco Systems
Cigniti Technologies
Dell Technologies
Docker
EMC
GitLab
Google
Hewlett Packard
IBM
Micro Focus International
Microsoft
Oracle
Puppet
Progress Chef Software
섹션 V : 시장 동향
제14장 메가트렌드 분석
제15장 미충족 요구 분석
제16장 특허 분석
제17장 최근 동향
섹션 VI : 시장 기회 분석
제18장 세계의 DevOps 시장
제19장 제공 구분별 시장 기회
제20장 전개 모델별 시장 기회
제21장 공구별 시장 기회
제22장 산업별 시장 기회
제23장 DevOps 시장 기회 : 북미
제24장 DevOps 시장 기회 : 유럽
제25장 DevOps 시장 기회 : 아시아
제26장 DevOps 시장 기회 : 중동, 북아프리카
제27장 DevOps 시장 기회 : 라틴아메리카
제28장 DevOps 시장 기회 : 세계 기타 지역
제29장 시장 집중 분석 : 주요 기업의 분포
제30장 인접 시장 분석
섹션 VII : 전략 도구
제31장 승리의 열쇠가 되는 전략
제32장 Porter's Five Forces 분석
제33장 SWOT 분석
제34장 밸류체인 분석
제35장 ROOTS의 전략 제안
섹션 VIII : 기타 독점적 인사이트
제36장 1차 조사로부터의 인사이트
제37장 보고서의 결론
섹션 IX : 부록
제38장 표 형식 데이터
제39장 기업 및 단체 일람
제40장 맞춤형 서비스 기회
제41장 ROOTS 구독 서비스
제42장 저자 상세 정보
HBR
영문 목차
영문목차
DevOps Market Overview
As per Roots Analysis, the global DevOps market size is estimated to grow from USD 13.29 billion in the current year to USD 108.26 billion by 2035, at a CAGR of 21.01% during the forecast period, till 2035.
The opportunity for devOps market has been distributed across the following segments:
Type of Offering
Services
Solutions
Type of Deployment Model
Hybrid Cloud
Private Cloud
Public Cloud
Type of Tools
Development Tools
Operation Tools
Testing Tools
Type of Industry Vertical
BFSI
Government and Public Sector
Healthcare
Manufacturing
Retail
Telecommunications and Information Technology Enabled Services (ITES)
Others
Company Size
Large Enterprises
Small and Medium Enterprises
Geographical Regions
North America
US
Canada
Mexico
Other North American countries
Europe
Austria
Belgium
Denmark
France
Germany
Ireland
Italy
Netherlands
Norway
Russia
Spain
Sweden
Switzerland
UK
Other European countries
Asia
China
India
Japan
Singapore
South Korea
Other Asian countries
Latin America
Brazil
Chile
Colombia
Venezuela
Other Latin American countries
Middle East and North Africa
Egypt
Iran
Iraq
Israel
Kuwait
Saudi Arabia
UAE
Other MENA countries
Rest of the World
Australia
New Zealand
Other countries
DEVOPS MARKET: GROWTH AND TRENDS
DevOps combines the principles of development and operations to establish a unified framework that integrates individuals, processes, and technology. Its main objective is to improve the speed, security, and efficiency of software development and delivery in comparison to conventional methods. Emerging from an agile software development approach, DevOps leverages a cross-functional strategy to facilitate rapid and iterative application deployment. It aims to shorten the system development lifecycle while maintaining continuous delivery and ensuring high-quality software.
The global market for DevOps is experiencing considerable expansion, driven by the increasing need for rapid software delivery and enhanced operational efficiency within organizations. As a blend of development and operations, DevOps comprises a collection of tools and practices intended to bring together software development and IT operations teams, ultimately improving both the speed and quality of the software development lifecycle. As a result, owing to these factors, the DevOps market is expected to experience significant growth during the forecast period.
DEVOPS MARKET: KEY SEGMENTS
Market Share by Type of Offering
Based on type of offering, the global devOps market is segmented into services and solutions. According to our estimates, currently, the services segment captures the majority share of the market. This can be attributed to the rising complexity of software development and the necessity for organizations to implement best practices in devOps. As companies aim to enhance their operational efficiency and hasten their software delivery processes, they frequently seek expert assistance in applying DevOps methodologies, which drives market expansion.
However, the solutions segment is expected to grow at a relatively higher CAGR during the forecast period. This increase is due to the growing dependence on automation and cloud-based DevOps platforms in software development.
Market Share by Type of Deployment Model
Based on type of deployment model, the devOps market is segmented into hybrid cloud, private cloud and public cloud. According to our estimates, currently, the public cloud segment captures the majority of the market. This can be attributed to its affordability, scalability, and accessibility. Organizations are showing a preference for public cloud solutions as they enable quick application deployment without the requirement of significant initial infrastructure investment.
However, the hybrid cloud segment is expected to grow at a relatively higher CAGR during the forecast period. This can be attributed to its capability to allow companies to keep sensitive data in a private environment while utilizing the scalability and flexibility of public cloud resources for less critical workloads.
Market Share by Type of Tools
Based on type of tools, the devOps market is segmented into development tools, operation tools, and testing tools. According to our estimates, currently, the development tools segment captures the majority share of the market. This can be attributed to the rising focus on improving collaboration and productivity among development teams. These tools support continuous integration and delivery (CI/CD), allowing developers to automate their workflows, manage code repositories, and optimize application deployment processes.
However, the testing tools segment is expected to grow at a relatively higher CAGR during the forecast period. This can be attributed to the heightened emphasis on quality and efficiency in software testing.
Market Share by Type of Industry Vertical
Based on type of industry vertical, the devOps market is segmented into BFSI, government and public sector, healthcare, manufacturing, retail, telecommunications and information technology enabled services (ITES) and others. According to our estimates, currently, the BFSI segment captures the majority share of the market. This growth can be attributed to the sector's essential requirement for swift software development and deployment in order to comply with regulatory requirements and improve customer service.
However, the healthcare industry is expected to grow at a relatively higher CAGR during the forecast period. This can be attributed to the rising demand for digital transformation within healthcare, including the implementation of electronic health records (EHR), telemedicine, and patient management systems.
Market Share by Company Size
Based on company size, the devOps market is segmented into large and small and medium enterprise. According to our estimates, currently, the large enterprise segment captures the majority share of the market. On the other hand, the small and medium enterprise segments are anticipated to experience a higher growth rate during the forecast period. This growth can be attributed to the adoption of devOps in businesses, their agility, innovation, focus on specialized markets, and their capability to adjust to evolving customer preferences and market dynamics..
Market Share by Geographical Regions
Based on geographical regions, the devOps market is segmented into North America, Europe, Asia, Latin America, Middle East and North Africa, and the rest of the world. According to our estimates, currently, North America captures the majority share of the market. However, the market in Asia is expected to grow at a higher CAGR during the forecast period. This growth can be attributed to the presence of large enterprises and multinational companies across various industries such as technology, finance, healthcare, and manufacturing. These businesses often face intricate IT landscapes and struggle with the management of extensive software applications and infrastructure.
Example Players in DevOps Market
Amazon Web Services
Atlassian
Broadcom
CA Technologies
Cisco Systems
Cigniti Technologies
Dell Technologies
Docker
EMC
GitLab
Google
Hewlett Packard
IBM
Micro Focus International
Microsoft
Oracle
Puppet
Progress Chef Software
RapidValue
Red Hat
Splunk sS
DEVOPS MARKET: RESEARCH COVERAGE
The report on the DevOps market features insights on various sections, including:
Market Sizing and Opportunity Analysis: An in-depth analysis of the devOps market, focusing on key market segments, including [A] type of offering, [B] type of deployment model, [C] type of tools, [D] type of industry vertical, [E] company size, and [F] key geographical regions.
Competitive Landscape: A comprehensive analysis of the companies engaged in the devOps market, based on several relevant parameters, such as [A] year of establishment, [B] company size, [C] location of headquarters and [D] ownership structure.
Company Profiles: Elaborate profiles of prominent players engaged in the devOps market, providing details on [A] location of headquarters, [B] company size, [C] company mission, [D] company footprint, [E] management team, [F] contact details, [G] financial information, [H] operating business segments, [I] devOps portfolio, [J] moat analysis, [K] recent developments, and an informed future outlook.
Megatrends: An evaluation of ongoing megatrends in devOps industry.
Patent Analysis: An insightful analysis of patents filed / granted in the devOps domain, based on relevant parameters, including [A] type of patent, [B] patent publication year, [C] patent age and [D] leading players.
Recent Developments: An overview of the recent developments made in the devOps market, along with analysis based on relevant parameters, including [A] year of initiative, [B] type of initiative, [C] geographical distribution and [D] most active players.
Porter's Five Forces Analysis: An analysis of five competitive forces prevailing in the devOps market, including threats of new entrants, bargaining power of buyers, bargaining power of suppliers, threats of substitute products and rivalry among existing competitors.
SWOT Analysis: An insightful SWOT framework, highlighting the strengths, weaknesses, opportunities and threats in the domain. Additionally, it provides Harvey ball analysis, highlighting the relative impact of each SWOT parameter.
Value Chain Analysis: A comprehensive analysis of the value chain, providing information on the different phases and stakeholders involved in the devOps market.
KEY QUESTIONS ANSWERED IN THIS REPORT
How many companies are currently engaged in devOps market?
Which are the leading companies in this market?
What factors are likely to influence the evolution of this market?
What is the current and future market size?
What is the CAGR of this market?
How is the current and future market opportunity likely to be distributed across key market segments?
REASONS TO BUY THIS REPORT
The report provides a comprehensive market analysis, offering detailed revenue projections of the overall market and its specific sub-segments. This information is valuable to both established market leaders and emerging entrants.
Stakeholders can leverage the report to gain a deeper understanding of the competitive dynamics within the market. By analyzing the competitive landscape, businesses can make informed decisions to optimize their market positioning and develop effective go-to-market strategies.
The report offers stakeholders a comprehensive overview of the market, including key drivers, barriers, opportunities, and challenges. This information empowers stakeholders to stay abreast of market trends and make data-driven decisions to capitalize on growth prospects.
ADDITIONAL BENEFITS
Complimentary Excel Data Packs for all Analytical Modules in the Report
15% Free Content Customization
Detailed Report Walkthrough Session with Research Team
Free Updated report if the report is 6-12 months old or older
TABLE OF CONTENTS
SECTION I: REPORT OVERVIEW
1. PREFACE
1.1. Introduction
1.2. Market Share Insights
1.3. Key Market Insights
1.4. Report Coverage
1.5. Key Questions Answered
1.6. Chapter Outlines
2. RESEARCH METHODOLOGY
2.1. Chapter Overview
2.2. Research Assumptions
2.3. Database Building
2.3.1. Data Collection
2.3.2. Data Validation
2.3.3. Data Analysis
2.4. Project Methodology
2.4.1. Secondary Research
2.4.1.1. Annual Reports
2.4.1.2. Academic Research Papers
2.4.1.3. Company Websites
2.4.1.4. Investor Presentations
2.4.1.5. Regulatory Filings
2.4.1.6. White Papers
2.4.1.7. Industry Publications
2.4.1.8. Conferences and Seminars
2.4.1.9. Government Portals
2.4.1.10. Media and Press Releases
2.4.1.11. Newsletters
2.4.1.12. Industry Databases
2.4.1.13. Roots Proprietary Databases
2.4.1.14. Paid Databases and Sources
2.4.1.15. Social Media Portals
2.4.1.16. Other Secondary Sources
2.4.2. Primary Research
2.4.2.1. Introduction
2.4.2.2. Types
2.4.2.2.1. Qualitative
2.4.2.2.2. Quantitative
2.4.2.3. Advantages
2.4.2.4. Techniques
2.4.2.4.1. Interviews
2.4.2.4.2. Surveys
2.4.2.4.3. Focus Groups
2.4.2.4.4. Observational Research
2.4.2.4.5. Social Media Interactions
2.4.2.5. Stakeholders
2.4.2.5.1. Company Executives (CXOs)
2.4.2.5.2. Board of Directors
2.4.2.5.3. Company Presidents and Vice Presidents
2.4.2.5.4. Key Opinion Leaders
2.4.2.5.5. Research and Development Heads
2.4.2.5.6. Technical Experts
2.4.2.5.7. Subject Matter Experts
2.4.2.5.8. Scientists
2.4.2.5.9. Doctors and Other Healthcare Providers
2.4.2.6. Ethics and Integrity
2.4.2.6.1. Research Ethics
2.4.2.6.2. Data Integrity
2.4.3. Analytical Tools and Databases
3. MARKET DYNAMICS
3.1. Forecast Methodology
3.1.1. Top-Down Approach
3.1.2. Bottom-Up Approach
3.1.3. Hybrid Approach
3.2. Market Assessment Framework
3.2.1. Total Addressable Market (TAM)
3.2.2. Serviceable Addressable Market (SAM)
3.2.3. Serviceable Obtainable Market (SOM)
3.2.4. Currently Acquired Market (CAM)
3.3. Forecasting Tools and Techniques
3.3.1. Qualitative Forecasting
3.3.2. Correlation
3.3.3. Regression
3.3.4. Time Series Analysis
3.3.5. Extrapolation
3.3.6. Convergence
3.3.7. Forecast Error Analysis
3.3.8. Data Visualization
3.3.9. Scenario Planning
3.3.10. Sensitivity Analysis
3.4. Key Considerations
3.4.1. Demographics
3.4.2. Market Access
3.4.3. Reimbursement Scenarios
3.4.4. Industry Consolidation
3.5. Robust Quality Control
3.6. Key Market Segmentations
3.7. Limitations
4. MACRO-ECONOMIC INDICATORS
4.1. Chapter Overview
4.2. Market Dynamics
4.2.1. Time Period
4.2.1.1. Historical Trends
4.2.1.2. Current and Forecasted Estimates
4.2.2. Currency Coverage
4.2.2.1. Overview of Major Currencies Affecting the Market
4.2.2.2. Impact of Currency Fluctuations on the Industry
4.2.3. Foreign Exchange Impact
4.2.3.1. Evaluation of Foreign Exchange Rates and Their Impact on Market
4.2.3.2. Strategies for Mitigating Foreign Exchange Risk
4.2.4. Recession
4.2.4.1. Historical Analysis of Past Recessions and Lessons Learnt
4.2.4.2. Assessment of Current Economic Conditions and Potential Impact on the Market
4.2.5. Inflation
4.2.5.1. Measurement and Analysis of Inflationary Pressures in the Economy
4.2.5.2. Potential Impact of Inflation on the Market Evolution
4.2.6. Interest Rates
4.2.6.1. Overview of Interest Rates and Their Impact on the Market
4.2.6.2. Strategies for Managing Interest Rate Risk
4.2.7. Commodity Flow Analysis
4.2.7.1. Type of Commodity
4.2.7.2. Origins and Destinations
4.2.7.3. Values and Weights
4.2.7.4. Modes of Transportation
4.2.8. Global Trade Dynamics
4.2.8.1. Import Scenario
4.2.8.2. Export Scenario
4.2.9. War Impact Analysis
4.2.9.1. Russian-Ukraine War
4.2.9.2. Israel-Hamas War
4.2.10. COVID Impact / Related Factors
4.2.10.1. Global Economic Impact
4.2.10.2. Industry-specific Impact
4.2.10.3. Government Response and Stimulus Measures
4.2.10.4. Future Outlook and Adaptation Strategies
4.2.11. Other Indicators
4.2.11.1. Fiscal Policy
4.2.11.2. Consumer Spending
4.2.11.3. Gross Domestic Product (GDP)
4.2.11.4. Employment
4.2.11.5. Taxes
4.2.11.6. R&D Innovation
4.2.11.7. Stock Market Performance
4.2.11.8. Supply Chain
4.2.11.9. Cross-Border Dynamics
SECTION II: QUALITATIVE INSIGHTS
5. EXECUTIVE SUMMARY
6. INTRODUCTION
6.1. Chapter Overview
6.2. Overview of DevOps Market
6.2.1. Type of Offering
6.2.2. Type of Deployment Model
6.2.3. Type of Tools
6.2.4. Type of Industry Verticals
6.3. Future Perspective
7. REGULATORY SCENARIO
SECTION III: MARKET OVERVIEW
8. COMPREHENSIVE DATABASE OF LEADING PLAYERS
9. COMPETITIVE LANDSCAPE
9.1. Chapter Overview
9.2. DevOps: Overall Market Landscape
9.2.1. Analysis by Year of Establishment
9.2.2. Analysis by Company Size
9.2.3. Analysis by Location of Headquarters
9.2.4. Analysis by Ownership Structure
10. WHITE SPACE ANALYSIS
11. COMPANY COMPETITIVENESS ANALYSIS
12. STARTUP ECOSYSTEM IN THE DEVOPS MARKET
12.1. DevOps Market: Market Landscape of Startups
12.1.1. Analysis by Year of Establishment
12.1.2. Analysis by Company Size
12.1.3. Analysis by Company Size and Year of Establishment
12.1.4. Analysis by Location of Headquarters
12.1.5. Analysis by Company Size and Location of Headquarters
12.1.6. Analysis by Ownership Structure
12.2. Key Findings
SECTION IV: COMPANY PROFILES
13. COMPANY PROFILES
13.1. Chapter Overview
13.2. Amazon Web Services*
13.2.1. Company Overview
13.2.2. Company Mission
13.2.3. Company Footprint
13.2.4. Management Team
13.2.5. Contact Details
13.2.6. Financial Performance
13.2.7. Operating Business Segments
13.2.8. Service / Product Portfolio (project specific)
13.2.9. MOAT Analysis
13.2.10. Recent Developments and Future Outlook
13.3. Atlassian
13.4. Broadcom
13.5. CA Technologies
13.6. Cisco Systems
13.7. Cigniti Technologies
13.8. Dell Technologies
13.9. Docker
13.10. EMC
13.11. GitLab
13.12. Google
13.13. Hewlett Packard
13.14. IBM
13.15. Micro Focus International
13.16. Microsoft
13.17. Oracle
13.18. Puppet
13.19. Progress Chef Software
SECTION V: MARKET TRENDS
14. MEGA TRENDS ANALYSIS
15. UNMET NEED ANALYSIS
16. PATENT ANALYSIS
17. RECENT DEVELOPMENTS
17.1. Chapter Overview
17.2. Recent Funding
17.3. Recent Partnerships
17.4. Other Recent Initiatives
SECTION VI: MARKET OPPORTUNITY ANALYSIS
18. GLOBAL DEVOPS MARKET
18.1. Chapter Overview
18.2. Key Assumptions and Methodology
18.3. Trends Disruption Impacting Market
18.4. Demand Side Trends
18.5. Supply Side Trends
18.6. Global DevOps market, Historical Trends (Since 2019) and Forecasted Estimates (Till 2035)
18.7. Multivariate Scenario Analysis
18.7.1. Conservative Scenario
18.7.2. Optimistic Scenario
18.8. Investment Feasibility Index
18.9. Key Market Segmentations
19. MARKET OPPORTUNITIES BASED ON TYPE OF OFFERING
19.1. Chapter Overview
19.2. Key Assumptions and Methodology
19.3. Revenue Shift Analysis
19.4. Market Movement Analysis
19.5. Penetration-Growth (P-G) Matrix
19.6. DevOps Market for Services: Historical Trends (Since 2019) and Forecasted Estimates (Till 2035)
19.7. DevOps Market for Solutions: Historical Trends (Since 2019) and Forecasted Estimates (Till 2035)
19.8. Data Triangulation and Validation
19.8.1. Secondary Sources
19.8.2. Primary Sources
19.8.3. Statistical Modeling
20. MARKET OPPORTUNITIES BASED ON TYPE OF DEPLOYMENT MODEL
20.1. Chapter Overview
20.2. Key Assumptions and Methodology
20.3. Revenue Shift Analysis
20.4. Market Movement Analysis
20.5. Penetration-Growth (P-G) Matrix
20.6. DevOps Market for Hybrid Cloud: Historical Trends (Since 2019) and Forecasted Estimates (Till 2035)
20.7. DevOps Market for Private Cloud: Historical Trends (Since 2019) and Forecasted Estimates (Till 2035)
20.8. DevOps Market for Public Cloud: Historical Trends (Since 2019) and Forecasted Estimates (Till 2035)
20.9. Data Triangulation and Validation
20.9.1. Secondary Sources
20.9.2. Primary Sources
20.9.3. Statistical Modeling
21. MARKET OPPORTUNITIES BASED ON TYPE OF TOOLS
21.1. Chapter Overview
21.2. Key Assumptions and Methodology
21.3. Revenue Shift Analysis
21.4. Market Movement Analysis
21.5. Penetration-Growth (P-G) Matrix
21.6. DevOps Market for Development Tools: Historical Trends (Since 2019) and Forecasted Estimates (Till 2035)
21.7. DevOps Market for Operation Tools: Historical Trends (Since 2019) and Forecasted Estimates (Till 2035)
21.8. DevOps Market for Testing Tools: Historical Trends (Since 2019) and Forecasted Estimates (Till 2035)
21.9. Data Triangulation and Validation
21.9.1. Secondary Sources
21.9.2. Primary Sources
21.9.3. Statistical Modeling
22. MARKET OPPORTUNITIES BASED ON TYPE OF INUDUSTRY VERTICAL
22.1. Chapter Overview
22.2. Key Assumptions and Methodology
22.3. Revenue Shift Analysis
22.4. Market Movement Analysis
22.5. Penetration-Growth (P-G) Matrix
22.6. DevOps Market for BFSI: Historical Trends (Since 2019) and Forecasted Estimates (Till 2035)
22.7. DevOps Market for Government and Public Sector: Historical Trends (Since 2019) and Forecasted Estimates (Till 2035)
22.8. DevOps Market for Healthcare: Historical Trends (Since 2019) and Forecasted Estimates (Till 2035)
22.9. DevOps Market for Manufacturing: Historical Trends (Since 2019) and Forecasted Estimates (Till 2035)
22.10. DevOps Market for Retail: Historical Trends (Since 2019) and Forecasted Estimates (Till 2035)
22.11. DevOps Market for Telecommunications and Information Technology Enabled Services (ITES): Historical Trends (Since 2019) and Forecasted Estimates (Till 2035)
22.12. DevOps Market for Others: Historical Trends (Since 2019) and Forecasted Estimates (Till 2035)
22.13. Data Triangulation and Validation
22.13.1. Secondary Sources
22.13.2. Primary Sources
22.13.3. Statistical Modeling
23. MARKET OPPORTUNITIES FOR DEVOPS IN NORTH AMERICA
23.1. Chapter Overview
23.2. Key Assumptions and Methodology
23.3. Revenue Shift Analysis
23.4. Market Movement Analysis
23.5. Penetration-Growth (P-G) Matrix
23.6. DevOps Market in North America: Historical Trends (Since 2019) and Forecasted Estimates (Till 2035)
23.6.1. DevOps Market in the US: Historical Trends (Since 2019) and Forecasted Estimates (Till 2035)
23.6.2. DevOps Market in Canada: Historical Trends (Since 2019) and Forecasted Estimates (Till 2035)
23.6.3. DevOps Market in Mexico: Historical Trends (Since 2019) and Forecasted Estimates (Till 2035)
23.6.4. DevOps Market in Other North American Countries: Historical Trends (Since 2019) and Forecasted Estimates (Till 2035)
23.7. Data Triangulation and Validation
24. MARKET OPPORTUNITIES FOR DEVOPS IN EUROPE
24.1. Chapter Overview
24.2. Key Assumptions and Methodology
24.3. Revenue Shift Analysis
24.4. Market Movement Analysis
24.5. Penetration-Growth (P-G) Matrix
24.6. DevOps Market in Europe: Historical Trends (Since 2019) and Forecasted Estimates (Till 2035)
24.6.1. DevOps Market in Austria: Historical Trends (Since 2019) and Forecasted Estimates (Till 2035)
24.6.2. DevOps Market in Belgium: Historical Trends (Since 2019) and Forecasted Estimates (Till 2035)
24.6.3. DevOps Market in Denmark: Historical Trends (Since 2019) and Forecasted Estimates (Till 2035)
24.6.4. DevOps Market in France: Historical Trends (Since 2019) and Forecasted Estimates (Till 2035)
24.6.5. DevOps Market in Germany: Historical Trends (Since 2019) and Forecasted Estimates (Till 2035)
24.6.6. DevOps Market in Ireland: Historical Trends (Since 2019) and Forecasted Estimates (Till 2035)
24.6.7. DevOps Market in Italy: Historical Trends (Since 2019) and Forecasted Estimates (Till 2035)
24.6.8. DevOps Market in Netherlands: Historical Trends (Since 2019) and Forecasted Estimates (Till 2035)
24.6.9. DevOps Market in Norway: Historical Trends (Since 2019) and Forecasted Estimates (Till 2035)
24.6.10. DevOps Market in Russia: Historical Trends (Since 2019) and Forecasted Estimates (Till 2035)
24.6.11. DevOps Market in Spain: Historical Trends (Since 2019) and Forecasted Estimates (Till 2035)
24.6.12. DevOps Market in Sweden: Historical Trends (Since 2019) and Forecasted Estimates (Till 2035)
24.6.13. DevOps Market in Sweden: Historical Trends (Since 2019) and Forecasted Estimates (Till 2035)
24.6.14. DevOps Market in Switzerland: Historical Trends (Since 2019) and Forecasted Estimates (Till 2035)
24.6.15. DevOps Market in the UK: Historical Trends (Since 2019) and Forecasted Estimates (Till 2035)
24.6.16. DevOps Market in Other European Countries: Historical Trends (Since 2019) and Forecasted Estimates (Till 2035)
24.7. Data Triangulation and Validation
25. MARKET OPPORTUNITIES FOR DEVOPS IN ASIA
25.1. Chapter Overview
25.2. Key Assumptions and Methodology
25.3. Revenue Shift Analysis
25.4. Market Movement Analysis
25.5. Penetration-Growth (P-G) Matrix
25.6. DevOps Market in Asia: Historical Trends (Since 2019) and Forecasted Estimates (Till 2035)
25.6.1. DevOps Market in China: Historical Trends (Since 2019) and Forecasted Estimates (Till 2035)
25.6.2. DevOps Market in India: Historical Trends (Since 2019) and Forecasted Estimates (Till 2035)
25.6.3. DevOps Market in Japan: Historical Trends (Since 2019) and Forecasted Estimates (Till 2035)
25.6.4. DevOps Market in Singapore: Historical Trends (Since 2019) and Forecasted Estimates (Till 2035)
25.6.5. DevOps Market in South Korea: Historical Trends (Since 2019) and Forecasted Estimates (Till 2035)
25.6.6. DevOps Market in Other Asian Countries: Historical Trends (Since 2019) and Forecasted Estimates (Till 2035)
25.7. Data Triangulation and Validation
26. MARKET OPPORTUNITIES FOR DEVOPS IN MIDDLE EAST AND NORTH AFRICA (MENA)
26.1. Chapter Overview
26.2. Key Assumptions and Methodology
26.3. Revenue Shift Analysis
26.4. Market Movement Analysis
26.5. Penetration-Growth (P-G) Matrix
26.6. DevOps Market in Middle East and North Africa (MENA): Historical Trends (Since 2019) and Forecasted Estimates (Till 2035)
26.6.1. DevOps Market in Egypt: Historical Trends (Since 2019) and Forecasted Estimates (Till 205)
26.6.2. DevOps Market in Iran: Historical Trends (Since 2019) and Forecasted Estimates (Till 2035)
26.6.3. DevOps Market in Iraq: Historical Trends (Since 2019) and Forecasted Estimates (Till 2035)
26.6.4. DevOps Market in Israel: Historical Trends (Since 2019) and Forecasted Estimates (Till 2035)
26.6.5. DevOps Market in Kuwait: Historical Trends (Since 2019) and Forecasted Estimates (Till 2035)
26.6.6. DevOps Market in Saudi Arabia: Historical Trends (Since 2019) and Forecasted Estimates (Till 2035)
26.6.7. DevOps Market in United Arab Emirates (UAE): Historical Trends (Since 2019) and Forecasted Estimates (Till 2035)
26.6.8. DevOps Market in Other MENA Countries: Historical Trends (Since 2019) and Forecasted Estimates (Till 2035)
26.7. Data Triangulation and Validation
27. MARKET OPPORTUNITIES FOR DEVOPS IN LATIN AMERICA
27.1. Chapter Overview
27.2. Key Assumptions and Methodology
27.3. Revenue Shift Analysis
27.4. Market Movement Analysis
27.5. Penetration-Growth (P-G) Matrix
27.6. DevOps Market in Latin America: Historical Trends (Since 2019) and Forecasted Estimates (Till 2035)
27.6.1. DevOps Market in Argentina: Historical Trends (Since 2019) and Forecasted Estimates (Till 2035)
27.6.2. DevOps Market in Brazil: Historical Trends (Since 2019) and Forecasted Estimates (Till 2035)
27.6.3. DevOps Market in Chile: Historical Trends (Since 2019) and Forecasted Estimates (Till 2035)
27.6.4. DevOps Market in Colombia Historical Trends (Since 2019) and Forecasted Estimates (Till 2035)
27.6.5. DevOps Market in Venezuela: Historical Trends (Since 2019) and Forecasted Estimates (Till 2035)
27.6.6. DevOps Market in Other Latin American Countries: Historical Trends (Since 2019) and Forecasted Estimates (Till 2035)
27.7. Data Triangulation and Validation
28. MARKET OPPORTUNITIES FOR DEVOPS IN REST OF THE WORLD
28.1. Chapter Overview
28.2. Key Assumptions and Methodology
28.3. Revenue Shift Analysis
28.4. Market Movement Analysis
28.5. Penetration-Growth (P-G) Matrix
28.6. DevOps Market in Rest of the World: Historical Trends (Since 2019) and Forecasted Estimates (Till 2035)
28.6.1. DevOps Market in Australia: Historical Trends (Since 2019) and Forecasted Estimates (Till 2035)
28.6.2. DevOps Market in New Zealand: Historical Trends (Since 2019) and Forecasted Estimates (Till 2035)
28.6.3. DevOps Market in Other Countries
28.7. Data Triangulation and Validation
29. MARKET CONCENTRATION ANALYSIS: DISTRIBUTION BY LEADING PLAYERS