세포치료 및 유전자치료 공급망 소프트웨어 시장 : 프로세스 컴포넌트별, 소프트웨어 유형별, 전개 형태별, 사업 규모별, 최종사용자 유형별, 주요 지역별 - 업계 동향과 세계 예측(- 2035년)
Cell and Gene Therapy Supply Chain Software Market by Process Component, Type of Software, Mode of Deployment, Scale of Operation, Type of End-User and Key Geographical Regions : Industry Trends and Global Forecasts, Till 2035
상품코드:1682706
리서치사:Roots Analysis
발행일:2025년 03월
페이지 정보:영문 378 Pages
라이선스 & 가격 (부가세 별도)
한글목차
세계 세포치료 및 유전자치료 공급망 소프트웨어 시장 규모는 2035년까지 예측 기간 동안 15.2%의 연평균 복합 성장률(CAGR)로 확대되어 현재 2억 7,000만 달러에서 2035년까지 13억 2,000만 달러로 성장할 것으로 예상됩니다.
첨단 치료법들은 현대 의료의 방식을 점진적으로 발전시키고 있습니다. 이러한 새로운 재생 및 면역 치료는 현재 치료 옵션이 제한적이거나 전혀 없는 환자들에게 실행 가능한 치료 솔루션을 제공함으로써 치료 결과를 개선할 수 있는 잠재력을 가지고 있습니다. 이러한 치료법의 특성상, 온도 조절된 조건에서 배송되더라도 수명이 제한되어 있습니다. 시료의 채취 시점, 현재 위치, 제조 공정에서 출처를 추적하는 것이 점점 더 중요해지고 있습니다. 이러한 사실에 따라, 이러한 치료법의 상업적 성공을 위해서는 효과적인 제조 플랫폼과 견고한 공급망 모델이 필수적입니다. 지속 가능한 공급망은 상품 비용을 더 낮출 수 있고, 결과적으로 이러한 치료제의 가격도 낮출 수 있다는 점은 주목할 만합니다.
혁신적 치료제공급망은 처음부터 복잡하며, 여러 이해관계자의 상호의존성을 고려할 때 전체 프로세스를 관리하고 간소화하는 것이 어렵습니다. 따라서 혁신가들이 공급망의 중요한 복잡성을 관리할 수 있도록 맞춤형 통합 소프트웨어 솔루션의 필요성이 증가하고 있습니다. 이러한 소프트웨어 시스템은 수많은 이벤트를 관리하고, 신원 및 보관 체인을 유지하며, 이해관계자들이 복잡한 공급망을 최적화하는 동시에 세계 규제 표준을 준수할 수 있도록 도와줄 수 있는 큰 잠재력을 가지고 있습니다. 세포 및 유전자치료에 대한 수요 증가와 세포 및 유전자치료 공급망 관리를 위한 통합이 용이한 소프트웨어 솔루션의 가용성에 힘입어 이 시장은 향후 크게 성장할 것으로 예상됩니다.
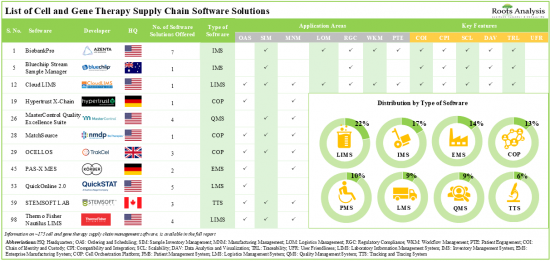
현재 약 175개의 세포치료 및 유전자치료 공급망 소프트웨어 솔루션이 시장에 나와 있으며, 그 중 22%는 실험실 정보 관리 시스템입니다.
세포치료 및 유전자치료 공급망 소프트웨어 솔루션의 20% 이상은 온프레미스와 클라우드 모두에 구축할 수 있어 최종 사용자에게 유연성과 비접촉식 옵션을 제공합니다. 세포치료 및 유전자치료 공급망 소프트웨어 공급업체들의 현재 시장 상황은 단편적이며, 신규 진입업체와 기존 업체들이 모두 존재합니다. 이 분야에 대한 관심이 높아지고 있는 것은 파트너십 활동이 활발해지고 있는 것을 보면 알 수 있습니다. 실제로 2023년에는 세포치료 및 유전자치료 공급망 소프트웨어와 관련된 40건의 파트너십 계약이 체결될 것으로 예상됩니다. 공급망 관리 소프트웨어 분야와 관련된 기회를 발견한 여러 투자자들은 지난 10년간 다양한 자금 조달 라운드를 통해 30억 달러를 투자했습니다. 기술 혁신과 파트너십 활동에 힘입어 세포치료 및 유전자치료 공급망 소프트웨어 시장은 당분간 안정적인 성장세를 보일 것으로 예상됩니다. 세포치료 및 유전자치료 공급망 소프트웨어 시장은 2035년까지 연평균 복합 성장률(CAGR) 15.2%로 성장할 것으로 예상되며, 2035년까지 북미가 시장의 대부분(45% 이상)을 차지할 것으로 예상됩니다.
세계의 세포치료 및 유전자치료 공급망 소프트웨어 시장에 대해 조사했으며, 시장 개요와 함께 프로세스 컴포넌트별, 소프트웨어 유형별, 전개 형태별, 전개 형태별, 사업 규모별, 최종사용자 유형별, 주요 지역별 동향, 시장 진출 기업 프로파일 등의 정보를 전해드립니다. 프로파일 등의 정보를 제공합니다.
목차
제1장 서문
제2장 조사 방법
제3장 경제 및 기타 프로젝트 특유의 고려사항
제4장 주요 요약
제5장 서론
제6장 시장 구도
제7장 기업 경쟁력 분석
제8장 기업 개요
제9장 자금조달과 투자 분석
제10장 파트너십 및 협업
제11장 공급망 소프트웨어 솔루션 시장 플랫폼 이용 계약
제12장 이해관계자 요구 분석
제13장 시장에 대한 영향 분석 : 성장 촉진요인 및 억제요인, 기회, 과제
제14장 세계의 세포치료 및 유전자치료 공급망 소프트웨어 시장
제15장 세포치료 및 유전자치료 공급망 소프트웨어 시장, 프로세스 컴포넌트별
제16장 세포치료 및 유전자치료 공급망 소프트웨어 시장, 소프트웨어 유형별
제17장 세포치료 및 유전자치료 공급망 소프트웨어 시장, 전개 형태별
제18장 세포치료 및 유전자치료 공급망 소프트웨어 시장, 사업 규모별
제19장 세포치료 및 유전자치료 공급망 소프트웨어 시장, 최종사용자 유형별
제20장 세포치료 및 유전자치료 공급망 소프트웨어 시장, 주요 지역별
제21장 결론
제22장 주요 인사이트
제23장 부록 1 : 표 형식 데이터
제24장 부록 2 : 기업 및 단체 리스트
LSH
영문 목차
영문목차
CELL AND GENE THERAPY SUPPLY CHAIN SOFTWARE MARKET: OVERVIEW
As per Roots Analysis, the global cell and gene therapy supply chain software market is estimated to grow from USD 0.27 billion in the current year to USD 1.32 billion by 2035, at a CAGR of 15.2% during the forecast period, till 2035.
The market opportunity for cell and gene therapy supply chain software has been distributed across the following segments:
Process Component
Sample Collection and Processing Component
Manufacturing Component
Logistics Component
Patient Identification and Treatment Follow-up Component
Type of Software
Enterprise Manufacturing System (EMS)
Laboratory Information Management System (LIMS)
Inventory Management System (IMS)
Cell Orchestration Platform (COP)
Quality Management System (QMS)
Logistics Management System (LMS)
Patient Management System (PMS)
Mode of Deployment
On-premises Deployment
Cloud-based Deployment
Type of End-User
Pharmaceutical Companies
Cell Therapy Labs
Hospitals / Medical Centers
Research Institutes / Biobanks
Scale of Operation
Clinical Scale
Commercial Scale
Key Geographical Regions
North America
Europe
Asia-Pacific
Rest of the World
CELL AND GENE THERAPY SUPPLY CHAIN SOFTWARE MARKET: GROWTH AND TRENDS
Advanced therapies are gradually evolving the face of modern healthcare. These new regenerative and immunotherapy modalities have the potential to improve treatment outcomes by providing viable therapy solutions to patients who currently have limited or no treatment options. Given the nature of these treatment modalities, these therapies have a limited lifespan, even when shipped under temperature-controlled conditions. It becomes increasingly important to track the source of the sample from the time of its collection, current location and manufacturing processes. Following this fact, for the commercial success of such therapies, an effective manufacturing platform and a robust supply chain model are imperative. It is worth mentioning that a sustainable supply chain enables further reductions in the cost of goods and, in turn, prices of such therapies.
The supply chain for innovative therapies is complicated from the outset and given the interdependencies amongst multiple stakeholders, it becomes challenging to manage and streamline the overall process. This has reinforced the need for bespoke and integrated software solutions to help innovators manage the critical intricacies of the supply chain. These software systems have huge potential to manage a multitude of events, maintain the chain of identity and custody, and enable stakeholders to optimize the complex supply chains, while also ensuring compliance with global regulatory standards. Driven by the growing demand for cell and gene therapies and the availability of easy to integrate software solutions to manage cell and gene therapy supply chain, this market is expected to grow significantly in the foreseen future.
CELL AND GENE THERAPY SUPPLY CHAIN SOFTWARE MARKET: KEY INSIGHTS
The report delves into the current state of the cell and gene therapy supply chain software market and identifies potential growth opportunities within the industry. Some key findings from the report include:
Presently, close to 175 cell and gene therapy supply chain software solutions are available in the market; of these, 22% are laboratory information management systems.
Over 20% of the cell and gene therapy supply chain software solutions can be deployed both on-premises and over the cloud, offering flexibility as well as contact-less options for the end-users.
The current market landscape of cell and gene therapy supply chain software providers is fragmented, featuring the presence of both new entrants and established players; majority of these players are based in the US.
The growing interest in this domain is evident from the rise in partnership activity; in fact, 40 partnership deals related to cell and gene therapy supply chain software were inked in 2023.
Several investors, having realized the opportunities associated within supply chain management software domain, have invested USD 3 billion across various funding rounds in the past 10 years.
Driven by the increasing pace of innovation and partnership activity, the market for cell and gene therapy supply chain software is poised to witness steady growth in the foreseeable future.
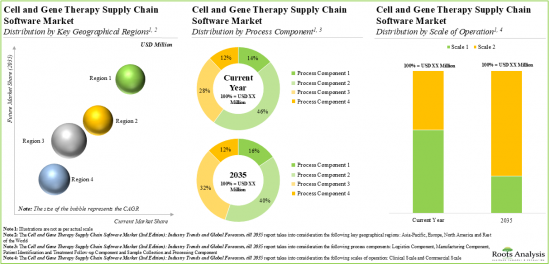
The cell and gene therapy supply chain software market is anticipated to grow at a CAGR of 15.2%, till 2035; North America is expected to capture the majority share (over 45%) of the market by 2035.
CELL AND GENE THERAPY SUPPLY CHAIN SOFTWARE MARKET: KEY SEGMENTS
Manufacturing of Cell and Gene Therapies Occupy the Largest Share of the Overall Market
Based on the process components, the market is segmented into sample collection and processing, manufacturing, logistics, and patient identification and treatment follow-up. At present, the manufacturing component holds the maximum share of the cell and gene therapy supply chain software market. This trend is unlikely to change in the near future.
Currently, Enterprise Manufacturing System (EMS) Occupies the Largest Share of the Cell and Gene Therapy Supply Chain Software Market
Based on the type of software, the market is segmented into enterprise manufacturing system, laboratory information management system, inventory management system, cell orchestration platform, quality management system, logistics management system and patient management system. At present, enterprise manufacturing system holds the maximum share of the cell and gene therapy supply chain software market. It is worth highlighting that the cell and gene therapy supply chain software market for cell orchestration platforms (COPs) is anticipated to grow at a relatively faster CAGR. This can be attributed to the fact that COPs can be easily integrated with the existing supply chain systems in order to provide end-to-end view of the entire supply chain.
Cloud-Based Software is the Fastest Growing Segment of the Cell and Gene Therapy Supply Chain Software Market During the Forecast Period
Based on the mode of deployment, the market is segmented into on-premises deployment and cloud-based deployment. It is worth highlighting that, at present, on-premises deployment holds a larger share in the cell and gene therapy supply chain software market. However, in the coming years, the market for cloud-based deployment is expected to grow at a relatively faster CAGR.
Software Solutions Used to Manage Clinical Operations Occupies the Largest Share of the Cell and Gene Therapy Supply Chain Software Market
Based on the scale of operation, the market is segmented into clinical and commercial scales. At present, software solutions used to manage clinical operations hold the maximum share of the cell and gene therapy supply chain software market. However, in the coming years, the software solutions used to manage commercial operations are anticipated to grow at a relatively faster pace. This can be attributed to the expected increase in the market approval of cell and gene therapies which are currently in the clinical stages of development.
Pharmaceutical Companies are Likely to Dominate the Cell and Gene Therapy Supply Chain Software Market During the Forecast Period
Based on the type of end-user, the market is segmented into pharmaceutical companies, cell therapy labs, hospitals / medical centers and research institutes / biobanks. Majority of the current cell and gene therapy supply chain software market is captured by the pharmaceutical companies. It is worth highlighting that the cell and gene therapy supply chain software market for cell therapy labs is anticipated to grow at a relatively faster pace.
North America Accounts for the Largest Share of the Market
Based on key geographical regions, the market is segmented into North America, Europe, Asia-Pacific and Rest of the world. Majority of the share is expected to be captured by software solution providers based in North America. It is worth highlighting that, over the years, the market in Asia-Pacific is expected to grow at a higher CAGR.
Example Players in the Cell and Gene Therapy Supply Chain Software Market
Azenta Life Sciences
Biocair
BioLife Solutions
CareDx
Cryoport
Lonza
NMDP BioTherapies
TraceLink
TrakCel
Veeva Systems
Emerson
LabVantage Solutions
Marken
MasterControl
QuickSTAT
Siemens
Stafa Cellular Therapy
Steiner
STEMSOFT Software
TECHNIDATA
Thermo Fisher Scientific
Primary Research Overview
The opinions and insights presented in this study were influenced by discussions conducted with multiple stakeholders. The research report features detailed transcripts of interviews held with the following industry stakeholders:
Former Chief Business Officer, Mid-sized Company, UK
Chief Clinical Officer, Mid-sized Company, UK
Former Senior Director, Corporate Strategy and Business Development, Very Large Company, US
International Sales and Transfusion Manager, Small Company, France
Former General Manager, Cell Therapy, Very Large Company, US
CELL AND GENE THERAPY SUPPLY CHAIN SOFTWARE MARKET: RESEARCH COVERAGE
Market Sizing and Opportunity Analysis: The report features an in-depth analysis of the cell and gene therapy supply chain software market, focusing on key market segments, including [A] process component, [B] type of software, [C] mode of deployment, [D] scale of operation and [E] key geographical regions.
Market Landscape: A comprehensive evaluation of cell and gene therapy supply chain software solutions, considering various parameters, such as [A] type of software, [B] key features, [C] application area, [D] mode of deployment, [E] scale of operation, [F] regulatory guidelines followed and [G] type of end-user. Additionally, it includes a detailed list of developers providing cell and gene therapy supply chain software solutions, along with analysis based on various parameters, such as [H] year of establishment, [I] company size (in terms of employee count), [J] location of headquarters (North America, Europe, Asia-Pacific, and rest of the world) and [K] most active players based on the number of software solutions offered.
Company Competitiveness Analysis: A comprehensive competitive analysis of cell and gene therapy supply chain software solution providers, examining factors, such as [A] developer strength and [B] product portfolio strength.
Company Profiles: In-depth profiles of key cell and gene therapy supply chain software solution providers, focusing on [A] company overviews, [B] software solutions portfolio, [C] financial information, [D] recent developments and [E] an informed future outlook.
Funding and Investment Analysis: A detailed evaluation of the investments made in this domain, encompassing seed funding, venture capital, debt financing, grants / awards, capital raised from IPOs and subsequent offerings.
Partnerships and Collaborations: An analysis of partnerships established in this sector, since 2019, covering acquisitions, platform utilization agreements, service alliances, platform integration agreements, product development agreements, service agreements and other agreements.
Platform Utilization Agreements in Supply Chain Software Solutions Market: An in-depth analysis of the platform utilization agreements inked in this domain since 2019, providing information on the different types of software utilized by end-users in the cell and gene therapy supply chain.
Stakeholder Need Analysis: A qualitative evaluation of the current and future needs of various stakeholders in the cell and gene therapy supply chain, including patients, healthcare providers, collection centers, manufacturers, logistics service providers and regulators. This section provides a summary of the distinct needs of these stakeholders and presents our opinion (drawn from historical and current trends) on the impact of these needs on the supply chain and how the industry is preparing to cater to these needs.
Market Impact Analysis: The report analyzes various factors such as drivers, restraints, opportunities, and challenges affecting the market growth.
KEY QUESTIONS ANSWERED IN THIS REPORT
How many companies are currently engaged in this market?
Which are the leading companies in this market?
What kind of partnership models are commonly adopted by industry stakeholders?
What are the factors that are likely to influence the evolution of this market?
What is the current and future market size?
What is the CAGR of this market?
How is the current and future market opportunity likely to be distributed across key market segments?
REASONS TO BUY THIS REPORT
The report provides a comprehensive market analysis, offering detailed revenue projections of the overall market and its specific sub-segments. This information is valuable to both established market leaders and emerging entrants.
Stakeholders can leverage the report to gain a deeper understanding of the competitive dynamics within the market. By analyzing the competitive landscape, businesses can make informed decisions to optimize their market positioning and develop effective go-to-market strategies.
The report offers stakeholders a comprehensive overview of the market, including key drivers, barriers, opportunities, and challenges. This information empowers stakeholders to stay abreast of market trends and make data-driven decisions to capitalize on growth prospects.
ADDITIONAL BENEFITS
Complimentary PPT Insights Packs
Complimentary Excel Data Packs for all Analytical Modules in the Report
10% Free Content Customization
Detailed Report Walkthrough Session with Research Team
Free Updated report if the report is 6-12 months old or older
TABLE OF CONTENTS
1. PREFACE
1.1. Introduction
1.2. Market Share Insights
1.3. Key Market Insights
1.4. Report Coverage
1.5. Key Questions Answered
1.6. Chapter Outlines
2. RESEARCH METHODOLOGY
2.1. Chapter Overview
2.2. Research Assumptions
2.3. Project Methodology
2.4. Forecast Methodology
2.5. Robust Quality Control
2.6. Key Market Segmentations
2.7. Key Considerations
2.7.1. Demographics
2.7.2. Economic Factors
2.7.3. Government Regulations
2.7.4. Supply Chain
2.7.5. COVID Impact
2.7.6. Market Access
2.7.7. Healthcare Policies
2.7.8. Industry Consolidation
3. ECONOMIC AND OTHER PROJECT SPECIFIC CONSIDERATIONS
3.1. Chapter Overview
3.2. Market Dynamics
3.2.1. Time Period
3.2.1.1. Historical Trends
3.2.1.2. Current and Future Estimates
3.2.2. Currency Coverage and Foreign Exchange Rate
3.2.2.1. Major Currencies Affecting the Market
3.2.2.2. Factors Affecting Currency Fluctuations and Foreign Exchange Rates
3.2.2.3. Impact of Foreign Exchange Rate Volatility on the Market
3.2.2.4. Strategies for Mitigating Foreign Exchange Risks
3.2.3. Trade Policies
3.2.3.1. Impact of Trade Barriers on the Market
3.2.3.2. Strategies for Mitigating the Risks associated with Trade Barriers
3.2.4. Recession
3.2.4.1. Historical Analysis of Past Recessions and Lessons Learnt
3.2.4.2. Assessment of Current Economic Conditions and Potential Impact on the Market
3.2.5. Inflation
3.2.5.1. Measurement and Analysis of Inflationary Pressures in the Economy
3.2.5.2. Potential Impact of Inflation on the Market Evolution
4. EXECUTIVE SUMMARY
5. INTRODUCTION
5.1. Chapter Overview
5.2. Overview of Cell Therapies
5.3. Advanced Therapy Medicinal Products (ATMPs)
5.3.1. Difference between Cell / Advanced Therapies and Other Biotechnology Products
5.4. Overview of Cell and Gene Therapy Supply Chain
5.4.1. Software Solutions for Cell and Gene Therapy Supply Chain
5.4.1.1. Enterprise Manufacturing System (EMS)
5.4.1.2. Laboratory Information Management System (LIMS)
5.4.1.3. Inventory Management System (IMS)
5.4.1.4. Quality Management System (QMS)
5.4.1.5. Logistics Management System (LMS)
5.4.1.6. Patient Management System (PMS)
5.4.1.7. Cell Orchestration Platform (COP)
5.4.2. Challenges in Cell and Advanced Therapy Supply Chain