일렉트로닉스 데이터 연감 : 제2권(2025년) - 아메리카, 일본, 아시아태평양의 일렉트로닉스 생산과 시장의 개요
Yearbook of World Electronics Data Volume 2 2025 - An Overview of Electronics Production & Markets in the Americas, Japan & Asia Pacific
상품코드:1828244
리서치사:Reed Electronics Research
발행일:2025년 09월
페이지 정보:영문
라이선스 & 가격 (부가세 별도)
한글목차
아메리카
2024년 북미 전자제품 생산액은 3,590억 달러로 미국이 전체의 79.3%를 차지했습니다. 이 지역의 저비용 생산기지 역할을 하는 멕시코는 18.2%, 캐나다는 2.5%에 불과했습니다. 2023년 기준 0.1% 감소 후 2024년 4.3% 증가, 2025년 8.2%의 큰 폭의 성장이 예상됩니다.
캐나다의 경우, 전자제품 생산량 증가율은 2022년 8.6%, 2023년 4.3% 증가한 후 주요 수출 시장 수요 감소로 2024년 1.2%로 둔화했습니다. 통신-레이더와 제어-계측이 가장 큰 부문으로 2024년 전자제품 생산액의 36.1%와 35.7%를 각각 차지했습니다. 부품 부문은 규모가 작아 2024년 생산액에서 차지하는 비중이 7.5%에 불과했습니다.
멕시코의 전자제품 생산량은 2024년 기준 6.3% 증가하며, 컴퓨팅, 산업, 통신 부문에서 성장세를 볼 수 있었습니다. 2025년에는 AI 및 데이터센터 관련 지출 증가에 힘입어 컴퓨터 생산이 30% 증가하고, 통신 생산이 6.7% 증가하지만, 산업 생산 성장 둔화와 소비자 비디오의 8.0% 감소로 인해 15.2%의 성장세가 상쇄되어 보다 건전한 15.2%의 성장세를 보일 것으로 예측됩니다.
멕시코는 OEM과 EMS/ODM 모두 북미 시장에 대응하는 생산기지로 멕시코의 저비용 거점을 활용하는 것을 고려하고 있으므로 외국인 투자의 수혜를 계속 받을 것으로 보입니다. 국내 전자부품 생태계 확장을 위한 투자는 제한적이지만, 전자기기에 대한 관심은 여전합니다.
2023년 3.9% 성장한 전자기기 생산액은 2024년 1.5%로 둔화되었습니다가 2025년 4.3% 증가로 회복될 것으로 예상되는 반면, 전자부품 생산은 2024년 11.9%의 두 자릿수 성장, 2023년 6.0% 감소 후 2025년 13.1% 증가할 것으로 예측됩니다.
미국 기업의 '리쇼어' 생산 움직임이 가속화되고 있으며, 관세 인상을 상쇄하기 위해 제조 현지화를 추진하는 미국 기업의 움직임에 따른 수혜가 예상됩니다. 그러나 미국은 대량 생산에서 멕시코와의 경쟁에 직면할 것으로 보입니다.
일본
전자제품 생산량은 2024년 5.6% 증가하여 전년도 2.8% 감소에 비해 크게 향상되었습니다. 전체의 44.7%를 차지하는 전자기기는 1.6% 증가했고, 부품은 9.0% 증가했습니다.
연초 6개월의 공식 수치에 따르면 2025년 전체 전자제품 생산량은 1.9% 증가할 것으로 예측됩니다. 이는 전자부품 생산액의 3.6% 증가가 전자기기 생산액의 1.9% 증가로 상쇄되었기 때문입니다.
반도체 부문과 수동 부품 부문은 신기술 기반 제품 및 지속적인 신규 생산 능력에 대한 투자가 강조되면서 중기적으로 일본 전자 산업의 주요 촉진요인으로 작용할 것으로 보입니다. 부품 부문은 산업 부문의 성장, IoT와 5G에 힘입은 새로운 통신 제품의 등장, 컴퓨터 부문, 특히 AI 개발을 지원하는 제품들이 지원할 것으로 예측됩니다.
아시아
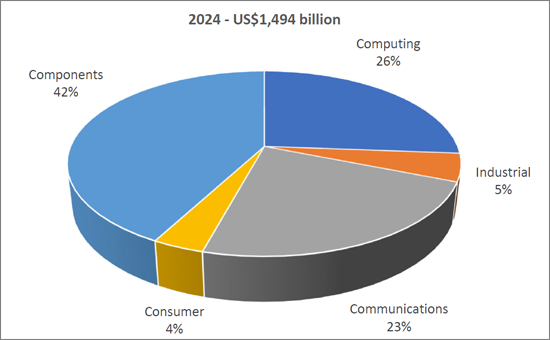
2024년 아시아의 전자기기 및 전자부품 생산액은 1조 4,940억 달러에 달하며, 그 중 전자기기 생산액은 전체의 57.8%를 차지하며, 생산액의 대부분은 컴퓨팅과 통신이 차지했습니다. 또한 아시아는 세계 전자부품 생산의 중심지이기도 합니다.
중국이 이 지역의 전자제품 생산을 독점하고 있으며, 2024년 전자제품 생산액은 총 8,010억 달러였습니다. 반도체에 주력하고 있는 대만과 한국은 2024년 전자제품 생산액이 각각 1,640억 달러와 1,620억 달러로 1,500억 달러를 넘어설 것으로 보고하고 있으며, 920억 달러의 생산액을 자랑하는 싱가포르와 830억 달러의 말레이시아도 반도체 산업으로 인해 혜택을 받고 있습니다. 저렴한 비용으로 최근 폭발적인 성장세를 보이고 있는 베트남은 휴대폰 생산의 중심지이며, 2024년 전체 전자제품 생산액은 810억 달러였습니다. 인도의 전자제품 생산량은 2024년 490억 달러로, 인도는 세계 최대 제조 거점으로서의 입지를 구축하기 위해 노력하고 있으며, 정부의 특혜가 그 성장을 지원하고 있습니다.
아시아 전자제품 생산량 : 부문별(2024년)
세계의 일렉트로닉스 산업에 대해 조사분석했으며, 아메리카, 일본, 아시아태평양 각국의 시장과 생산량 예측을 제공하고 있습니다.
목차
제1장 서론
제2장 요약 데이터
경제 개요
전자 개요
아메리카
일본
아시아
수입(2022-2023년)
수출(2022-2023년)
생산량의 통합 요약(2022년)
생산량의 통합 요약(2023년)
생산량의 통합 요약(2024년)
생산량의 통합 요약(2025년)
의료·산업 생산량의 요약
소비자 생산량의 요약
부품 생산량의 요약
능동 부품 생산량의 요약
수동 부품 생산량의 요약
기타 부품 생산량의 요약
미국, 일본, 아시아태평양의 합계 생산량
시장의 통합 요약(2022년)
시장의 통합 요약(2023년)
시장의 통합 요약(2024년)
시장의 통합 요약(2025년)
시장의 통합 요약(2026년)
시장의 통합 요약(2027년)
시장의 통합 요약(2028년)
의료·산업 시장의 요약
소비자 시장의 요약(금액)
부품 시장의 요약
능동 부품 시장의 요약
수동 부품 시장의 요약
기타 부품 시장의 요약
미국, 일본, 아시아태평양 시장 전체
제3장 각국의 데이터
호주
경제 전망
일렉트로닉스 산업의 개요
호주의 생산량
컴퓨팅(2022-2025년)
오피스 기기(2022-2025년)
제어·계장(2022-2025년)
의료·산업(2022-2025년)
통신·레이더(2022-2025년)
통신(2022-2025년)
소비자(2022-2025년)
비디오(2022-2025년)
오디오(2022-2025년)
개인(2022-2025년)
부품(2022-2025년)
능동(2022-2025년)
수동(2022-2025년)
기타(2022-2025년)
호주 시장
컴퓨팅(2022-2028년)
오피스 기기(2022-2028년)
제어·계장(2022-2028년)
의료·산업(2022-2028년)
통신·레이더(2022-2028년)
통신(2022-2028년)
소비자(2022-2028년)
비디오(2022-2028년)
오디오(2022-2028년)
개인(2022-2028년)
부품(2022-2028년)
능동(2022-2028년)
수동(2022-2028년)
기타(2022-2028년)
브라질
경제 전망
일렉트로닉스 산업의 개요
브라질의 생산량
컴퓨팅(2022-2025년)
오피스 기기(2022-2025년)
제어·계장(2022-2025년)
의료·산업(2022-2025년)
통신·레이더(2022-2025년)
통신(2022-2025년)
소비자(2022-2025년)
비디오(2022-2025년)
오디오(2022-2025년)
개인(2022-2025년)
부품(2022-2025년)
능동(2022-2025년)
수동(2022-2025년)
기타(2022-2025년)
브라질 시장
컴퓨팅(2022-2028년)
오피스 기기(2022-2028년)
제어·계장(2022-2028년)
의료·산업(2022-2028년)
통신·레이더(2022-2028년)
통신(2022-2028년)
소비자(2022-2028년)
비디오(2022-2028년)
오디오(2022-2028년)
개인(2022-2028년)
부품(2022-2028년)
능동(2022-2028년)
수동(2022-2028년)
기타(2022-2028년)
캐나다
경제 전망
일렉트로닉스 산업의 개요
캐나다의 생산량
컴퓨팅(2022-2025년)
오피스 기기(2022-2025년)
제어·계장(2022-2025년)
의료·산업(2022-2025년)
통신·레이더(2022-2025년)
통신(2022-2025년)
소비자(2022-2025년)
비디오(2022-2025년)
오디오(2022-2025년)
개인(2022-2025년)
부품(2022-2025년)
능동(2022-2025년)
수동(2022-2025년)
기타(2022-2025년)
캐나다 시장
컴퓨팅(2022-2028년)
오피스 기기(2022-2028년)
제어·계장(2022-2028년)
의료·산업(2022-2028년)
통신·레이더(2022-2028년)
통신(2022-2028년)
소비자(2022-2028년)
비디오(2022-2028년)
오디오(2022-2028년)
개인(2022-2028년)
부품(2022-2028년)
능동(2022-2028년)
수동(2022-2028년)
기타(2022-2028년)
중국
경제 전망
일렉트로닉스 산업의 개요
중국의 생산량
컴퓨팅(2022-2025년)
오피스 기기(2022-2025년)
제어·계장(2022-2025년)
의료·산업(2022-2025년)
통신·레이더(2022-2025년)
통신(2022-2025년)
소비자(2022-2025년)
비디오(2022-2025년)
오디오(2022-2025년)
개인(2022-2025년)
부품(2022-2025년)
능동(2022-2025년)
수동(2022-2025년)
기타(2022-2025년)
중국 시장
컴퓨팅(2022-2028년)
오피스 기기(2022-2028년)
제어·계장(2022-2028년)
의료·산업(2022-2028년)
통신·레이더(2022-2028년)
통신(2022-2028년)
소비자(2022-2028년)
비디오(2022-2028년)
오디오(2022-2028년)
개인(2022-2028년)
부품(2022-2028년)
능동(2022-2028년)
수동(2022-2028년)
기타(2022-2028년)
홍콩
경제 전망
일렉트로닉스 산업의 개요
홍콩 제작
컴퓨팅(2022-2025년)
오피스 기기(2022-2025년)
제어·계장(2022-2025년)
의료·산업(2022-2025년)
통신·레이더(2022-2025년)
통신(2022-2025년)
소비자(2022-2025년)
비디오(2022-2025년)
오디오(2022-2025년)
개인(2022-2025년)
부품(2022-2025년)
능동(2022-2025년)
수동(2022-2025년)
기타(2022-2025년)
홍콩 시장
컴퓨팅(2022-2028년)
오피스 기기(2022-2028년)
제어·계장(2022-2028년)
의료·산업(2022-2028년)
통신·레이더(2022-2028년)
통신(2022-2028년)
소비자(2022-2028년)
비디오(2022-2028년)
오디오(2022-2028년)
개인(2022-2028년)
부품(2022-2028년)
능동(2022-2028년)
수동(2022-2028년)
기타(2022-2028년)
인도
경제 전망
일렉트로닉스 산업의 개요
인도의 생산량
컴퓨팅(2022-2025년)
오피스 기기(2022-2025년)
제어·계장(2022-2025년)
의료·산업(2022-2025년)
통신·레이더(2022-2025년)
통신(2022-2025년)
소비자(2022-2025년)
비디오(2022-2025년)
오디오(2022-2025년)
개인(2022-2025년)
부품(2022-2025년)
능동(2022-2025년)
수동(2022-2025년)
기타(2022-2025년)
인도 시장
컴퓨팅(2022-2028년)
오피스 기기(2022-2028년)
제어·계장(2022-2028년)
의료·산업(2022-2028년)
통신·레이더(2022-2028년)
통신(2022-2028년)
소비자(2022-2028년)
비디오(2022-2028년)
오디오(2022-2028년)
개인(2022-2028년)
부품(2022-2028년)
능동(2022-2028년)
수동(2022-2028년)
기타(2022-2028년)
인도네시아
경제 전망
일렉트로닉스 산업의 개요
인도네시아의 생산량
컴퓨팅(2022-2025년)
오피스 기기(2022-2025년)
제어·계장(2022-2025년)
의료·산업(2022-2025년)
통신·레이더(2022-2025년)
통신(2022-2025년)
소비자(2022-2025년)
비디오(2022-2025년)
오디오(2022-2025년)
개인(2022-2025년)
부품(2022-2025년)
능동(2022-2025년)
수동(2022-2025년)
기타(2022-2025년)
인도네시아 시장
컴퓨팅(2022-2028년)
오피스 기기(2022-2028년)
제어·계장(2022-2028년)
의료·산업(2022-2028년)
통신·레이더(2022-2028년)
통신(2022-2028년)
소비자(2022-2028년)
소비자(2022-2028년)
비디오(2022-2028년)
오디오(2022-2028년)
개인(2022-2028년)
부품(2022-2028년)
능동(2022-2028년)
수동(2022-2028년)
기타(2022-2028년)
이스라엘
경제 전망
일렉트로닉스 산업의 개요
이스라엘 생산량
컴퓨팅(2022-2025년)
오피스 기기(2022-2025년)
제어·계장(2022-2025년)
의료·산업(2022-2025년)
통신·레이더(2022-2025년)
통신(2022-2025년)
소비자(2022-2025년)
비디오(2022-2025년)
오디오(2022-2025년)
개인(2022-2025년)
부품(2022-2025년)
능동(2022-2025년)
수동(2022-2025년)
기타(2022-2025년)
이스라엘 시장
컴퓨팅(2022-2028년)
오피스 기기(2022-2028년)
제어·계장(2022-2028년)
의료·산업(2022-2028년)
통신·레이더(2022-2028년)
통신(2022-2028년)
소비자(2022-2028년)
비디오(2022-2028년)
오디오(2022-2028년)
개인(2022-2028년)
부품(2022-2028년)
능동(2022-2028년)
수동(2022-2028년)
기타(2022-2028년)
일본
경제 전망
일렉트로닉스 산업의 개요
일본의 프로덕션
컴퓨팅(2022-2025년)
오피스 기기(2022-2025년)
제어·계장(2022-2025년)
의료·산업(2022-2025년)
통신·레이더(2022-2025년)
통신(2022-2025년)
소비자(2022-2025년)
비디오(2022-2025년)
오디오(2022-2025년)
개인(2022-2025년)
부품(2022-2025년)
능동(2022-2025년)
수동(2022-2025년)
기타(2022-2025년)
일본 시장
컴퓨팅(2022-2028년)
오피스 기기(2022-2028년)
제어·계장(2022-2028년)
의료·산업(2022-2028년)
통신·레이더(2022-2028년)
통신(2022-2028년)
소비자(2022-2028년)
비디오(2022-2028년)
오디오(2022-2028년)
개인(2022-2028년)
부품(2022-2028년)
능동(2022-2028년)
수동(2022-2028년)
기타(2022-2028년)
말레이시아
경제 전망
일렉트로닉스 산업의 개요
말레이시아의 생산량
컴퓨팅(2022-2025년)
오피스 기기(2022-2025년)
제어·계장(2022-2025년)
의료·산업(2022-2025년)
통신·레이더(2022-2025년)
통신(2022-2025년)
소비자(2022-2025년)
비디오(2022-2025년)
오디오(2022-2025년)
개인(2022-2025년)
부품(2022-2025년)
능동(2022-2025년)
수동(2022-2025년)
기타(2022-2025년)
말레이시아 시장
컴퓨팅(2022-2028년)
오피스 기기(2022-2028년)
제어·계장(2022-2028년)
의료·산업(2022-2028년)
통신·레이더(2022-2028년)
통신(2022-2028년)
소비자(2022-2028년)
비디오(2022-2028년)
오디오(2022-2028년)
개인(2022-2028년)
부품(2022-2028년)
능동(2022-2028년)
수동(2022-2028년)
기타(2022-2028년)
멕시코
경제 전망
일렉트로닉스 산업의 개요
멕시코의 생산량
컴퓨팅(2022-2025년)
오피스 기기(2022-2025년)
제어·계장(2022-2025년)
의료·산업(2022-2025년)
통신·레이더(2022-2025년)
통신(2022-2025년)
소비자(2022-2025년)
비디오(2022-2025년)
오디오(2022-2025년)
개인(2022-2025년)
부품(2022-2025년)
능동(2022-2025년)
수동(2022-2025년)
기타(2022-2025년)
멕시코 시장
컴퓨팅(2022-2028년)
오피스 기기(2022-2028년)
제어·계장(2022-2028년)
의료·산업(2022-2028년)
통신·레이더(2022-2028년)
통신(2022-2028년)
소비자(2022-2028년)
비디오(2022-2028년)
오디오(2022-2028년)
개인(2022-2028년)
부품(2022-2028년)
능동(2022-2028년)
수동(2022-2028년)
기타(2022-2028년)
필리핀
경제 전망
일렉트로닉스 산업의 개요
필리핀의 생산량
컴퓨팅(2022-2025년)
오피스 기기(2022-2025년)
제어·계장(2022-2025년)
의료·산업(2022-2025년)
통신·레이더(2022-2025년)
통신(2022-2025년)
소비자(2022-2025년)
비디오(2022-2025년)
오디오(2022-2025년)
개인(2022-2025년)
부품(2022-2025년)
능동(2022-2025년)
수동(2022-2025년)
기타(2022-2025년)
필리핀 시장
컴퓨팅(2022-2028년)
오피스 기기(2022-2028년)
제어·계장(2022-2028년)
의료·산업(2022-2028년)
통신·레이더(2022-2028년)
통신(2022-2028년)
소비자(2022-2028년)
비디오(2022-2028년)
오디오(2022-2028년)
개인(2022-2028년)
부품(2022-2028년)
능동(2022-2028년)
수동(2022-2028년)
기타(2022-2028년)
싱가포르
경제 전망
일렉트로닉스 산업의 개요
싱가포르의 생산량
컴퓨팅(2022-2025년)
오피스 기기(2022-2025년)
제어·계장(2022-2025년)
의료·산업(2022-2025년)
통신·레이더(2022-2025년)
통신(2022-2025년)
소비자(2022-2025년)
비디오(2022-2025년)
오디오(2022-2025년)
개인(2022-2025년)
부품(2022-2025년)
능동(2022-2025년)
수동(2022-2025년)
기타(2022-2025년)
싱가포르 시장
컴퓨팅(2022-2028년)
오피스 기기(2022-2028년)
제어·계장(2022-2028년)
의료·산업(2022-2028년)
통신·레이더(2022-2028년)
통신(2022-2028년)
소비자(2022-2028년)
비디오(2022-2028년)
오디오(2022-2028년)
개인(2022-2028년)
부품(2022-2028년)
능동(2022-2028년)
수동(2022-2028년)
기타(2022-2028년)
남아프리카공화국
경제 전망
일렉트로닉스 산업의 개요
남아프리카공화국의 생산량
컴퓨팅(2022-2025년)
오피스 기기(2022-2025년)
제어·계장(2022-2025년)
의료·산업(2022-2025년)
통신·레이더(2022-2025년)
통신(2022-2025년)
소비자(2022-2025년)
비디오(2022-2025년)
오디오(2022-2025년)
개인(2022-2025년)
부품(2022-2025년)
능동(2022-2025년)
수동(2022-2025년)
기타(2022-2025년)
남아프리카공화국 시장
컴퓨팅(2022-2028년)
오피스 기기(2022-2028년)
제어·계장(2022-2028년)
의료·산업(2022-2028년)
통신·레이더(2022-2028년)
통신(2022-2028년)
소비자(2022-2028년)
비디오(2022-2028년)
오디오(2022-2028년)
개인(2022-2028년)
부품(2022-2028년)
능동(2022-2028년)
수동(2022-2028년)
기타(2022-2028년)
한국
경제 전망
일렉트로닉스 산업의 개요
한국의 생산량
컴퓨팅(2022-2025년)
오피스 기기(2022-2025년)
제어·계장(2022-2025년)
의료·산업(2022-2025년)
통신·레이더(2022-2025년)
통신(2022-2025년)
소비자(2022-2025년)
비디오(2022-2025년)
오디오(2022-2025년)
개인(2022-2025년)
부품(2022-2025년)
능동(2022-2025년)
수동(2022-2025년)
기타(2022-2025년)
한국 시장
컴퓨팅(2022-2028년)
오피스 기기(2022-2028년)
제어·계장(2022-2028년)
의료·산업(2022-2028년)
통신·레이더(2022-2028년)
통신(2022-2028년)
소비자(2022-2028년)
비디오(2022-2028년)
오디오(2022-2028년)
개인(2022-2028년)
부품(2022-2028년)
능동(2022-2028년)
수동(2022-2028년)
기타(2022-2028년)
대만
경제 전망
일렉트로닉스 산업의 개요
대만의 생산량
컴퓨팅(2022-2025년)
오피스 기기(2022-2025년)
제어·계장(2022-2025년)
의료·산업(2022-2025년)
통신·레이더(2022-2025년)
통신(2022-2025년)
소비자(2022-2025년)
비디오(2022-2025년)
오디오(2022-2025년)
개인(2022-2025년)
부품(2022-2025년)
능동(2022-2025년)
수동(2022-2025년)
기타(2022-2025년)
대만 시장
컴퓨팅(2022-2028년)
오피스 기기(2022-2028년)
제어·계장(2022-2028년)
의료·산업(2022-2028년)
통신·레이더(2022-2028년)
통신(2022-2028년)
소비자(2022-2028년)
비디오(2022-2028년)
오디오(2022-2028년)
개인(2022-2028년)
부품(2022-2028년)
능동(2022-2028년)
수동(2022-2028년)
기타(2022-2028년)
태국
경제 전망
일렉트로닉스 산업의 개요
태국 생산량
컴퓨팅(2022-2025년)
오피스 기기(2022-2025년)
제어·계장(2022-2025년)
의료·산업(2022-2025년)
통신·레이더(2022-2025년)
통신(2022-2025년)
소비자(2022-2025년)
비디오(2022-2025년)
오디오(2022-2025년)
개인(2022-2025년)
부품(2022-2025년)
능동(2022-2025년)
수동(2022-2025년)
기타(2022-2025년)
태국 시장
컴퓨팅(2022-2028년)
오피스 기기(2022-2028년)
제어·계장(2022-2028년)
의료·산업(2022-2028년)
통신·레이더(2022-2028년)
통신(2022-2028년)
소비자(2022-2028년)
비디오(2022-2028년)
오디오(2022-2028년)
개인(2022-2028년)
부품(2022-2028년)
능동(2022-2028년)
수동(2022-2028년)
기타(2022-2028년)
미국
경제 전망
일렉트로닉스 산업의 개요
미국의 생산량
컴퓨팅(2022-2025년)
오피스 기기(2022-2025년)
제어·계장(2022-2025년)
의료·산업(2022-2025년)
통신·레이더(2022-2025년)
통신(2022-2025년)
소비자(2022-2025년)
비디오(2022-2025년)
오디오(2022-2025년)
개인(2022-2025년)
부품(2022-2025년)
능동(2022-2025년)
수동(2022-2025년)
기타(2022-2025년)
미국 시장
컴퓨팅(2022-2028년)
오피스 기기(2022-2028년)
제어·계장(2022-2028년)
의료·산업(2022-2028년)
통신·레이더(2022-2028년)
통신(2022-2028년)
소비자(2022-2028년)
비디오(2022-2028년)
오디오(2022-2028년)
개인(2022-2028년)
부품(2022-2028년)
능동(2022-2028년)
수동(2022-2028년)
기타(2022-2028년)
베트남
경제 전망
일렉트로닉스 산업의 개요
베트남의 생산량
컴퓨팅(2022-2025년)
오피스 기기(2022-2025년)
제어·계장(2022-2025년)
의료·산업(2022-2025년)
통신·레이더(2022-2025년)
통신(2022-2025년)
소비자(2022-2025년)
비디오(2022-2025년)
오디오(2022-2025년)
개인(2022-2025년)
부품(2022-2025년)
능동(2022-2025년)
수동(2022-2025년)
기타(2022-2025년)
베트남 시장
컴퓨팅(2022-2028년)
오피스 기기(2022-2028년)
제어·계장(2022-2028년)
의료·산업(2022-2028년)
통신·레이더(2022-2028년)
통신(2022-2028년)
소비자(2022-2028년)
비디오(2022-2028년)
오디오(2022-2028년)
개인(2022-2028년)
부품(2022-2028년)
능동(2022-2028년)
수동(2022-2028년)
기타(2022-2028년)
제4장 부록
KSA
영문 목차
영문목차
Introduction
In providing the forecasts for the current study, which were made at the end of July/beginning of August, we have:
Taken into accounts developments in the European and global economy, and the on-going impact of tariffs on growth.
That the impact of inventory balancing across several segments and notably industrial eased over the final months of 2024 with orders normalising in the first half of 2025.
Component prices and shortages normalised in 2024 although tariffs have put pressure on prices in 2025.
Consumer spending will remain subdued due to the combination of higher inflation and on-going geopolitical uncertainty.
AI and data centre consumption will be a key driver of growth in the overall computer market in 2025 and 2026. We also expect demand to feed through to higher computer equipment production.
Americas
In 2024, electronics production in North America amounted to US$359 billion with the US dominating accounting for 79.3% of the total. Mexico, which acts as the low-cost production base for the region, 18.2% while Canada accounted for only 2.5%. After declining in US dollars by 0.1% in 2023, growth increased by 4.3% in 2024 and is forecast to grow by a more substantial 8.2% in 2025.
In Canada the growth in electronics output after increasing by 8.6% and 4.3% in 2022 and 2023, respectively eased to 1.2% in 2024 in part due to lower demand from key export markets. Communications and radar and control and instrumentation represented the largest segments accounting for 36.1% and 35.7% of electronics output, respectively in 2024. The component segment is small, accounting for only 7.5% of output in 2024.
In US dollars electronics output in Mexico increased by 6.3% in 2024 with growth seen across the computing, industrial and communications segments. Growth is forecast to increase by a more robust 15.2% in 2025 led by a 30% increase in computer output on the back of growth in AI and data centre related spending, and a 6.7% increase in communications production with this offset by slower growth in industrial and an 8.0% decline in consumer video.
Mexico will continue to benefit from foreign investment as both OEMs and EMS/ODMs look to utilise low-costs sites in the country as a production base to serve the North American market. The focus will remain on electronics equipment with limited investment expected in expanding the country's electronic components ecosystem.
After growth of 3.9% in 2023 the production of electronics equipment eased to 1.5% in 2024 but is forecast to rebound and increase by 4.3% in 2025 while electronics component output is forecast to increase by 13.1% in 2025 after posting double-digit growth of 11.9% in 2024 and a 6.0% decline in 2023.
The move by US companies to "re-shore" production has gained momentum and is expected to benefit from the move by US companies to localise manufacturing to offset higher tariffs. However, the US will face competition from Mexico for high-volume manufacturing.
Japan
Electronics output increased by 5.6% in 2024, a marked improvement compared to the prior year's decline of 2.8%. Electronics equipment, which accounted for 44.7% of the total, increased by 1.6% while components increased by 9.0%.
Based on official figures for the first six months of the year overall electronics output is forecast to increase by 1.9% in 2025, a 3.6% rise in electronic component production offset by a 1.9% increase in electronics equipment output.
The semiconductor and passive components sectors will continue to be the principal drivers of the Japanese electronics industry over the medium-term with the focus on products based on the latest technologies and continued investment in new capacity. The component sector will be supported by growth in the industrial segment, the emergence of new communication products driven by Internet of Things and 5G and the computer segment, in particular products supporting the development of AI.
Asia
In 2024, the production of electronics equipment and components in Asia was valued at US$1,494 billion of which electronics equipment production accounted for 57.8% of the total with output dominated by computing and communications. Asia is also the centre for electronic component output globally.
China dominates electronics production in the region with total electronics output valued at US$801 billion in 2024. Taiwan and South Korea, with their strong focus on semiconductors, both reported electronics production of over US$150 billion in 2024 at US$164 billion and US$162 billion, respectively while Singapore with output of US$92 billion and Malaysia US$83 billion also benefited from an established semiconductor industry. Vietnam, which due to its lowcosts has seen explosive growth in recent years, is a major centre for the production of mobile phones with overall electronics output of US$81 billion in 2024. Electronics production in India was valued at US$49 billion in 2024 growth being supported by government incentives as the country looks to establish itself as a major global manufacturing hub.
Asian Electronics Production by Sector 2024
Published since 1983 Volume 2 of the Yearbook of World Electronics Data provides:
A single source solution allowing you to track the electronics industry in 19 countries in the Americas, Japan and Asia Pacific.
13 major product groups.
Market and production forecasts.
CD-option allows you to manipulate the data quickly and easily: produce your own subsets or summaries of the data, create your own forecasts or cut and paste the data into your own in-house reports and presentations.
Who will benefit ?
The Yearbook is essential research providing key data for all areas of the electronics industry including:
Distributors and manufacturers of electronic components and materials.
Suppliers of electronic production equipment.
OEMs.
EMS Providers.
Government, including investment organizations.
Financial and industry analysts.
Academic institutes & universities tracking developments in the electronics industry.
The Yearbook of World Electronics Data - tracking developments in the global electronics industry
With a history now extending over 50 years, the first edition of the Volume 1 of the Yearbook of World Electronics Data was first published in 1973, the Yearbook series has been extended to cover 53 countries globally to provide an invaluable and unique insight into the global trends, regional variations and the underlying state of the global electronics market for all stages of the supply chain - OEM, contract manufacturing and design, components and materials suppliers to financial /industry analysts and government and academia.
Although encompassing a range of published and bespoke products the core of RER's research programme is one of the most comprehensive statistical databases covering the global electronics industry, with the resulting analysis being published through three concise and clear demographic volumes, as a series of individual country reports, through customised solutions to meet specific client requirements and a series of Excel databases providing the combination of both historical and forecasted data.
53 country coverage, 13 major product groups ... comparable country by country and product by product.
TABLE OF CONTENTS
1. INTRODUCTION
2. SUMMARY DATA
2.1. Economic Overview
2.2. Electronics Overview
2.2.1. Americas
2.2.2. Japan
2.2.3. Asia
2.3. Imports 2022-2023
2.4. Exports 2022-2023
2.5. Consolidated Summary of Production 2022
2.6. Consolidated Summary of Production 2023
2.7. Consolidated Summary of Production 2024
2.8. Consolidated Summary of Production 2025
2.9. Summary of Medical & Industrial Production
2.10. Summary of Consumer Production
2.11. Summary of Components Production
2.12. Summary of Active Component Production
2.13. Summary of Passive Component Production
2.14. Summary of Other Component Production
2.15. America, Japan, Asia Pacific Total Production
2.16. Consolidated Summary of Markets 2022
2.17. Consolidated Summary of Markets 2023
2.18. Consolidated Summary of Markets 2024
2.19. Consolidated Summary of Markets 2025
2.20. Consolidated Summary of Markets 2026
2.21. Consolidated Summary of Markets 2027
2.22. Consolidated Summary of Markets 2028
2.23. Summary of Medical & Industrial Markets
2.24. Summary of Consumer Markets (Value)
2.25. Summary of Components Markets
2.26. Summary of Active Component Markets
2.27. Summary of Passive Component Markets
2.28. Summary of Other Component Markets
2.29. America, Japan, Asia Pacific Total Markets
3. COUNTRY DATA
3.1. AUSTRALIA
3.1.1. Economic Outlook
3.1.2. Electronics Industry Overview
3.1.3. Australia Production
Computing 2022-2025
Office Equipment 2022-2025
Control & Instrumentation 2022-2025
Medical & Industrial 2022-2025
Communications & Radar 2022-2025
Telecommunications 2022-2025
Consumer 2022-2025
Video 2022-2025
Audio 2022-2025
Personal 2022-2025
Components 2022-2025
Active 2022-2025
Passive 2022-2025
Other 2022-2025
3.1.4. Australia Markets
Computing 2022-2028
Office Equipment 2022-2028
Control & Instrumentation 2022-2028
Medical & Industrial 2022-2028
Communications & Radar 2022-2028
Telecommunications 2022-2028
Consumer 2022-2028
Video 2022-2028
Audio 2022-2028
Personal 2022-2028
Components 2022-2028
Active 2022-2028
Passive 2022-2028
Other 2022-2028
3.2. BRAZIL
3.2.1. Economic Outlook
3.2.2. Electronics Industry Overview
3.2.3. Brazil Production
Computing 2022-2025
Office Equipment 2022-2025
Control & Instrumentation 2022-2025
Medical & Industrial 2022-2025
Communications & Radar 2022-2025
Telecommunications 2022-2025
Consumer 2022-2025
Video 2022-2025
Audio 2022-2025
Personal 2022-2025
Components 2022-2025
Active 2022-2025
Passive 2022-2025
Other 2022-2025
3.2.4. Brazil Markets
Computing 2022-2028
Office Equipment 2022-2028
Control & Instrumentation 2022-2028
Medical & Industrial 2022-2028
Communications & Radar 2022-2028
Telecommunications 2022-2028
Consumer 2022-2028
Video 2022-2028
Audio 2022-2028
Personal 2022-2028
Components 2022-2028
Active 2022-2028
Passive 2022-2028
Other 2022-2028
3.3. CANADA
3.3.1. Economic Outlook
3.3.2. Electronics Industry Overview
3.3.3. Canada Production
Computing 2022-2025
Office Equipment 2022-2025
Control & Instrumentation 2022-2025
Medical & Industrial 2022-2025
Communications & Radar 2022-2025
Telecommunications 2022-2025
Consumer 2022-2025
Video 2022-2025
Audio 2022-2025
Personal 2022-2025
Components 2022-2025
Active 2022-2025
Passive 2022-2025
Other 2022-2025
3.3.4. Canada Markets
Computing 2022-2028
Office Equipment 2022-2028
Control & Instrumentation 2022-2028
Medical & Industrial 2022-2028
Communications & Radar 2022-2028
Telecommunications 2022-2028
Consumer 2022-2028
Video 2022-2028
Audio 2022-2028
Personal 2022-2028
Components 2022-2028
Active 2022-2028
Passive 2022-2028
Other 2022-2028
3.4. CHINA
3.4.1. Economic Outlook
3.4.2. Electronics Industry Overview
3.4.3. China Production
Computing 2022-2025
Office Equipment 2022-2025
Control & Instrumentation 2022-2025
Medical & Industrial 2022-2025
Communications & Radar 2022-2025
Telecommunications 2022-2025
Consumer 2022-2025
Video 2022-2025
Audio 2022-2025
Personal 2022-2025
Components 2022-2025
Active 2022-2025
Passive 2022-2025
Other 2022-2025
3.4.4. China Markets
Computing 2022-2028
Office Equipment 2022-2028
Control & Instrumentation 2022-2028
Medical & Industrial 2022-2028
Communications & Radar 2022-2028
Telecommunications 2022-2028
Consumer 2022-2028
Video 2022-2028
Audio 2022-2028
Personal 2022-2028
Components 2022-2028
Active 2022-2028
Passive 2022-2028
Other 2022-2028
3.5. HONG KONG
3.5.1. Economic Outlook
3.5.2. Electronics Industry Overview
3.5.3. Hong Kong Production
Computing 2022-2025
Office Equipment 2022-2025
Control & Instrumentation 2022-2025
Medical & Industrial 2022-2025
Communications & Radar 2022-2025
Telecommunications 2022-2025
Consumer 2022-2025
Video 2022-2025
Audio 2022-2025
Personal 2022-2025
Components 2022-2025
Active 2022-2025
Passive 2022-2025
Other 2022-2025
3.5.4. Hong Kong Markets
Computing 2022-2028
Office Equipment 2022-2028
Control & Instrumentation 2022-2028
Medical & Industrial 2022-2028
Communications & Radar 2022-2028
Telecommunications 2022-2028
Consumer 2022-2028
Video 2022-2028
Audio 2022-2028
Personal 2022-2028
Components 2022-2028
Active 2022-2028
Passive 2022-2028
Other 2022-2028
3.6. INDIA
3.6.1. Economic Outlook
3.6.2. Electronics Industry Overview
3.6.3. India Production
Computing 2022-2025
Office Equipment 2022-2025
Control & Instrumentation 2022-2025
Medical & Industrial 2022-2025
Communications & Radar 2022-2025
Telecommunications 2022-2025
Consumer 2022-2025
Video 2022-2025
Audio 2022-2025
Personal 2022-2025
Components 2022-2025
Active 2022-2025
Passive 2022-2025
Other 2022-2025
3.6.4. India Markets
Computing 2022-2028
Office Equipment 2022-2028
Control & Instrumentation 2022-2028
Medical & Industrial 2022-2028
Communications & Radar 2022-2028
Telecommunications 2022-2028
Consumer 2022-2028
Video 2022-2028
Audio 2022-2028
Personal 2022-2028
Components 2022-2028
Active 2022-2028
Passive 2022-2028
Other 2022-2028
3.7. INDONESIA
3.7.1. Economic Outlook
3.7.2. Electronics Industry Overview
3.7.3. Indonesia Production
Computing 2022-2025
Office Equipment 2022-2025
Control & Instrumentation 2022-2025
Medical & Industrial 2022-2025
Communications & Radar 2022-2025
Telecommunications 2022-2025
Consumer 2022-2025
Video 2022-2025
Audio 2022-2025
Personal 2022-2025
Components 2022-2025
Active 2022-2025
Passive 2022-2025
Other 2022-2025
3.7.4. Indonesia Markets
Computing 2022-2028
Office Equipment 2022-2028
Control & Instrumentation 2022-2028
Medical & Industrial 2022-2028
Communications & Radar 2022-2028
Telecommunications 2022-2028
Consumer 2022-2028
Consumer 2022-2028
Video 2022-2028
Audio 2022-2028
Personal 2022-2028
Components 2022-2028
Active 2022-2028
Passive 2022-2028
Other 2022-2028
3.8. ISRAEL
3.8.1. Economic Outlook
3.8.2. Electronics Industry Overview
3.8.3. Israel Production
Computing 2022-2025
Office Equipment 2022-2025
Control & Instrumentation 2022-2025
Medical & Industrial 2022-2025
Communications & Radar 2022-2025
Telecommunications 2022-2025
Consumer 2022-2025
Video 2022-2025
Audio 2022-2025
Personal 2022-2025
Components 2022-2025
Active 2022-2025
Passive 2022-2025
Other 2022-2025
3.8.4. Israel Markets
Computing 2022-2028
Office Equipment 2022-2028
Control & Instrumentation 2022-2028
Medical & Industrial 2022-2028
Communications & Radar 2022-2028
Telecommunications 2022-2028
Consumer 2022-2028
Video 2022-2028
Audio 2022-2028
Personal 2022-2028
Components 2022-2028
Active 2022-2028
Passive 2022-2028
Other 2022-2028
3.9. JAPAN
3.9.1. Economic Outlook
3.9.2. Electronics Industry Overview
3.9.3. Japan Production
Computing 2022-2025
Office Equipment 2022-2025
Control & Instrumentation 2022-2025
Medical & Industrial 2022-2025
Communications & Radar 2022-2025
Telecommunications 2022-2025
Consumer 2022-2025
Video 2022-2025
Audio 2022-2025
Personal 2022-2025
Components 2022-2025
Active 2022-2025
Passive 2022-2025
Other 2022-2025
3.9.4. Japan Markets
Computing 2022-2028
Office Equipment 2022-2028
Control & Instrumentation 2022-2028
Medical & Industrial 2022-2028
Communications & Radar 2022-2028
Telecommunications 2022-2028
Consumer 2022-2028
Video 2022-2028
Audio 2022-2028
Personal 2022-2028
Components 2022-2028
Active 2022-2028
Passive 2022-2028
Other 2022-2028
3.10. MALAYSIA
3.10.1. Economic Outlook
3.10.2. Electronics Industry Overview
3.10.3. Malaysia Production
Computing 2022-2025
Office Equipment 2022-2025
Control & Instrumentation 2022-2025
Medical & Industrial 2022-2025
Communications & Radar 2022-2025
Telecommunications 2022-2025
Consumer 2022-2025
Video 2022-2025
Audio 2022-2025
Personal 2022-2025
Components 2022-2025
Active 2022-2025
Passive 2022-2025
Other 2022-2025
3.10.4. Malaysia Markets
Computing 2022-2028
Office Equipment 2022-2028
Control & Instrumentation 2022-2028
Medical & Industrial 2022-2028
Communications & Radar 2022-2028
Telecommunications 2022-2028
Consumer 2022-2028
Video 2022-2028
Audio 2022-2028
Personal 2022-2028
Components 2022-2028
Active 2022-2028
Passive 2022-2028
Other 2022-2028
3.11. MEXICO
3.11.1. Economic Outlook
3.11.2. Electronics Industry Overview
3.11.3. Mexico Production
Computing 2022-2025
Office Equipment 2022-2025
Control & Instrumentation 2022-2025
Medical & Industrial 2022-2025
Communications & Radar 2022-2025
Telecommunications 2022-2025
Consumer 2022-2025
Video 2022-2025
Audio 2022-2025
Personal 2022-2025
Components 2022-2025
Active 2022-2025
Passive 2022-2025
Other 2022-2025
3.11.4. Mexico Markets
Computing 2022-2028
Office Equipment 2022-2028
Control & Instrumentation 2022-2028
Medical & Industrial 2022-2028
Communications & Radar 2022-2028
Telecommunications 2022-2028
Consumer 2022-2028
Video 2022-2028
Audio 2022-2028
Personal 2022-2028
Components 2022-2028
Active 2022-2028
Passive 2022-2028
Other 2022-2028
3.12. PHILIPPINES
3.12.1. Economic Outlook
3.12.2. Electronics Industry Overview
3.12.3. Philippines Production
Computing 2022-2025
Office Equipment 2022-2025
Control & Instrumentation 2022-2025
Medical & Industrial 2022-2025
Communications & Radar 2022-2025
Telecommunications 2022-2025
Consumer 2022-2025
Video 2022-2025
Audio 2022-2025
Personal 2022-2025
Components 2022-2025
Active 2022-2025
Passive 2022-2025
Other 2022-2025
3.12.4. Philippines Markets
Computing 2022-2028
Office Equipment 2022-2028
Control & Instrumentation 2022-2028
Medical & Industrial 2022-2028
Communications & Radar 2022-2028
Telecommunications 2022-2028
Consumer 2022-2028
Video 2022-2028
Audio 2022-2028
Personal 2022-2028
Components 2022-2028
Active 2022-2028
Passive 2022-2028
Other 2022-2028
3.13. SINGAPORE
3.13.1. Economic Outlook
3.13.2. Electronics Industry Overview
3.13.3. Singapore Production
Computing 2022-2025
Office Equipment 2022-2025
Control & Instrumentation 2022-2025
Medical & Industrial 2022-2025
Communications & Radar 2022-2025
Telecommunications 2022-2025
Consumer 2022-2025
Video 2022-2025
Audio 2022-2025
Personal 2022-2025
Components 2022-2025
Active 2022-2025
Passive 2022-2025
Other 2022-2025
3.13.4. Singapore Markets
Computing 2022-2028
Office Equipment 2022-2028
Control & Instrumentation 2022-2028
Medical & Industrial 2022-2028
Communications & Radar 2022-2028
Telecommunications 2022-2028
Consumer 2022-2028
Video 2022-2028
Audio 2022-2028
Personal 2022-2028
Components 2022-2028
Active 2022-2028
Passive 2022-2028
Other 2022-2028
3.14. SOUTH AFRICA
3.14.1. Economic Outlook
3.14.2. Electronics Industry Overview
3.14.3. South Africa Production
Computing 2022-2025
Office Equipment 2022-2025
Control & Instrumentation 2022-2025
Medical & Industrial 2022-2025
Communications & Radar 2022-2025
Telecommunications 2022-2025
Consumer 2022-2025
Video 2022-2025
Audio 2022-2025
Personal 2022-2025
Components 2022-2025
Active 2022-2025
Passive 2022-2025
Other 2022-2025
3.14.4. South Africa Markets
Computing 2022-2028
Office Equipment 2022-2028
Control & Instrumentation 2022-2028
Medical & Industrial 2022-2028
Communications & Radar 2022-2028
Telecommunications 2022-2028
Consumer 2022-2028
Video 2022-2028
Audio 2022-2028
Personal 2022-2028
Components 2022-2028
Active 2022-2028
Passive 2022-2028
Other 2022-2028
3.15. SOUTH KOREA
3.15.1. Economic Outlook
3.15.2. Electronics Industry Overview
3.15.3. South Korea Production
Computing 2022-2025
Office Equipment 2022-2025
Control & Instrumentation 2022-2025
Medical & Industrial 2022-2025
Communications & Radar 2022-2025
Telecommunications 2022-2025
Consumer 2022-2025
Video 2022-2025
Audio 2022-2025
Personal 2022-2025
Components 2022-2025
Active 2022-2025
Passive 2022-2025
Other 2022-2025
3.15.4. South Korea Markets
Computing 2022-2028
Office Equipment 2022-2028
Control & Instrumentation 2022-2028
Medical & Industrial 2022-2028
Communications & Radar 2022-2028
Telecommunications 2022-2028
Consumer 2022-2028
Video 2022-2028
Audio 2022-2028
Personal 2022-2028
Components 2022-2028
Active 2022-2028
Passive 2022-2028
Other 2022-2028
3.16. TAIWAN
3.16.1. Economic Outlook
3.16.2. Electronics Industry Overview
3.16.3. Taiwan Production
Computing 2022-2025
Office Equipment 2022-2025
Control & Instrumentation 2022-2025
Medical & Industrial 2022-2025
Communications & Radar 2022-2025
Telecommunications 2022-2025
Consumer 2022-2025
Video 2022-2025
Audio 2022-2025
Personal 2022-2025
Components 2022-2025
Active 2022-2025
Passive 2022-2025
Other 2022-2025
3.16.4. Taiwan Markets
Computing 2022-2028
Office Equipment 2022-2028
Control & Instrumentation 2022-2028
Medical & Industrial 2022-2028
Communications & Radar 2022-2028
Telecommunications 2022-2028
Consumer 2022-2028
Video 2022-2028
Audio 2022-2028
Personal 2022-2028
Components 2022-2028
Active 2022-2028
Passive 2022-2028
Other 2022-2028
3.17. THAILAND
3.17.1. Economic Outlook
3.17.2. Electronics Industry Overview
3.17.3. Thailand Production
Computing 2022-2025
Office Equipment 2022-2025
Control & Instrumentation 2022-2025
Medical & Industrial 2022-2025
Communications & Radar 2022-2025
Telecommunications 2022-2025
Consumer 2022-2025
Video 2022-2025
Audio 2022-2025
Personal 2022-2025
Components 2022-2025
Active 2022-2025
Passive 2022-2025
Other 2022-2025
3.17.4. Thailand Markets
Computing 2022-2028
Office Equipment 2022-2028
Control & Instrumentation 2022-2028
Medical & Industrial 2022-2028
Communications & Radar 2022-2028
Telecommunications 2022-2028
Consumer 2022-2028
Video 2022-2028
Audio 2022-2028
Personal 2022-2028
Components 2022-2028
Active 2022-2028
Passive 2022-2028
Other 2022-2028
3.18. USA
3.18.1. Economic Outlook
3.18.2. Electronics Industry Overview
3.18.3. USA Production
Computing 2022-2025
Office Equipment 2022-2025
Control & Instrumentation 2022-2025
Medical & Industrial 2022-2025
Communications & Radar 2022-2025
Telecommunications 2022-2025
Consumer 2022-2025
Video 2022-2025
Audio 2022-2025
Personal 2022-2025
Components 2022-2025
Active 2022-2025
Passive 2022-2025
Other 2022-2025
3.18.4. USA Markets
Computing 2022-2028
Office Equipment 2022-2028
Control & Instrumentation 2022-2028
Medical & Industrial 2022-2028
Communications & Radar 2022-2028
Telecommunications 2022-2028
Consumer 2022-2028
Video 2022-2028
Audio 2022-2028
Personal 2022-2028
Components 2022-2028
Active 2022-2028
Passive 2022-2028
Other 2022-2028
3.19. VIETNAM
3.19.1. Economic Outlook
3.19.2. Electronics Industry Overview
3.19.3. Vietnam Production
Computing 2022-2025
Office Equipment 2022-2025
Control & Instrumentation 2022-2025
Medical & Industrial 2022-2025
Communications & Radar 2022-2025
Telecommunications 2022-2025
Consumer 2022-2025
Video 2022-2025
Audio 2022-2025
Personal 2022-2025
Components 2022-2025
Active 2022-2025
Passive 2022-2025
Other 2022-2025
3.19.4. Vietnam Markets
Computing 2022-2028
Office Equipment 2022-2028
Control & Instrumentation 2022-2028
Medical & Industrial 2022-2028
Communications & Radar 2022-2028
Telecommunications 2022-2028
Consumer 2022-2028
Video 2022-2028
Audio 2022-2028
Personal 2022-2028
Components 2022-2028
Active 2022-2028
Passive 2022-2028
Other 2022-2028
4. APPENDICES
4.1. Exchange Rates
4.2. Guide to Interpretation of the Statistics
4.3. Guide to Statistical Trade Classifications
4.4. Guide to the Definition of Electronic Product Headings