

본 보고서는 통신 네트워크 사업자 시장의 성장과 발전에 대해 검토하고 있습니다. 이 보고서는 2011년 1분기부터 2024년 3분기까지 전 세계 140개 통신 사업자의 재무 통계를 광범위하게 추적하고 있습니다.
2024년 3분기 통신 네트워크 사업자의 연환산 매출은 1조 7,700억 달러(전년 동기 대비 0.1% 증가), 인건비는 2,624억 달러(전년 동기 대비 0.8% 증가), 설비투자는 2,946억 달러(전년 동기 대비 7.7% 감소), 2024년 9월 기준 직원 수는 약 445만 명으로 전년 동기 대비 1.5% 감소한 것으로 나타났습니다.

보고서 하이라이트:
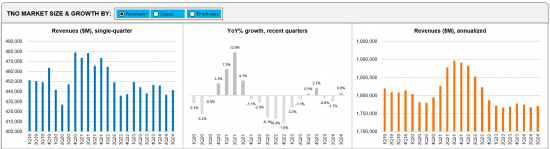
매출 : 통신업계의 3분기 매출은 전년 동기 대비 0.8% 증가한 4,414억 달러, 2024년 3분기 연환산 매출은 전년 동기 대비 0.1% 증가한 1조 7,706억 달러로 집계됐습니다. 통신사별로는 2024년 3분기 연환산 매출 성장률 상위 20개사 중 Airtel(4.6%), America Movil(4.3%), STC(Saudi Telecom)(4.2%), Deutsche Telekom(3.3%), BT(2.5 %) 등 5개사가 순위에 올랐습니다. 같은 기준으로 같은 기간 가장 부진한 성장률을 보인 곳은 보다폰(-6.8%), KDDI(-5.7%), NTT(-5.0%), 소프트뱅크(-3.6%), BCE(-1.6%) 순이었습니다. 환율 변동은 3분기에 큰 요인이 아니었으며, 대부분의 주요 통화는 3분기 대비 비교적 안정적이었습니다.
설비투자 : 2024년 9월 분기 설비투자는 전년 동기 대비 6.1% 감소한 711억 달러, 2024년 3분기 설비투자는 연환산 기준 2,946억 달러로 전년 동기 대비 7.7% 감소했습니다. 사업자별로는 2024년 3분기 연환산 설비투자 증가율 상위 20개사 중 BSNL(300.6%), Telstra(52.3%), BT(4.8%), NTT(3.0%), China Mobile(1.9%) 등 5개사가 상위 20개사 중 5개사를 차지했습니다. 같은 기준으로 같은 기간 설비투자 증가율이 가장 저조한 곳은 Reliance Jio(27.4% 감소), Verizon(22.5% 감소), Vodafone(20.0% 감소), Deutsche Telekom(18.1% 감소), KDDI(16.3% 감소) 순이었습니다.
OPEX 및 인건비 : 2024년 3분기 OPEX는 1조 5,079억 달러로 전년 동기 대비 0.9% 소폭 증가했습니다. 감가상각비를 제외하면 전년 동기 대비 1.7% 증가한 1조 1,794억 달러였습니다. 통신사 OPEX의 중요한 요소 중 하나는 인건비이며, 인건비에는 급여, 임금, 상여금, 복리후생, 퇴직금 등이 포함되며, 2024년 3분기 연환산 인건비는 전년 동기 대비 0.8% 증가하여 OPEX(D&A 제외)에서 인건비가 차지하는 비중은 22.2%이었습니다.
수익성 : 2024년 3분기 연환산 EBITDA 마진과 EBIT 마진은 모두 2023년 3분기 대비 소폭 하락했습니다. 2023년 3분기 연환산 EBIT 마진은 2024년 3분기 15.5%에서 2024년 3분기 14.8%로 하락했고, 2024년 3분기 연환산 EBITDA 마진은 2023년 3분기 34.5%에서 2024년 3분기 33.4%로 하락했습니다.
지역별 동향 : 2024년 3분기에도 아메리카는 세계 통신 사업 매출의 37.2%를 차지하며 최대 수익 지역 지위를 유지했고, 아시아가 36.4%로 근소한 차이로 그 뒤를 이었습니다. 설비투자 기준으로는 아시아가 전 세계 설비투자의 38.2%를 차지하며 아메리카를 제치고 1위를 차지했습니다. 이는 AT&T와 Verizon의 5G 지출에 힘입어 아메리카가 1위를 차지했던 2022년 3분기와 2023년 3분기에 비해 변화된 모습입니다. 연간 자본집약도는 유럽이 2024년 3분기 17.8%로 가장 높았으며, 중동 및 아프리카가 17.0%로 그 뒤를 이었습니다.
|
|
|
|
This report reviews the growth and development of the telecommunications network operator (TNO, or telco) market. The report tracks a wide range of financial stats for 140 telcos across the globe, from 1Q11 through 3Q24. For the annualized 3Q24 period, telcos represented $1.77 trillion (T) in revenues (0.1% growth YoY), $262.4 billion (B) in labor costs (0.8% YoY), and $294.6B in capex (-7.7% YoY). They employed approximately 4.45 million people as of September 2024, down 1.5% from the prior year.
Below are a few highlights from the report:
Revenues: Telco topline grew slightly by 0.8% on a YoY basis to post $441.4 B in the latest single quarter ending 3Q24. Revenues for the annualized 3Q24 period were $1,770.6B, up 0.1% YoY over the same period in the previous year. At the operator level, five of the top 20 telcos by topline growth in 3Q24 on an annualized basis include Airtel (4.6%), America Movil (4.3%), STC (Saudi Telecom) (4.2%), Deutsche Telekom (3.3%), and BT (2.5%). By the same criteria, the worst telco growth came from Vodafone (-6.8%), KDDI (-5.7%), NTT (-5.0%), SoftBank (-3.6%), and BCE (-1.6%) during the same period. Note that exchange rate volatility was NOT a major factor in 3Q24, as most major currencies were relatively stable versus 3Q23 levels.
Capex: Capex spending declined by 6.1% on a YoY basis to post $71.1B in the latest single quarter ending September 2024. Capex for the annualized 3Q24 period was $294.6B, down 7.7% YoY over the same period in the previous year. At the operator level, five of the top 20 telcos by capex growth in 3Q24 on an annualized basis include BSNL (300.6%), Telstra (52.3%), BT (4.8%), NTT (3.0%), and China Mobile (1.9%). By the same criteria, the worst capex growth came from Reliance Jio (-27.4%), Verizon (-22.5%), Vodafone (-20.0%), Deutsche Telekom (-18.1%), and KDDI (-16.3%) during the same period.
Opex and labor costs: Total opex for the telecom industry in the annualized 3Q24 period stood at $1,507.9B, a slight increase of 0.9% over the same period in the previous year. Excluding depreciation and amortization (D&A) costs, opex increased by 1.7% on YoY basis to record $1,179.4B in the annualized 3Q24 period. One significant element of telco opex is labor costs, which include salaries, wages, bonuses, benefits, and retirement/severance costs. Labor costs grew by 0.8% YoY in the annualized 3Q24 period, while labor costs as a percentage of opex (ex-D&A) was 22.2% in the same period.
Profitability margins: Both EBITDA and EBIT margins showed a slight decline in annualized 3Q24 compared to 3Q23. The annualized EBIT margin dipped from 15.5% in 3Q23 to 14.8% in 3Q24, while the EBITDA margin for the annualized 3Q24 period stood at 33.4%, down from 34.5% in annualized 3Q23.
Regional trends: The Americas retained its position as the largest revenue-generating region in 3Q24, contributing 37.2% of global telco revenues, closely followed by Asia with a 36.4% share. On a capex basis though, Asia emerged as the top spender, claiming 38.2% of global capex and outpacing the Americas; this is a change from 3Q22 and 3Q23, when Americas ranked #1 on the back of 5G spending by AT&T and Verizon. Europe retained the highest annualized capital intensity, reaching 17.8% in 3Q24, followed by MEA at 17.0%.
Important note: We have made some significant enhancements to our telco market review report in 1Q24. The changes are designed to provide a more insightful and user-friendly experience:
Both new sections also feature the capability to export graphics to PDF, enhancing the flexibility and utility of the data presented.
|
|
|
|