


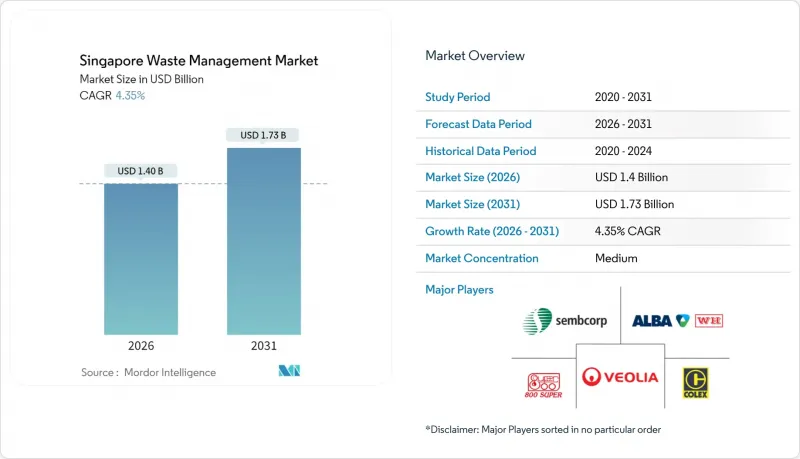
싱가포르의 폐기물 관리 시장은 2025년 13억 4,000만 달러에서 2026년에는 14억 달러로 성장하고 2026-2031년 CAGR 4.35%로 성장을 지속하여, 2031년까지 17억 3,000만 달러에 이를 것으로 예측됩니다.

이러한 꾸준한 확대는 폐기물 처리보다 자원 회수를 중시하는 순환형 경제로의 전환을 반영하고 있습니다. 한정된 토지 자원은 폐기물 발전(WTE) 시설에 대한 투자를 촉진하고, 자원 지속가능성법(RSA)과 제로 웨이스트 마스터 플랜은 음식물 쓰레기, 포장 폐기물, 전자 폐기물의 각 스트림에서 재활용 능력에 대한 의무적 수요를 창출하고 있습니다. 공공기관이 전문 서비스를 외부에 위탁하는 가운데, 민간 사업자의 존재감이 커지고 있습니다. 또한, 국가적인 수소 이용 목표가 폐기물 유래 연료에 대한 연구를 뒷받침하고 있습니다. 운영비, 연료비, 인건비, 탄소세 상승으로 인해 시장은 자동화, 데이터 기반 경로 최적화, 통합 처리 시설로 향하고 있습니다.
제로 웨이스트 마스터플랜은 2030년까지 전국 재활용률 70% 달성 및 매립 폐기물 30% 감축을 의무화하여 싱가포르의 폐기물 관리 시장의 현금 흐름 구조를 재구성합니다. 전자폐기물, 음식물 쓰레기, 포장재 등 3가지 우선순위 스트림이 전체 폐기물의 40% 이상을 차지하기 때문에 규제 준수가 분리수거, 퇴비화, 첨단 재활용 설비에 대한 수요를 견인할 것입니다. 음식물쓰레기 분리처리 의무화(RSA)에 따라 2024년부터 대규모 시설에서 분리배출이 의무화됨에 따라 현장 소화장치와 바이오펄프 처리장치에 대한 수요가 집중될 것으로 보입니다. 신규 건축물에 이러한 설비 설치 공간 확보가 의무화되어 기술 벤더의 파이프라인을 보장할 수 있습니다. 월별 보고 의무와 단계적 처벌 강화로 인한 집행 체계로 수익 예측 가능성 향상. 투아스 넥서스 구상에서 볼 수 있듯이, 폐기물 에너지 전환(WTE)과 수자원 회수를 통합적으로 제공하는 사업자가 정책의 최적 솔루션으로 자리매김할 수 있습니다.
세마카우 매립지는 2035년까지 설계 용량에 도달할 것으로 예상되기 때문에 싱가포르는 폐기물의 용도 전환 또는 소형화가 필수적입니다. 현재 가동 중인 4개의 WTE 플랜트는 연간 380만 톤을 처리하며, 전력망의 2%를 공급하고 있습니다. 한편, 2021년 가동을 시작한 투아스완 시설은 하루 3,600톤을 처리하고 120MW를 전력망에 공급하고 있습니다. 투아스 넥서스에 건설 예정인 통합폐기물관리시설(IWMF)은 하루 5,800톤의 처리능력을 갖춘 세계 최대 규모의 단일 폐기물 복합시설이 될 것으로 예측됩니다. 소각 처리량이 늘어날 때마다 귀중한 토지가 확보되기 때문에 원료의 안정적 공급은 민간부문의 장기 건설-운영-양도(BOT) 계약에 대한 의지를 뒷받침하고 있습니다.
경쟁적인 토지 이용으로 인해 기회비용이 증가하고, 악취가 발생하거나 잠재적으로 위험한 활동으로 지정된 산업용지는 극히 일부만 남아있습니다. 다층 또는 지하 설계는 부지 면적을 압축할 수 있지만, 설비 투자 금액과 운영 및 유지보수의 복잡성을 증가시킵니다. 사업자는 동일 부지 내에서 더 높은 처리 용량을 구현하는 설계를 요구받게 되고, 이는 기술 리스크와 보험료 증가로 이어집니다. 재활용센터에는 압축포장재 보관 장소가 필요하지만, 수거구역 인근의 저비용 부지가 부족하여 신규 진입을 제한하고 있습니다.
2025년 기준, 주거 폐기물은 싱가포르의 폐기물 관리 시장의 39.12%를 차지하며 압도적인 점유율을 차지했습니다. 이는 주택개발청(HDB) 단지와 분양아파트에서 매일 안정적으로 발생하는 폐기물 양에 기인합니다. 상업용 폐기물은 음식물 쓰레기 분리배출 의무화(RSA), 전자제품 회수 키오스크, 쇼핑몰의 폐기물 감축 계획 제출을 의무화하는 그린 리스 요건에 힘입어 연평균 6.31%로 가장 빠르게 성장하고 있습니다. 주택 폐기물은 공공 부문의 수거 경로에서 기반 수요를 확보하고 있지만, 민간 수거업체는 현재 컴포스터와 실시간 쓰레기통 레벨 센서를 결합한 종량제 요금제로 호텔과 비즈니스 파크 확보에 주력하고 있습니다.
상업 분야의 성장은 적극적인 서비스 다각화도 반영하고 있습니다. 체인 음식점에서는 Westcom Bio-Chem과 같은 현지 스타트업이 제공하는 하루 2톤의 소화 장치를 설치하기 시작하여 발생원에서의 폐기물 양을 줄이고 있습니다. 오피스 빌딩에는 블루투스 지원 압축기를 도입하여 ESG 대시보드에 반영되는 데이터 활용을 실현하고 있습니다. 이러한 혁신은 기존의 방문 수거를 넘어선 것으로, 사업자들은 고수익 계약을 체결함으로써 싱가포르의 폐기물 관리 시장 전망 가치를 뒷받침하고 있습니다.
수집, 운송, 선별 업무는 2025년 매출의 47.15%를 차지하며 싱가포르의 폐기물 관리 시장의 물류 기반을 구성하고 있습니다. 텔레매틱스 기술로 대기 시간을 줄인 트럭이 도심을 단거리 이동하여 중계 스테이션으로 폐기물을 운반합니다. 그러나 재활용 및 자원 회수 분야는 2031년까지 연평균 복합 성장률(CAGR) 6.42%의 성장세를 보이고 있습니다. 한 예로, 레멕스(Remex)의 바텀애쉬 처리 공장을 들 수 있습니다. 이 공장은 소각재에서 철 금속의 90%를 회수하여 원래는 버려질 수 있는 흐름을 수익화하고 있습니다.
기술 혁신이 재활용 수익률 향상에 기여하고 있습니다. 쉘의 신형 열분해 오일 업그레이더는 부콩섬에서 재활용이 어려운 플라스틱 5만톤을 크래커 원료로 전환하여 자원 회수가 부가가치를 견인하는 방향을 제시하고 있습니다. 이러한 움직임은 싱가포르를 고부가가치 순환형 소재의 지역 거점으로 재정의하고, 싱가포르의 폐기물 관리 시장 규모를 석유화학 가치사슬에 임베디드시키고 있습니다.
싱가포르의 폐기물 관리 보고서는 발생원별(주거, 상업, 산업 등), 서비스 유형별(수집, 운송, 선별-분리 등), 폐기물 유형별(일반 폐기물, 산업 유해 폐기물, 전자 폐기물, 플라스틱 등), 계약 모델별(민간-공공)로 분류되어 있습니다. 시장 예측은 금액(USD)으로 제공됩니다.
The Singapore Waste Management Market is expected to grow from USD 1.34 billion in 2025 to USD 1.4 billion in 2026 and is forecast to reach USD 1.73 billion by 2031 at 4.35% CAGR over 2026-2031.
This steady expansion reflects Singapore's pivot toward circular-economy practices that prize material recovery over disposal. Tight land availability reinforces investment in waste-to-energy (WTE) assets, while the Resource Sustainability Act (RSA) and the Zero-Waste Masterplan create compulsory demand for recycling capacity across food, packaging, and electronic waste streams. Private operators gain ground as public agencies outsource specialized services, and national hydrogen ambitions underpin research into waste-derived fuels. Rising operating costs, fuel, labor, and carbon taxes are nudging the market toward automation, data-driven route optimization, and integrated processing complexes.
The Zero-Waste Masterplan sets a mandatory 70% national recycling rate and orders a 30% cut in landfill waste by 2030, reshaping the cash-flow logic of the Singapore waste management market. Three priority streams, e-waste, food waste, and packaging, together generate more than 40% of total waste, so compliance drives demand for sorting, composting, and advanced recycling kits. The RSA makes food-waste segregation compulsory for large premises from 2024, funneling business toward on-site digesters and bio-pulpers. A new build must now reserve space for such equipment, guaranteeing pipeline projects for technology vendors. Revenue predictability rises because enforcement includes mandatory monthly reporting and escalating penalties. Operators that supply integrated WTE and water recovery, as seen in the Tuas Nexus concept, sit in the policy sweet spot.
Semakau Landfill may reach its design limit by 2035, so the island republic must divert waste or miniaturize it. Four WTE plants currently vaporize 3.8 million t annually and supply 2% of the grid, while the 2021-commissioned TuasOne unit processes 3,600 t per day and delivers 120 MW to the network. The coming Integrated Waste Management Facility (IWMF) at Tuas Nexus will be able to handle 5,800 t per day, becoming the largest single waste complex worldwide. Each incremental tonne incinerated frees scarce land, so feedstock certainty underwrites private-sector appetite for long-term build-operate-transfer deals.
Competing land uses raise opportunity costs, and only a handful of industrial plots remain zoned for odorous or potentially hazardous activities. Multi-story or subterranean designs can compress footprints but raise capex and O&M intricacy. Operators must design for higher throughput in the same envelope, which in turn raises technology risk and insurance premiums. Recycling centers need lay-down yards for baled goods, yet affordable space near collection zones is scarce, limiting new entrants.
Other drivers and restraints analyzed in the detailed report include:
For complete list of drivers and restraints, kindly check the Table Of Contents.
Residential streams captured a commanding 39.12% share of the Singapore waste management market in 2025 as Housing Development Board estates and condominiums generated steady daily tonnage. Commercial waste is the fastest riser, expanding at a 6.31% CAGR on the back of RSA-mandated food-waste segregation, electronics take-back kiosks, and green-lease requirements that compel malls to file waste-reduction plans. The residential backbone ensures base-load demand for public-sector collection routes, yet private haulers now court hotels and business parks with pay-as-you-throw schemes that bundle composters and real-time bin-level sensors.
Growth in the commercial slice also reflects aggressive service diversification. Chain eateries have begun installing 2 t-per-day digesters sourced from local start-ups such as Westcom Bio-Chem, shrinking disposal volumes at source. Office towers adopt Bluetooth-enabled compactors to unlock data that feeds ESG dashboards. Because these innovations go beyond traditional curbside pickup, operators secure higher-margin contracts that underpin the future value of the Singapore waste management market.
Collection, transport, and sorting still represent 47.15% of 2025 revenue, embodying the logistics backbone of the Singapore waste management market. Trucks make short urban hops to transfer stations, supported by Telematics that cut idle time. Yet the recycling and resource-recovery cluster is on a 6.42% CAGR trajectory through 2031. One example is REMEX's bottom-ash processing plant that recovers 90% of ferrous metals from incinerator ash, monetizing an otherwise wasted stream.
Technology upgrades lift margins in recycling. Shell's new pyrolysis oil upgrader turns 50,000 t of hard-to-recycle plastics into cracker feedstock at Pulau Bukom, signaling how resource recovery will dominate incremental dollar value. These moves reposition Singapore as a regional node for high-value circular materials, and they embed the Singapore waste management market size into the petrochemical supply chain.
The Singapore Waste Management Report is Segmented by Source (Residential, Commercial, Industrial, and More), by Service Type (Collection, Transportation, Sorting & Segregation, and More), by Waste Type (Municipal Solid, Industrial Hazardous, E-Waste, Plastic, and More), and by by Contract Model (Private and Public). The Market Forecasts are Provided in Terms of Value (USD).