


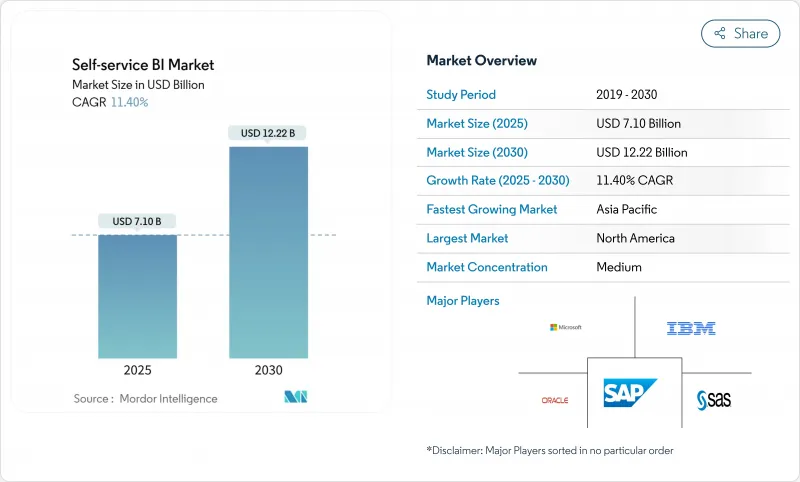
셀프 서비스 비즈니스 인텔리전스(BI) 시장의 규모는 2025년에 71억 달러로 추정되며, 2030년에는 122억 2,000만 달러에 이를 것으로 예측되고 CAGR은 11.47%로 예상됩니다.

엔터프라이즈는 로우코드 애널리틱스를 확장하고, 생성형 AI를 통합하고, 워크로드를 클라우드 데이터 웨어하우스로 마이그레이션함으로써 인사이트 주기를 단축하고 IT 직원을 전략적 작업으로 전환하고 있습니다. 북미 기업들은 직관적인 도구를 통해 리포팅 백로그를 약 3분의 1로 줄일 수 있음을 입증한 후 채용을 이끌고 있지만, 아시아태평양 기업들은 클라우드 인프라가 성숙함에 따라 빠르게 뒤따르고 있습니다. 공급업체는 다국어 환경을 지원하는 자연 언어 쿼리의 통합을 서두르고 있으며, 이 기능은 이미 유럽 사용자의 관심을 높이고 있습니다. 한편 규제 당국의 압력과 섀도우 IT 사고로 거버넌스에 대한 관심이 높아지고 오픈 아키텍처와 자동 제어 기능을 결합한 플랫폼에 대한 구매 의욕이 높아지고 있습니다.
로우코드 인터페이스를 통해 비즈니스 전문가는 개발자에 의존하지 않고 대시보드를 만들 수 있으며, 이 시프트는 북미에서 가장 두드러집니다. 시티즌 데이터 사이언티스트가 도메인 지식과 간소화된 도구를 결합하여 기존 BI 팀이 간과하기 쉬운 패턴을 발굴함으로써 분석 작업의 생산성이 74% 상승했습니다. 민주화와 견고한 시맨틱 레이어를 결합한 기업은 백로그 핸드오프를 줄이고 실제 조치를 취할 수 있는 운영 시간 내에 인사이트를 제공합니다. 이러한 문화적 변화는 플랫폼의 평가 기준을 기능의 충실도에서 비기술계 스탭으로의 도입의 용이성으로 확대하고, 직관적인 드래그 앤 드롭에 의한 제작과 인앱 안내를 중심으로 플랫폼의 통합을 추진하고 있습니다.
아시아태평양의 기업들은 BI의 동시 실행을 제한한 병목 현상을 제거하고 데이터를 클라우드로 마이그레이션함으로써 레거시 스택을 극복합니다. 클라우드 웨어하우스 부문의 CAGR은 27.64%로 상승했으며, 분석 팀은 작업을 대기열에 넣지 않고 새로운 데이터를 조회하고 보고 시간을 40% 단축했습니다. 셀프 서비스 배포와 웨어하우스 근대화를 연계한 기업은 사일로화된 배포와 비교하여 인사이트까지 시간을 3배나 단축할 수 있습니다. 이러한 웨어하우스에 통합된 중앙 집중식 거버넌스는 데이터 품질을 향상시키고 부서 간에 일관된 메트릭을 가능하게 합니다.
승인되지 않은 도구를 채택하면 KPI 불일치와 기밀 데이터 세트의 노출이 발생하고 규정 준수를 위반한 기업은 1건당 평균 103만 달러의 손해를 입습니다. 마케팅 부문과 재무 부문은 신속한 반복 작업을 위해 IT 부서를 거치지 않으려는 관행으로 인해 규정 위반이 잦습니다. Best-in-Class 기업은 카탈로그 중심의 거버넌스, 자동화된 계보 및 역할 기반 액세스를 도입하여 민첩성을 유지하면서 위험을 억제하고 종합적인 전면 봉쇄 방식보다 45% 높은 도입률을 달성했습니다.
소프트웨어 부문은 계속해서 수익의 기둥이 되고 있지만, 서비스 부문의 수익이 CAGR 15.2%로 더욱 가속화하고 있습니다. 플랫폼 구매와 교육 프로그램을 결합한 조직은 도구 전용 구매자보다 45% 높은 채용률을 보고합니다. 수요는 데이터 리터러시 기술 및 거버넌스 감사를 다루는 지속적인 인에이블먼트 구독으로 이동하고 있습니다. 그 결과, 도입 전문가는 업계 특유의 플레이북을 패키징하고 대시보드를 각 업계의 KPI에 맞추어 가치 실현까지의 시간을 단축하고 있습니다. 셀프 서비스 BI 시장의 규모는 2030년까지 32억 달러에 달할 것으로 예측되며, 자동화와 함께 인간의 전문 지식에 대한 지속적인 욕구를 반영합니다.
한편, 소프트웨어 벤더는 AI 기능의 동등성을 우선시하고 경쟁력을 유지하기 위해 NLQ, 자동화된 인사이트, 임베디드 모드를 추가하고 있습니다. 끊임없는 업데이트는 기업이 시맨틱 레이어를 제거하지 않고 분석 엔진을 교체할 수 있는 모듈형 아키텍처를 선호한다는 것을 뒷받침합니다. 이 자세는 공급업체 잠금의 우려를 줄이고 AI 기능이 성숙함에 따라 진화하는 혼합 도구 환경을 지원합니다.
클라우드 배포는 현재 매출액의 73%를 차지하고 CAGR 13.5%로 사용자를 늘리고 있으며 이용률과 기세 모두를 독점하고 있습니다. 규모의 이점을 통해 중견 기업은 자본 지출 없이 엔터프라이즈급 분석을 도입할 수 있어 대기업과의 경쟁 조건을 평준화할 수 있습니다. 또한 분산된 팀이 공유 작업 공간에서 실시간으로 협업할 수 있게 되어 피드백 루프가 가속화되고 있습니다. 보안 시스템도 진화하고 있으며, 정적 암호화, 개인 링크 및 지역 데이터센터는 현재 대부분의 규제 당국의 감사에서 벗어났으며 퍼블릭 클라우드에 대한 이전의 우려는 완화되고 있습니다.
On-Premise 솔루션은 데이터 상주가 의무화되는 엄격한 규제 산업에서 근본적으로 존재합니다. 그러나 이러한 분야에서도 하이브리드 설계가 일반적이며, 기밀성이 높은 테이블은 On-Premise에 배치되고 집계 모델은 클라우드에 동기하여 널리 이용됩니다. 예측 기간 동안 하이퍼스케일러는 BI를 스토리지 및 AI 서비스와 긴밀하게 통합하므로 클라우드 셀프 서비스 BI 시장 점유율은 80%를 초과할 것으로 예측됩니다.
셀프 서비스 BI 시장은 컴포넌트(소프트웨어 및 서비스), 배포 모델(클라우드/온디맨드 및 On-Premise), 용도(판매 및 마케팅 관리, 고객 참여 및 분석, 사기 및 보안 관리 등), 최종 사용자 산업(은행, 금융서비스 및 보험(BFSI), 의료, 제조업 등), 조직 규모(대기업 및 중소기업), 지역별로 구분됩니다. 시장 예측은 금액(달러)으로 제공됩니다.
북미는 셀프 서비스 BI 시장 매출의 42%를 차지하고 있으며, 로우코드 플랫폼의 조기 도입과 선도적인 벤더의 존재가 뒷받침하고 있습니다. 금융 서비스 및 의료 제공업체는 일상적인 워크플로에 자연어 쿼리를 통합하고 성숙한 거버넌스 프로그램을 통해 사용자 감정을 높이고 섀도우 IT 사고를 억제합니다. R&D 투자는 첨단 AI 설명 가능성에 중점을 두고 규제 환경에서 권장 사항을 정당화하는 시스템을 준비하고 있습니다. 국경을 넘어선 데이터 공유 규칙은 여전히 주목점이지만, 이 지역의 정교한 클라우드 인프라는 플랫폼 생태계를 확장하는 혁신적인 애널리틱스 신흥 기업을 계속 끌어들이고 있습니다.
아시아태평양은 CAGR 13.77%로 가장 빠르게 성장하고 있습니다. 중국, 인도, 일본, 호주는 국내 클라우드 대기업과 하이퍼스케일러가 데이터센터에 자본을 투입하고 왕성한 수요를 보여줍니다. 이 지역의 중소기업은 데스크톱 부족을 극복하기 위해 모바일 퍼스트 애널리틱스를 사용하고 있으며 스마트폰 대시보드는 많은 현장 직원의 주요 인터페이스가 되었습니다. 데이터 거버넌스의 인력 부족은 계속되고 있으며, 2027년 이후에 제약이 완화되어야 하는 인증 프로그램의 시작을 정부나 학술기관에 촉구하고 있습니다. 일본이나 한국에서는 제조업의 도입이 진행되고 있으며, 예측 유지 보수가 인더스트리 4.0의 로드맵과 일치하고 있습니다. 한편 싱가포르와 같은 금융 중심지에서는 지역 은행 서비스를 차별화하기 위해 고객 분석을 중시하고 있습니다.
유럽에서는 엄격한 개인정보보호법에 의해 꾸준히 도입이 진행되고 있습니다. 기업은 세분화된 동의 관리 및 로컬 데이터 처리를 지원하는 플랫폼을 선택함으로써 민주화와 GDPR(EU 개인정보보호규정) 규정 준수의 균형을 맞추고 있습니다. 다국어 자연 언어 인터페이스는 특히 높이 평가되었으며, 파일럿 프로젝트는 비기술 직원의 참여를 50% 향상시켰습니다. 서유럽의 클라우드 마이그레이션은 규제 당국이 암호화와 로컬 장애 조치가 주권 요구 사항을 충족한다는 것을 분명히 함으로써 가속화되고 있습니다. 동유럽은 폴란드, 루마니아, 체코 공화국에 디지털 전환 자금이 유입되어 급속히 추격하고 있습니다. 소매업과 디스크리트 제조업이 수요의 대부분을 차지하고 있지만, 독점적 종속을 경계하는 기관에서는 오픈소스의 대안이 지지를 모으고 있습니다.
남미, 중동, 아프리카는 아직 초기 단계이지만 미래가 유망합니다. 브라질과 멕시코는 실시간 고객 전망을 요구하는 통신 사업자와 은행을 중심으로 라틴아메리카에서의 채용을 선도하고 있습니다. 중동에서는 걸프 협력 회의 제국 정부가 투자의 중심이 되어 BI를 활용하여 다각화 의제와 스마트 시티 이니셔티브를 지원하고 있습니다. 아프리카에서의 도입은 단편적이며 남아프리카가 기업에 도입을 선도하는 반면, 나이지리아와 케냐는 핀테크 생태계를 통해 기세를 보이고 있습니다. 또한 데스크톱의 보급률이 낮은 지역에서는 모바일 대시보드가 인프라 갭을 채우고 있습니다.
The self-service BI market size is estimated at USD 7.10 billion in 2025 and is forecast to reach USD 12.22 billion by 2030, reflecting an 11.47% CAGR.
Firms are scaling low-code analytics, embedding generative AI, and shifting workloads to cloud data warehouses, which shortens insight cycles and frees IT staff for strategic work. North American organizations lead adoption after proving that intuitive tools can cut reporting backlogs by roughly one-third, while Asia-Pacific businesses are catching up fast as cloud infrastructure matures. Vendors are racing to integrate natural-language querying that supports multilingual environments, a capability already boosting engagement among European users. Meanwhile, heightened attention to governance, driven by regulatory pressure and shadow-IT incidents, is steering purchasing toward platforms that pair open architectures with automated control features.
Low-code interfaces let business professionals create dashboards without relying on developers, a shift most visible in North America where 80% of executives credit wider data access for faster decisions. Productivity for analytical tasks has risen 74% as citizen data scientists pair domain knowledge with simplified tooling, unearthing patterns traditional BI teams often overlook. Companies that married democratization with robust semantic layers cut backlog hand-offs and delivered insight within the operational window where actions still matter. This cultural change is expanding platform evaluation criteria from feature depth to the ease of onboarding non-technical staff, driving platform consolidation around intuitive drag-and-drop authoring and in-app guidance.
Asia-Pacific organizations are leapfrogging legacy stacks by landing data in the cloud, eliminating bottlenecks that once restricted BI concurrency. With the cloud warehouse segment itself climbing at 27.64% CAGR, analytics teams now query fresh data without queuing jobs, shrinking report time by as much as 40%. Firms that align self-service rollouts with warehouse modernization gain triple-speed time-to-insight compared with siloed deployments. Centralized governance baked into these warehouses also raises data quality, enabling consistent metrics across departments.
Unvetted tool adoption has generated conflicting KPIs and exposed sensitive datasets, costing non-compliant firms USD 1.03 million on average per incident. Marketing and finance units are frequent offenders because rapid iterations tempt them to sidestep IT. Best-in-class enterprises deploy catalog-driven governance, automated lineage, and role-based access that preserve agility yet curb risk, yielding 45% higher adoption than blanket lockdown approaches.
Other drivers and restraints analyzed in the detailed report include:
For complete list of drivers and restraints, kindly check the Table Of Contents.
The software segment continues to anchor revenue, yet services revenue is compounding faster at 15.2% CAGR. Organizations that pair platform purchases with training programs report adoption rates 45% higher than tool-only buyers. Demand is shifting toward continuous enablement subscriptions that cover data-literacy upskilling and governance audits. As a result, implementation specialists are packaging industry-specific playbooks, aligning dashboards with vertical KPIs, and expediting time-to-value. The self-service BI market size for services is projected to reach USD 3.2 billion by 2030, reflecting sustained appetite for human expertise alongside automation.
Software vendors, meanwhile, prioritize AI feature parity, adding NLQ, automated insights, and embedded modes to remain competitive. The relentless update cadence pushes enterprises to favor modular architectures that let them swap analytic engines without ripping out semantic layers. This posture mitigates vendor lock-in concerns and supports mixed-tool environments that evolve as AI capabilities mature.
Cloud deployments own both usage and momentum, commanding 73% of current revenue and adding users at a 13.5% CAGR. Economies of scale let mid-market firms implement enterprise-grade analytics without capital outlay, leveling the playing field with larger peers. Moreover, distributed teams can collaborate on shared workspaces in real time, accelerating feedback loops. Security postures have evolved; encryption-at-rest, private links, and regional data centers now satisfy most regulatory audits, tempering earlier reservations about public cloud.
On-premises solutions persist in heavily regulated verticals where data residency is mandatory. Yet even there, hybrid designs are common: sensitive tables stay onsite while aggregated models sync to the cloud for broad exploration. Over the forecast period, the self-service BI market share for cloud is expected to edge past 80% as hyperscalers integrate BI tightly with their storage and AI services.
Self Service BI Market is Segmented by Component (Software and Services), Deployment Model (Cloud / On-Demand and On-Premises), Application (Sales and Marketing Management, Customer Engagement and Analysis, Fraud and Security Management and More), End-User Industry (BFSI, Healthcare, Manufacturing and More), Organization Size ( Large Enterprises and SMEs), Geography. The Market Forecasts are Provided in Terms of Value (USD).
North America retains 42% of self-service BI market revenue, buoyed by early adoption of low-code platforms and the presence of leading vendors. Financial services and healthcare providers there embed natural-language querying in day-to-day workflows, keeping user sentiment high and shadow-IT incidents under control through mature governance programs. R&D investments focus on advanced AI explainability, preparing systems to justify recommendations in regulated settings. Cross-border data-sharing rules remain a watchpoint, yet the region's sophisticated cloud infrastructure continues to attract innovative analytics startups that expand platform ecosystems.
Asia-Pacific is the fastest growing territory, advancing at a 13.77% CAGR. China, India, Japan, and Australia demonstrate vigorous demand as domestic cloud giants and hyperscalers alike pour capital into data centers. SMEs in the region use mobile-first analytics to overcome desktop scarcity, with smartphone dashboards becoming the primary interface for many field employees. Talent shortages in data governance persist, prompting governments and academia to launch certification programs that should ease constraints after 2027. Manufacturing adoption is strong in Japan and South Korea, where predictive maintenance aligns with Industry 4.0 roadmaps, while financial hubs like Singapore emphasize customer analytics to differentiate regional banking services.
Europe shows steady uptake shaped by strict privacy statutes. Organizations balance democratization with GDPR compliance by opting for platforms that support fine-grained consent management and local data processing. Multilingual natural-language interfaces are especially valued, lifting engagement among non-technical staff by 50% in pilot projects. Western European cloud migration is accelerating after regulators clarified that encryption and local failover meet sovereignty requirements. Eastern Europe is catching up quickly as digital transformation funding flows into Poland, Romania, and the Czech Republic. Retail and discrete manufacturing dominate demand, though open-source alternatives gain traction in institutions wary of proprietary lock-in.
South America, the Middle East, and Africa remain early-stage yet promising. Brazil and Mexico head Latin American adoption, with telecom operators and banks seeking real-time customer views. Gulf Cooperation Council governments anchor investment in the Middle East, leveraging BI to support diversification agendas and smart-city initiatives. African uptake is fragmented; South Africa leads enterprise deployments, while Nigeria and Kenya show momentum through fintech ecosystems. Across these regions, cloud solutions enjoy preference owing to limited legacy estates, and mobile dashboards bridge infrastructure gaps in areas where desktop penetration is low.