


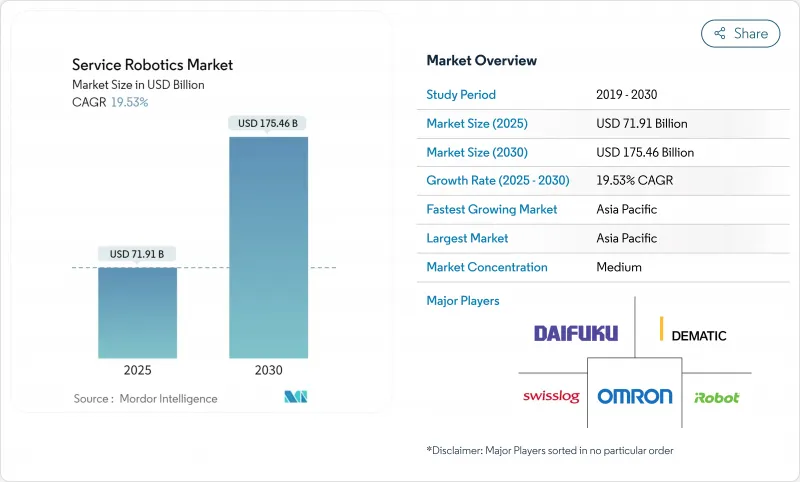
서비스 로봇 시장 규모는 2025년에 719억 1,000만 달러에 이르고, 2030년에는 1,754억 6,000만 달러로 확대될 것으로 예측되며, 2025-2030년의 CAGR은 19.53%를 나타낼 전망입니다.

개발의 원동력이 되고 있는 것은 신흥 경제 국가에서의 노동력 공급의 희박, 로봇의 총 소유 비용의 저하, 선행 투자의 장애물을 없애는 Robot-as-a-Service(RaaS) 플랜의 보급입니다. 주요 기술 공급업체의 전략적인수는 재량적 자동화 예산에서 핵심 인프라 지출로의 전환을 시사하고 있으며, 공동 작업에 대한 규제의 명확화는 파일럿 프로젝트에서 기업 규모 롤아웃으로의 전환을 가속화하고 있습니다. 지원 로봇과 모바일 로봇의 특허 파이프라인 증가는 거시 경제가 불안정하더라도 두 자리 확장을 유지할 가능성이 높은 혁신 주기를 강조합니다.
의료용 로봇의 납입 대수는 수술 정밀도의 요구와 감염 제어 프로토콜의 엄격화를 배경으로 2024년에는 36% 증가한 약 6,100대로 증가했습니다. 물류 사업자들은 마이크로플루필먼트 센터의 전개를 가속화하고, 2030년까지 전 세계의 설치 대수는 6,600대를 넘을 것으로 예측되어, 360억 달러의 추가적인 대응 가능 풀을 창출합니다. 농업에서는 생산자가 만성적인 노동력 부족을 다루고 있는 가운데 손과 눈의 협력 로봇은 2030년까지 3,590만대에 달할 것으로 예상됩니다. 이 3가지 업종이 투자 대 효과(ROI)의 축이 되는 가운데, 서비스 로봇 시장은 비용 상쇄에서 운영 모델을 재구축하는 생산성 플랫폼으로 이동하고 있습니다. 또한 용도의 폭이 넓어지면 수익이 다양해지고 경기 변동의 영향을 받기 어려워집니다. 분야 간 상호 학습은 소프트웨어 재사용과 구성 요소 표준화를 더욱 가속화하고 개발주기를 단축하며 가격 하락을 지속합니다.
일본에서는 2040년까지 1,100만명의 노동자 부족이 예상되는 반면, 65세 이상의 인구 비율은 40%로 상승할 전망입니다. 유럽의 건강 관리는 2025년까지 38만 명의 인력 부족에 직면할 것으로 예측되며, 병원은 간병 지원 로봇과 AI 트리어지 시스템의 시험 도입을 촉구하고 있습니다. 자동화의 보급률은 전 산업에서 6%인 반면 유럽 자동차 부문에서는 36%에 달하고 있으며 다른 업종에서는 아직 여지가 있는 것으로 밝혀졌습니다. 따라서 노동력 부족은 기업이 순수한 비용 절감보다 회복력을 추구함에 따라 서비스 로봇 시장의 구조적 수요를 뒷받침합니다. 인구의 노령화는 또한 노인 관리 및 재활 소비자 애플리케이션을 확대하고 시장의 사회적 관련성을 넓히고 있습니다. 이러한 인구동태의 현실은 경기 사이클을 넘어 퍼져 투자자나 벤더에게도 장기적인 전망을 가져옵니다.
하드웨어 가격이 하락했음에도 불구하고 건설 사례에서는 생산성이 3배 가까이 향상되었음에도 불구하고 순수한 비용 지표는 로봇이 전통적인 방법보다 떨어지는 것으로 나타났습니다. 배터리 교체, 센서 재교정, 소프트웨어 라이선스 등 라이프사이클 불확실성은 전문가가 아닌 예산 구성을 복잡하게 합니다. 모바일 플랫폼은 특히 LiDAR 및 비주얼 SLAM 인프라가 드문 경우인 경우 매핑 및 현지화를 위한 추가 비용에 직면합니다. 중소기업의 대부분은 다년간의 ROI 프레임워크가 없기 때문에 보수적인 투자 자세가 되어 가격에 민감한 지역에서의 보급이 늦어지고 있습니다. 벤더는 구성 요소를 표준화하고 예측 유지보수 분석을 번들로 대항하고 있지만, 선행 비용 리스크에 대한 인식이 확산되고 있는 것이 서비스 로봇 시장의 발판이 되고 있습니다.
2024년 서비스 로봇 시장의 72%는 전문 서비스 로봇이 차지하며 물류, 청소, 검사 등에서 ROI가 실증되었습니다. 이 중 의료용 로봇은 저침습 수술과 엄격한 감염 관리 프로토콜을 요구하는 병원 수요에 힘입어 2030년까지 연평균 복합 성장률(CAGR)이 23.4%로 가장 높은 성장을 이룰 것으로 예측되고 있습니다. 이 분야는 보험 상환의 확대와 로봇이 합병증 발생률을 저하시키는 임상 증거 증가로 혜택을 받으며 병원 투자 회수 기간이 단축됩니다. 개인용 및 가정용 로봇은 소형이지만, 플로어 케어나 동반자로서의 역할로 계속 채용되고 있어 소비자가 로봇 공학에 친숙한 소지가 되고 있습니다.
보조기술의 특허건수가 증가하고 있는 것으로부터, 재활용 외골격으로부터 AI 대응의 진단 보조장치까지, 헬스케어·용도의 스펙트럼이 넓어지고 있는 것을 알 수 있습니다. 이러한 혁신 파이프라인은 규제 병목 현상이 완화되면 의료 부문의 서비스 로봇 시장 규모가 전체 규모를 초과할 가능성을 시사합니다. 산업개발팀과 임상개발팀 간의 상호 수분도 구성 요소의 공통성을 높여 비용 절감과 벤더의 이익률 향상에 공헌하고 있습니다. 그 결과 의료기기 도입은 실험적 자산에서 미션 크리티컬한 병원 인프라로 진화하고 있습니다.
2024년 서비스 로봇 시장 규모에서는 하드웨어가 65.3%의 점유율을 차지했으며, 계속해서 수익의 기간이 되었습니다. 센서, 액추에이터, 배터리는 부품표의 대부분을 차지하며 대규모 제조로 인한 비용 절감의 대부분을 차지합니다. 그러나 클라우드 런타임 환경, 플릿 오케스트레이션 레이어 및 AI 추론 엔진이 주요 차별화 요인이 되기 때문에 소프트웨어는 2030년까지 연평균 복합 성장률(CAGR) 22.1%에서 급증할 것으로 예측됩니다.
이 변화는 정기적인 라이선스 비용이 일시적인 하드웨어 이자율을 능가하는 기업 IT의 동향을 반영합니다. 자체 운영 체제를 제공하는 공급업체는 보다 안정적인 수익을 보장하고 지속적으로 알고리즘을 개선하기 위한 데이터를 수집합니다. 통합의 복잡성이 감소함에 따라 구매자는 페이로드 용량보다 소프트웨어 유연성으로 플랫폼을 평가하게 되었습니다. 예측 기간 동안 RaaS, 예지 보전, 워크플로우 최적화 등의 서비스는 서비스 로봇 시장의 하드웨어와 소프트웨어를 보완하는 세 번째 가치의 기둥으로 진화할 것으로 예측됩니다.
북미는 2024년에 세계 서비스 로봇 시장의 34.5%를 차지하며, 성숙한 자동화 인프라, 유리한 세제 우대 조치, 2024년에 64억 달러에 이르는 왕성한 벤처 자금에 지원되었습니다. 엔터프라이즈 사용자는 파일럿 플릿에서 빌딩 전체로의 전개로 전환하고 있으며, 새로운 RaaS 모델은 중견 제조업체로의 침투를 가속화하고 있습니다. 규제기관은 협력 로봇의 안전성에 대한 기대를 명확히 하고, 컴플라이언스의 모호성을 줄이고, 조달 주기의 가속화를 촉진하고 있습니다. 공공 부문 수요도 자율 검사 능력을 필요로 하는 방어와 인프라의 근대화 구상을 통해 구체화하고 있습니다.
아시아태평양의 CAGR은 가장 빠른 19.6%를 나타낼 것으로 예측되며, 2024년 중국의 서비스 로봇 생산 대수는 전년 대비 18% 증가한 871만대였습니다. 2025년까지 산업용 로봇의 53.3% 국산화를 추진하는 정부 정책은 수출 확대를 위한 강력한 자국 시장 플랫폼을 제공합니다. 일본의 서비스 로봇 산업은 심각한 노동력 부족과 문화적 수용이 고령자 간병와 호스피탈리티 분야에서의 채용을 촉진하고, 2029년까지 3배로 확대하는 기세입니다. 한국의 콩그로마리트는 소비자 일렉트로닉스의 전문 지식을 저비용의 국산 로봇에 쏟아 부어, 이 지역을 제조 허브로서, 또 수요의 중심지로서 자리매김하고 있습니다.
유럽은 설치 기반에서는 상당한 규모를 차지하지만 규제가 엄격하기 때문에 성장 속도는 완만합니다. ISO 10218과 EU 의료기기 규제의 갱신은 컴플라이언스 지출을 증가시키지만, 유럽 벤더가 수출 시장에서 활용하는 세계 벤치마크를 설정하는 것입니다. 독일은 전문용도의 서비스 로봇 공급업체의 79%를 보유하고 있으며, 2028년까지 유럽의 서비스 로봇 채용을 선도할 것으로 예측되고 있습니다. 이 지역의 경쟁력은 고정밀 엔지니어링과 기능 안전의 노하우에 있으며, 규제 산업에서 엄청난 마진을 획득하고 있습니다.
The service robotics market size reached USD 71.91 billion in 2025 and is forecast to advance to USD 175.46 billion in 2030, reflecting a 19.53% CAGR during 2025-2030.
Growth is powered by tightening labor supply in developed economies, falling robot total cost of ownership, and wider availability of Robot-as-a-Service (RaaS) plans that eliminate up-front capital hurdles. Professional deployments in logistics, healthcare, and agriculture are scaling rapidly as AI-enabled perception modules lift precision and reliability benchmarks while shortening commissioning cycles.Strategic acquisitions by large technology vendors signal a transition from discretionary automation budgets to core infrastructure spending, and regulatory clarity around collaborative operation is accelerating the shift from pilot projects to enterprise-wide rollouts. A growing pipeline of patents in assistive and mobile robotics underscores an innovation cycle that is likely to sustain double-digit expansion even through macroeconomic volatility.
Medical robot deliveries rose 36% in 2024 to about 6,100 units on the back of surgical precision requirements and stricter infection-control protocols. Logistics operators accelerated micro-fulfillment centre rollouts, with global installations projected to top 6,600 by 2030, creating an incremental USD 36 billion addressable pool.In agriculture, hand-eye coordinated robots are forecast to reach 35.9 million units by 2030 as growers tackle chronic labour shortages. As these three verticals anchor return-on-investment cases, the service robotics market is shifting from cost offsetting toward productivity platforms that re-shape operating models. The breadth of applications also diversifies revenue exposure, insulating suppliers against cyclical swings. Cross-learning between sectors further accelerates software reuse and component standardisation, compressing development cycles and sustaining price declines.
Japan anticipates an 11 million worker gap by 2040 while its over-65 cohort climbs toward 40% of the population. European healthcare faces a projected 380,000 staffing shortfall by 2025, prompting hospitals to pilot care-support robots and AI triage systems. Automation penetration stands at 36% in Europe's automotive sector versus 6% across all industries, illuminating the headroom for other verticals. Labour scarcity, therefore, underpins structural demand for the service robotics market as companies pursue resilience rather than pure cost savings. Population ageing also expands consumer-facing applications in eldercare and rehabilitation, widening the market's societal relevance. These demographic realities stretch beyond economic cycles, providing long-run visibility for investors and vendors alike.
Despite declining hardware prices, construction case studies show robots can trail conventional methods on pure cost metrics even while delivering nearly threefold productivity gains. Lifecycle uncertainties around battery replacement, sensor recalibration, and software licensing complicate budgeting for non-specialists. Mobile platforms face additional expenses for mapping and localisation, particularly where LiDAR or visual SLAM infrastructure is sparse. Many SMEs lack multi-year ROI frameworks, leading to conservative investment postures that slow penetration in price-sensitive regions. Vendors are countering by standardising components and bundling predictive-maintenance analytics, but widespread perception of upfront cost risk remains a drag on the service robotics market.
Other drivers and restraints analyzed in the detailed report include:
For complete list of drivers and restraints, kindly check the Table Of Contents.
Professional service robots controlled 72% of the service robotics market in 2024, anchored by proven ROI in logistics, cleaning, and inspection assignments. Within this cohort, medical robots are set to capture the highest growth at a 23.4% CAGR to 2030, buoyed by hospital demand for minimally invasive surgery and stringent infection-control protocols. The segment benefits from expanding insurance reimbursements and growing clinical evidence that robots reduce complication rates, which collectively shortens hospital payback periods. Personal and domestic units, while smaller, continue to find adoption in floor-care and companionship roles that prime consumer familiarity with robotics.
Growing patent volumes in assistive technologies point to a widening spectrum of healthcare applications, from rehabilitation exoskeletons to AI-enabled diagnostic aides. This innovation pipeline suggests that the service robotics market size for medical subsegments could outpace the broader aggregate once regulatory bottlenecks ease. Cross-pollination between industrial and clinical development teams is also raising component commonality, helping lower costs and lifting vendor margins. Consequently, medical deployments are evolving from experimental assets into mission-critical hospital infrastructure
Hardware remained the revenue backbone with a 65.3% share of the service robotics market size in 2024. Sensors, actuators, and batteries dominate the bill of materials and still account for most cost reductions achieved via scale manufacturing. Yet, software is projected to surge at a 22.1% CAGR through 2030 as cloud runtime environments, fleet-orchestration layers, and AI inference engines become primary differentiators.
The shift mirrors enterprise IT trends where recurring licences eclipse one-time hardware margins. Vendors offering proprietary operating systems unlock stickier revenue and gather data to refine algorithms continuously. As integration complexities shrink, buyers increasingly evaluate platforms on software flexibility rather than payload capacity. Over the forecast horizon, services such as RaaS, predictive maintenance, and workflow optimisation are expected to evolve into a third value pillar that complements hardware and software in the service robotics market.
The Service Robotics Market is Segmented by Field of Application (Professional, Personal/Domestic), Component (Hardware, Software, and More), Operating Environment (Ground, Aerial / UAV, and More), Mobility (Mobile / Autonomous, Stationary / Fixed-Base), End-User Industry (Healthcare and Medical, Logistics and Warehousing, and More), and by Geography. The Market Forecasts are Provided in Terms of Value (USD).
North America held 34.5% of the global service robotics market in 2024, underpinned by mature automation infrastructure, favourable tax incentives, and robust venture funding that hit USD 6.4 billion in 2024. Enterprise users are migrating from pilot fleets to building-wide rollouts, and new RaaS models are accelerating penetration among mid-sized manufacturers. Regulatory agencies have clarified collaborative-robot safety expectations, reducing compliance ambiguity and encouraging faster procurement cycles. Public-sector demand is also materialising through defence and infrastructure modernisation initiatives that require autonomous inspection capabilities.
Asia-Pacific is projected to record the fastest 19.6% CAGR, led by China's production of 8.71 million service robots in 2024, an 18% year-on-year increase. Government policies promoting 53.3% localisation of industrial robots by 2025 provide a strong home-market platform for export expansion. Japan's service robotics industry is on course to triple by 2029 as acute labour shortages and cultural acceptance drive adoption across eldercare and hospitality. South Korean conglomerates are funneling consumer electronics expertise into low-cost domestic robots, positioning the region as both a manufacturing hub and a demand centre.
Europe accounts for a sizeable installed base but grows at a steadier pace given stringent regulatory regimes. The updated ISO 10218 and EU Medical Device Regulation increase compliance spending, yet they also set global benchmarks that European vendors leverage in export markets. Germany hosts 79% of its service-robot suppliers in professional applications and is projected to lead European service-robotics adoption by 2028. The region's competitive edge lies in high-precision engineering and functional-safety know-how, which fetches premium margins in regulated industries.