ㅁ Add-on 가능: 고객의 요청에 따라 일정한 범위 내에서 Customization이 가능합니다. 자세한 사항은 문의해 주시기 바랍니다.
ㅁ 보고서에 따라 최신 정보로 업데이트하여 보내드립니다. 배송기일은 문의해 주시기 바랍니다.
한글목차
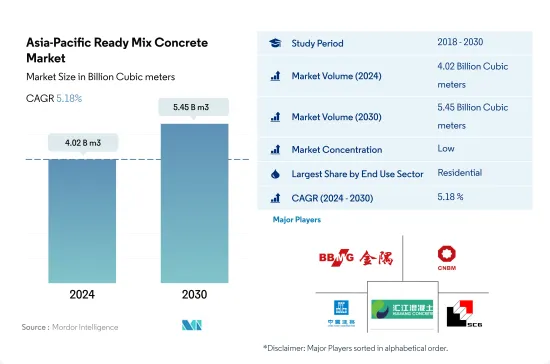
아시아태평양의 레디믹스 콘크리트 시장 규모는 2024년 40억 2,000만 입방미터로 추정되고, 2030년에는 54억 5,000만 입방 미터에 이르고, 예측 기간 중(2024-2030년) CAGR 5.18%로 성장할 것으로 예측됩니다.
아시아태평양 건설 섹터의 관민 파트너십에 의한 고액의 투자가 레디믹스 콘크리트 수요를 끌어올릴 것으로 예측됩니다.
레디믹스 콘크리트는고객의 요구와 승인된 설계 혼합에 따라 배치 플랜트에서 제조되어 주택, 인프라, 상업 빌딩 등의 건설에 널리 사용되고 있습니다. 동년 인프라 건설은 동지역의 인프라 강화를 목적으로 한 관민 파트너십의 고조로 레디믹스 콘크리트 수요에 큰 영향을 주었습니다.
2022년 레디믹스 콘크리트 시장은 주택건설이 13억 9,000만 입방미터의 최대 시장 점유율로 크게 지배했습니다. 2023년의 주택 건설용 신설 바닥 면적은 2022년에 비해 약 4억 1,000만 평방 피트 증가할 것으로 예상되고, 주택 건설용 레디믹스 콘크리트 시장은 동기간에 수량으로 8.26%의 성장이 전망됩니다.
상업건축용 레디믹스 콘크리트 시장은 중국, 인도, 한국으로부터의 급속한 수요가 예상되며 예측기간 중에 수량으로 6.86%의 가장 빠른 CAGR을 나타낼 것으로 예측됩니다.
인도네시아에서는 건설 섹터에 대한 정부 투자가 증가함에 따라 생 콘에 대한 높은 수요가 예측됩니다.
레디믹스 콘크리트은 시멘트, 물, 모래와 자갈과 같은 골재와 혼화제를 정확한 비율로 혼합한 것입니다. 주로 인프라와 주택 건설에 사용됩니다. 같은 해 인도의 레디믹스 콘크리트 시장은 2021년 대비 17.76%의 급성장을 보였습니다.
2022년, 아시아태평양의 레디믹스 콘크리트 시장은 중국에 의해 상당히 지배되었습니다. 정부의 폐쇄 조치에도 불구하고 중국의 인프라 부문은 2021-2022년까지 6.24%의 성장을 기록했습니다. 2022년에는 1,656억 달러에 달했으며, 주택 건설 부문에서는 몇 가지 개혁과 새로운 조치가 시행되어 소비자의 부동산 구매에 대한 관심이 높아졌습니다.
인도네시아의 레디믹스 콘크리트 시장은 예측기간 중에 가장 빠른 CAGR 7.31%를 나타낼 것으로 추정됩니다.
아시아태평양 생강 시장 동향
인도 등에서 소매점과 사무실 공간이 증가하고 아시아태평양의 상업 건설 섹터를 밀어 올립니다.
2022년 아시아태평양 상업시설의 신설층 면적은 전년 대비 3.23% 감소했습니다. 2023년에는 이 지역이 회복해, 상업 건설의 선설 바닥 면적은 약 1억 4,600만 평방피트 증가했습니다.이 급증은 주로 외국 직접투자(FDI) 증가로 인해 새로운 오피스, 창고, 소매점, 기타 시설 수요에 박차를 가했습니다. 특히 베트남의 건설 부문은 2023년에 7,144만 달러의 FDI 자본을 유치했습니다.
2020년 아시아태평양은 상업시설의 신설 바닥 면적에서 대폭적인 후퇴를 경험해 2019년 대비 21.92%의 수량 감소가 되었습니다. 규제가 완화됨에 따라, 이 지역은 눈부신 회복을 보이고, 2021년의 상업시설의 신설 바닥 면적은 20.98% 급증해, 약 5억 2,600만 평방 피트의 바닥 면적에 도달했습니다.
아시아태평양의 상용 신설 바닥 면적은 대폭적인 성장이 예상되며, 2023년에 비해 2030년에는 14억 1,000만 평방 피트 증가할 것으로 추정됩니다. 예를 들어, 인도의 A등급 사무소는 2026년까지 상위 7개 도시에서 10억 평방 피트, 2030년까지 12억 평방 피트까지 확대될 가능성이 있습니다.
인도에서는 2030년까지 2,500만호에 달할 가능성이 있는 등 저렴한 주택이 증가하고, 이 지역의 주택 건설이 확대됩니다.
2022년 아시아태평양의 주택 착공 바닥 면적은 전년 대비 약 5.39% 감소했습니다. 섹터는 인구 증가, 부유층 증가, 급속한 도시화에 의해 견인되고 있습니다.
2020년 아시아태평양의 주택 신설 바닥 면적은 2019년 대비 약 5.06% 감소했습니다. 이 지역에서는 대폭적인 회복을 볼 수 있어 2021년에는 주택 신설 호수 증가에 의해 주택 신설 바닥 면적이 약 14억 평방 피트 급증했습니다.
아시아태평양 주택 신축상면적은 예측기간 동안 CAGR 3.98%를 보일 것으로 예측됩니다. 이 성장은 주택 수요, 투자 증가, 유리한 정부 시책에 의한 것입니다.
아시아태평양 생강 산업 개요
아시아태평양의 레디믹스 콘크리트 시장은 부문화되어 있으며 상위 5개 기업에서 6.89%를 차지하고 있습니다.
기타 혜택
엑셀 형식 시장 예측(ME) 시트
3개월의 애널리스트 서포트
목차
제1장 주요 요약과 주요 조사 결과
제2장 보고서 제안
제3장 소개
조사의 전제조건과 시장 정의
조사 범위
조사 방법
제4장 주요 산업 동향
최종 용도 부문의 동향
상업
산업 및 시설
인프라
주택용
주요 인프라 프로젝트(현재로 발표됨)
규제 프레임워크
밸류체인과 유통채널 분석
제5장 시장 세분화
최종 용도 부문
상업
산업 및 시설
인프라
주택용
제품
센트럴 믹스
수축 믹스
트랜짓 믹스
국가명
호주
중국
인도
인도네시아
일본
말레이시아
한국
태국
베트남
기타 아시아태평양
제6장 경쟁 구도
주요 전략 동향
시장 점유율 분석
기업 상황
기업 프로파일
BBMG Corporation
China National Building Material Group Corporation
CSCEC
EUGENE GROUP
Foshan Huijiang Concrete Co., Ltd.
Mitsubishi UBE Cement Corporation
SAMPYO GROUP
SCG
Shanghai Construction Group(SCG)
UltraTech Cement Ltd.
제7장 CEO에 대한 주요 전략적 질문
제8장 부록
세계 개요
개요
Porter's Five Forces 분석 프레임워크(산업 매력도 분석)
세계의 밸류체인 분석
시장 역학(DROs)
정보원과 참고문헌
도표 일람
주요 인사이트
데이터 팩
용어집
JHS
영문 목차
영문목차
The Asia-Pacific Ready Mix Concrete Market size is estimated at 4.02 billion Cubic meters in 2024, and is expected to reach 5.45 billion Cubic meters by 2030, growing at a CAGR of 5.18% during the forecast period (2024-2030).
High investments through private-public partnerships in the Asia-Pacific construction sector are predicted to boost the demand for ready-mix concrete
Ready-mix concrete is manufactured in a batching plant according to customer requirements and approved design mix and is widely used for the construction of housing units, infrastructure, commercial buildings, etc. In 2022, the ready-mix concrete market in Asia-Pacific accounted for 75% of the global market volume share. In the same year, infrastructure construction considerably influenced ready-mix concrete demand owing to rising private-public partnerships aimed at enhancing the region's infrastructure. Furthermore, in 2023, the market was predicted to grow by 237.5 million cubic meters compared to 2022 due to numerous government propositions aimed at developing the construction sector across the region.
Residential construction significantly dominated the ready-mix concrete market in 2022, with the largest market share of 1.39 billion cubic meters. Moreover, in 2023, low mortgage rates on home purchases, along with affordable housing schemes offered by the government, will increase the demand for new residential units in Asia-Pacific. The new floor area for residential construction was expected to increase by about 410 million sq. ft in 2023 compared to 2022, and the ready-mix concrete market for residential construction is anticipated to grow by 8.26% in volume during the same period.
The ready-mix concrete market for commercial construction is estimated to register the fastest CAGR of 6.86% in volume during the forecast period, with expeditious demand anticipated from China, India, and South Korea. The new floor area for commercial construction in Asia-Pacific is projected to increase by 1.5 billion sq. ft in 2030 compared to 2022 while raising the demand for ready-mix concrete.
High demand for ready-mix concrete is forecasted in Indonesia due to rising government investments in the construction sector
Ready-mix concrete comprises cement, water, and aggregates like sand or gravel and admixtures mixed in accurate proportions. It is primarily used for infrastructure and residential construction. In 2022, the Asia-Pacific ready-mix concrete market accounted for 3.59 billion cubic meters of the global market share. In the same year, India's ready-mix concrete market displayed a sharp growth of 17.76% compared to 2021. Furthermore, in 2023, Asia-Pacific was bound to receive high investments in the residential and infrastructure construction sector, and the market is expected to grow by 6.61% compared to 2022.
In 2022, the Asia-Pacific ready-mix concrete market was considerably dominated by China. Despite the lockdowns imposed by the government, China's infrastructure sector recorded a growth of 6.24% from 2021 to 2022. This can be attributed to the high expenditure on transport infrastructure, which reached USD 165.6 billion in 2022 compared to USD 157.6 billion in 2021. Moreover, the residential construction sector witnessed several reforms and new policies that renewed consumer interest in purchasing properties. Such investments and schemes are expected to propel the growth of the construction sector. In 2023, the market was estimated to grow by 7.78% compared to 2022.
The Indonesian ready-mix concrete market is estimated to register the fastest CAGR of 7.31% during the forecast period. Following the "Capital City Bill," construction has begun on the USD 32 billion plan to relocate the country's capital city from Jakarta to Borneo Island by 2045, including housing complexes, manufacturing units, and infrastructure. A multitude of construction projects are yet to be implemented that are expected to raise ready-mix concrete demand.
Asia-Pacific Ready Mix Concrete Market Trends
Rising retail and office spaces in countries such as India to boost the Asia-Pacific commercial construction sector
In 2022, Asia-Pacific witnessed a 3.23% decline in its commercial new floor area compared to the previous year. This setback was attributed to factors such as regulatory pressures, higher inflation, and a surge in mortgage rates. In 2023, the region rebounded, with commercial construction new floor area increasing by approximately 146 million sq. ft. This surge was primarily driven by a rise in foreign direct investment (FDI), which spurred the demand for new offices, warehouses, retail outlets, and other facilities. Notably, the Vietnamese construction sector attracted an FDI capital of USD 71.44 million in 2023.
In 2020, the Asia-Pacific region experienced a significant setback in commercial new floor area, with a volume decline of 21.92% compared to 2019. This decline was primarily due to widespread government lockdowns, which disrupted project work and severely impacted supply chains, equipment, and labor. However, as restrictions eased, the region witnessed a remarkable rebound, with its commercial new floor area surging by 20.98% in 2021, reaching a volume of approximately 526 million sq. ft.
Asia-Pacific's commercial new floor area is projected to witness substantial growth, with an estimated increase of 1.41 billion sq. ft by 2030 compared to 2023. This surge is fueled by a rising demand for shopping malls, office spaces, retail outlets, and more. The Asia-Pacific region is emerging as a global retail powerhouse, contributing to nearly three-quarters of the worldwide retail growth. For instance, the Indian Grade A office market in its top seven cities may to expand to 1 billion sq. ft by 2026 and further to 1.2 billion sq. ft. by 2030. Overall, the commercial new floor area in Asia-Pacific is projected to witness a volume CAGR of 5.16% during the forecast period.
Rising affordable housing units, such as India's likely to reach 25 million by 2030, to augment the residential constructions in the region
In 2022, the residential new floor area in the Asia-Pacific region saw a volume decline of approximately 5.39% from the previous year. This dip was a result of the sector normalizing after a surge in building activity during the COVID-19 pandemic. The region's residential sector is driven by a growing population, increasing wealth, and rapid urbanization. The residential new floor area in the region was expected to rise by 410 million sq. ft in 2023 compared to 2022.
In 2020, the residential new floor area in Asia-Pacific declined in volume by around 5.06% compared to 2019. This was primarily due to government-imposed lockdowns, disruptions in the supply chain, labor shortages, reduced construction productivity, and low foreign investments. However, as restrictions eased, the region saw a significant rebound, with the residential new floor area surging by about 1.4 billion sq. ft in 2021, driven by the addition of new residential housing units. For instance, in 2021 alone, the Indian residential real estate market introduced approximately 163 thousand new residential units across its top seven cities.
The residential new floor area in the Asia-Pacific region is projected to witness a CAGR of 3.98% during the forecast period. This growth can be attributed to the demand for housing, increased investments, and favorable government policies. The focus on constructing more affordable housing units is expected to rejuvenate the residential construction sector in the region, aiding its recovery. By 2030, it is estimated that over 40% of India's population will reside in urban areas, leading to a demand for an additional 25 million affordable housing units. This surge in demand is expected to push the Indian residential real estate market to reach 1.5 million units by 2030.
Asia-Pacific Ready Mix Concrete Industry Overview
The Asia-Pacific Ready Mix Concrete Market is fragmented, with the top five companies occupying 6.89%. The major players in this market are BBMG Corporation, China National Building Material Group Corporation, CSCEC, Foshan Huijiang Concrete Co., Ltd. and Shanghai Construction Group(SCG) (sorted alphabetically).
Additional Benefits:
The market estimate (ME) sheet in Excel format
3 months of analyst support
TABLE OF CONTENTS
1 EXECUTIVE SUMMARY & KEY FINDINGS
2 REPORT OFFERS
3 INTRODUCTION
3.1 Study Assumptions & Market Definition
3.2 Scope of the Study
3.3 Research Methodology
4 KEY INDUSTRY TRENDS
4.1 End Use Sector Trends
4.1.1 Commercial
4.1.2 Industrial and Institutional
4.1.3 Infrastructure
4.1.4 Residential
4.2 Major Infrastructure Projects (current And Announced)
4.3 Regulatory Framework
4.4 Value Chain & Distribution Channel Analysis
5 MARKET SEGMENTATION (includes market size, forecasts up to 2030 and analysis of growth prospects.)
5.1 End Use Sector
5.1.1 Commercial
5.1.2 Industrial and Institutional
5.1.3 Infrastructure
5.1.4 Residential
5.2 Product
5.2.1 Central Mixed
5.2.2 Shrink Mixed
5.2.3 Transit Mixed
5.3 Country
5.3.1 Australia
5.3.2 China
5.3.3 India
5.3.4 Indonesia
5.3.5 Japan
5.3.6 Malaysia
5.3.7 South Korea
5.3.8 Thailand
5.3.9 Vietnam
5.3.10 Rest of Asia-Pacific
6 COMPETITIVE LANDSCAPE
6.1 Key Strategic Moves
6.2 Market Share Analysis
6.3 Company Landscape
6.4 Company Profiles
6.4.1 BBMG Corporation
6.4.2 China National Building Material Group Corporation
6.4.3 CSCEC
6.4.4 EUGENE GROUP
6.4.5 Foshan Huijiang Concrete Co., Ltd.
6.4.6 Mitsubishi UBE Cement Corporation
6.4.7 SAMPYO GROUP
6.4.8 SCG
6.4.9 Shanghai Construction Group(SCG)
6.4.10 UltraTech Cement Ltd.
7 KEY STRATEGIC QUESTIONS FOR CONCRETE, MORTARS AND CONSTRUCTION CHEMICALS CEOS
8 APPENDIX
8.1 Global Overview
8.1.1 Overview
8.1.2 Porter's Five Forces Framework (Industry Attractiveness Analysis)