중국의 특수 비료 시장 : 점유율 분석, 산업 동향, 통계, 성장 예측(2025-2030년)
China Specialty Fertilizer - Market Share Analysis, Industry Trends & Statistics, Growth Forecasts (2025 - 2030)
상품코드:1693508
리서치사:Mordor Intelligence
발행일:2025년 03월
페이지 정보:영문
라이선스 & 가격 (부가세 별도)
ㅁ Add-on 가능: 고객의 요청에 따라 일정한 범위 내에서 Customization이 가능합니다. 자세한 사항은 문의해 주시기 바랍니다.
ㅁ 보고서에 따라 최신 정보로 업데이트하여 보내드립니다. 배송기일은 문의해 주시기 바랍니다.
한글목차
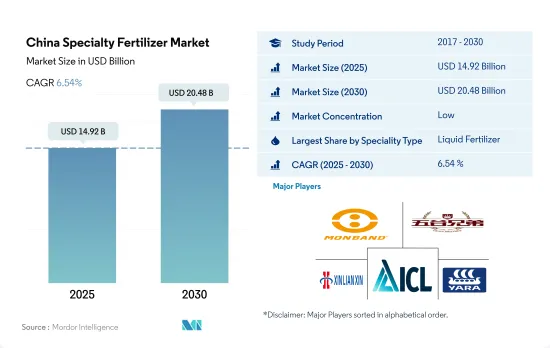
중국의 특수 비료 시장 규모는 2025년에 149억 2,000만 달러, 2030년에는 204억 8,000만 달러에 이르고, 예측 기간 중(2025-2030년) CAGR은 6.54%를 나타낼 전망입니다.
특정 영양소를 효율적으로 공급하고 시비 횟수를 줄이면 시장을 견인할 가능성이 있습니다.
특수비료시장은 2022년 중국비료시장 규모의 약 3.8%를 차지하고 있습니다.
수용성 비료는 2022년 중국의 특수 비료 시장 규모의 51.0%를 차지했습니다. 비료는 소규모 관개 시스템에서 가장 보급되고 있는 시용 방법입니다.
액체 비료는 2022년 중국의 특수 비료 시장 규모의 48.8%를 차지합니다.
방출 조절 비료는 중국의 특수 비료 시장 수량으로 다음으로 큰 시장 점유율을 차지하고 2022년에는 0.1%를 차지했습니다.방출 조절 비료 시장 점유율은 주로 최대 6개월간 양분을 공급할 수 있습니다. 가능성이 있기 때문에 영양소의 손실도 매우 적습니다.
최근의 동향에서는 중국의 수용성 비료 산업은 비료의 사용량, 물, 노동력, 코스트를 삭감해, 수량과 품질을 향상시키는 이점이 있기 때문에 근대 농업 개발을 위한 유리한 시책과 상당액의 투자를 수반해 호황을 나타내고 있습니다
중국의 특수 비료 시장 동향
재배면적의 확대는 식량 수요 증가와 주식의 자급자족을 목표로 하는 나라의 목표가 원동력이 되고 있습니다.
중국의 농작물 재배면적은 2018년 1억 2,660만 헥타르에서 2022년에는 1억 2,780만 헥타르로 약간 확대되어 전국 총경작지의 70.8%를 차지합니다. 2022년에는 옥수수가 34.2%로 최대 점유율을 차지하고, 쌀이 23.6%, 밀이 18.3%로 뒤를 이었습니다.
중국은 보통 밭작물의 생산을 봄과 여름(4월-9월)과 겨울의 두 계절로 나눕니다. 쌀과 옥수수는 중국의 농업 중에서 우선되어 중국의 곡물 생산량의 1/3을 차지하고 있습니다. 주요 쌀 생산 지역은 흑룡강성, 후난성, 강서성, 후베이성, 강소성, 사천성, 광서 치완족 자치구, 광동성, 클라우드 남성에 걸치고 있습니다. 2022-23년 중국의 옥수수 생산량은 옥수수 생산량은 성공적인 수확에 힘입어 전년대비 460만 톤 증가의 2억 7,720만 톤에 달했습니다.
중국의 작황은 봄이 중심이지만, 6월과 7월의 더운 시기에는 몇가지 어려움에 직면합니다.
세계 농지의 아산화질소 배출량의 약 28%가 중국 농지에서 배출됩니다.
1 차 영양소는 식물의 효소 활성과 같은 생화학적 과정을 개선하고 식물 세포의 성장을 가속합니다. 작물에 있어서의 질소, 칼륨, 인의 평균 시용량은 159.9kg/헥타르였습니다.
질소는 식물의 대사에 필수적이며 엽록소와 아미노산의 구성 성분이기 때문에 1차 양분에서는 제1위입니다. 질소와 인에 의한 지표수와 지하수의 오염은 비료 살포량에 관한 농업 종사자에게의 부적절한 조언의 결과라고 생각되고 있습니다.
2022년 평균 양분 시용률이 가장 높은 작물은 면(255.41kg/헥타르), 밀(232.25kg/헥타르), 옥수수(198.44kg/헥타르), 쌀(157.76kg/헥타르)로 2022년의 면화 생산량은 640만 톤으로, 중국은 세계 최대의 면화 생산국, 소비국, 수입국이 되고 있습니다.
인구 증가 수요를 충족시키기 위해서는 농작물 생산의 확대가 불가결이며, 그 결과, 농작물에의 1차 영양소의 시용은 2023-2030년에 걸쳐 증가할 것으로 예측됩니다.
중국의 특수 비료 산업 개요
중국의 특수 비료 시장은 세분화되어 있으며 상위 5개 기업에서 5.01%를 차지하고 있습니다.
기타 혜택
엑셀 형식 시장 예측(ME) 시트
3개월의 애널리스트 서포트
목차
제1장 주요 요약과 주요 조사 결과
제2장 보고서 제안
제3장 소개
조사의 전제조건과 시장 정의
조사 범위
조사 방법
제4장 주요 산업 동향
주요 작물의 작부 면적
밭작물
원예작물
평균 양분 시용률
미량영양소
밭작물
원예작물
1차 영양소
밭작물
원예작물
2차 다량 영양소
밭작물
원예작물
관개 농지
규제 프레임워크
밸류체인과 유통채널 분석
제5장 시장 세분화
스페셜리티 유형
CRF
폴리머 코트
폴리머 유황 코팅
기타
액체 비료
SRF
수용성
시비 모드
시비
잎면 살포
토양
작물 유형
밭작물
원예작물
잔디 및 관상용
제6장 경쟁 구도
주요 전략 동향
시장 점유율 분석
기업 상황
기업 프로파일
Grupa Azoty SA(Compo Expert)
Haifa Group
Hebei Monband Water Soluble Fertilizer Co. Ltd
Hebei Sanyuanjiuqi Fertilizer Co., Ltd.
Hebei Woze Wufeng Biological Technology Co., Ltd
Henan XinlianXin Chemicals Group Company Limited
ICL Group Ltd
Sociedad Quimica y Minera de Chile SA
Yara International ASA
Zouping Hongyun BIoTechnology Co., Ltd.
제7장 CEO에 대한 주요 전략적 질문
제8장 부록
세계 개요
개요
Five Forces 분석 프레임워크
세계의 밸류체인 분석
시장 역학(DROs)
정보원과 참고문헌
도표 일람
주요 인사이트
데이터 팩
용어집
SHW
영문 목차
영문목차
The China Specialty Fertilizer Market size is estimated at 14.92 billion USD in 2025, and is expected to reach 20.48 billion USD by 2030, growing at a CAGR of 6.54% during the forecast period (2025-2030).
Efficiency in providing particular nutrients and reducing the number of fertilizations may drive the market
The specialty fertilizer market accounted for about 3.8% of the market volume of the Chinese fertilizer market in 2022. The minimal market share of the specialty fertilizers market is majorly attributed to the less awareness among farmers regarding efficiency and higher cost compared to conventional specialty fertilizers.
Water-soluble fertilizers accounted for 51.0% of the Chinese specialty fertilizer market volume in 2022. The dominance of water-soluble fertilizers is majorly due to the growing adoption of irrigation agriculture and technical advancements in irrigation equipment. Fertigation is the most popular application mode used in the country's micro irrigation systems. This will drive the soluble fertilizers market during 2023-2030
Liquid fertilizers accounted for 48.8% of the Chinese specialty fertilizer market volume in 2022. Liquid fertilizers are more easily absorbed by plants and can be used with irrigation or spraying by reducing labor costs. Foliar is the most popular method used by the liquid fertilizer application.
Controlled-release fertilizers accounted for the next largest market share in the Chinese specialty fertilizer market volume, accounting for 0.1% in 2022. The market share of controlled-release fertilizers is mainly due to their potential to provide nutrients for up to six months. The loss of nutrients is also very low. However, rising awareness among farmers can increase the market share of controlled-release fertilizers in the forecast period.
In recent years, the soluble fertilizer industry in China has boomed because of its advantages in reducing fertilizer usage, water, labor, and cost, and increasing yield and quality, accompanied by favorable policies for modern agriculture development and substantial investment.
China Specialty Fertilizer Market Trends
The expansion of the cultivation area is driven by increasing demand for food and the country's goal to achieve self-sufficiency in staple food
China's cultivation area for field crops expanded marginally from 126.6 million hectares in 2018 to 127.8 million hectares in 2022, representing 70.8% of the nation's total cultivated land. In 2022, corn claimed the largest share at 34.2%, trailed by rice and wheat at 23.6% and 18.3% respectively. This uptick in cultivation area is projected to drive up fertilizer demand in the country.
China typically divides its field crop production into two seasons: spring/summer (April-September) and winter. Spring crops encompass early corn, early rice, early wheat, and cotton, while winter crops focus on winter wheat and rapeseed. Rice and corn, however, take precedence in China's agricultural landscape, accounting for a third of the nation's grain output. As the world's leading rice producer, China dedicated 30 million hectares to rice farming in 2022, yielding a bountiful 210 million tonnes. Key rice-growing regions span Heilongjiang, Hunan, Jiangxi, Hubei, Jiangsu, Sichuan, Guangxi, Guangdong, and Yunnan. China's corn production for 2022-23 was projected to hit 277.2 million tonnes, a 4.6 million-tonne increase from the previous year, buoyed by a successful harvest. The primary corn belts lie in the northeastern provinces of Heilongjiang, Jilin, and Inner Mongolia.
While spring dominates China's cropping calendar, it faces some challenges during the hotter months of June and July. Given rice's status as a dietary staple for millions, the region's high temperatures and limited rainfall exacerbate mineral depletion in the soil, necessitating higher fertilizer application. These arid conditions can also curtail crop yields.
About 28% of global nitrous oxide emissions from croplands are from China's agricultural lands
Primary nutrients improve biochemical processes like enzyme activity in plants and promote plant cell growth. Primary nutrient deficiencies can impact plant health, development, and crop production output. The average application rate of nitrogen, potassium, and phosphorus collectively in field crops was 159.9 kg/hectare in 2022. The average primary nutrient application in field crops included 65.23% nitrogen, 28.07% phosphorous, and 6.68% potassium.
Nitrogen ranks first in primary nutrients, as it is essential for plant metabolism and is a component of chlorophyll and amino acids. Nitrogen had an average application rate of 279.65 kg/hectare. This was followed by potash at 105.3 kg/hectare and phosphorous at 94.9 kg/hectare in 2022. The contamination of surface and groundwater with nitrogen and phosphorus has been considered a result of inadequate advice given to farmers regarding fertilizer application rates. About 28% of global nitrous oxide emissions from croplands are from China's agricultural lands.
In 2022, the crops with the highest average nutrient application rates were cotton (255.41 kg/hectare), wheat (232.25 kg/hectare), corn (198.44 kg/hectare), and rice (157.76 kg/hectare). In 2022, cotton production amounted to 6.4 million metric tons, making China the world's largest producer, consumer, and importer of cotton. Around 20% of the cotton consumed worldwide is produced in China, and 84% of that production comes from Xinjiang.
To meet the demands of a growing population, boosting crop production is essential; as a result, the application of primary nutrients in field crops is expected to grow from 2023 to 2030.
China Specialty Fertilizer Industry Overview
The China Specialty Fertilizer Market is fragmented, with the top five companies occupying 5.01%. The major players in this market are Hebei Monband Water Soluble Fertilizer Co. Ltd, Hebei Woze Wufeng Biological Technology Co., Ltd, Henan XinlianXin Chemicals Group Company Limited, ICL Group Ltd and Yara International ASA (sorted alphabetically).
Additional Benefits:
The market estimate (ME) sheet in Excel format
3 months of analyst support
TABLE OF CONTENTS
1 EXECUTIVE SUMMARY & KEY FINDINGS
2 REPORT OFFERS
3 INTRODUCTION
3.1 Study Assumptions & Market Definition
3.2 Scope of the Study
3.3 Research Methodology
4 KEY INDUSTRY TRENDS
4.1 Acreage Of Major Crop Types
4.1.1 Field Crops
4.1.2 Horticultural Crops
4.2 Average Nutrient Application Rates
4.2.1 Micronutrients
4.2.1.1 Field Crops
4.2.1.2 Horticultural Crops
4.2.2 Primary Nutrients
4.2.2.1 Field Crops
4.2.2.2 Horticultural Crops
4.2.3 Secondary Macronutrients
4.2.3.1 Field Crops
4.2.3.2 Horticultural Crops
4.3 Agricultural Land Equipped For Irrigation
4.4 Regulatory Framework
4.5 Value Chain & Distribution Channel Analysis
5 MARKET SEGMENTATION (includes market size in Value in USD and Volume, Forecasts up to 2030 and analysis of growth prospects)
5.1 Speciality Type
5.1.1 CRF
5.1.1.1 Polymer Coated
5.1.1.2 Polymer-Sulfur Coated
5.1.1.3 Others
5.1.2 Liquid Fertilizer
5.1.3 SRF
5.1.4 Water Soluble
5.2 Application Mode
5.2.1 Fertigation
5.2.2 Foliar
5.2.3 Soil
5.3 Crop Type
5.3.1 Field Crops
5.3.2 Horticultural Crops
5.3.3 Turf & Ornamental
6 COMPETITIVE LANDSCAPE
6.1 Key Strategic Moves
6.2 Market Share Analysis
6.3 Company Landscape
6.4 Company Profiles
6.4.1 Grupa Azoty S.A. (Compo Expert)
6.4.2 Haifa Group
6.4.3 Hebei Monband Water Soluble Fertilizer Co. Ltd