United States Specialty Fertilizer - Market Share Analysis, Industry Trends & Statistics, Growth Forecasts (2025 - 2030)
상품코드:1693501
리서치사:Mordor Intelligence
발행일:2025년 03월
페이지 정보:영문
라이선스 & 가격 (부가세 별도)
ㅁ Add-on 가능: 고객의 요청에 따라 일정한 범위 내에서 Customization이 가능합니다. 자세한 사항은 문의해 주시기 바랍니다.
ㅁ 보고서에 따라 최신 정보로 업데이트하여 보내드립니다. 배송기일은 문의해 주시기 바랍니다.
한글목차
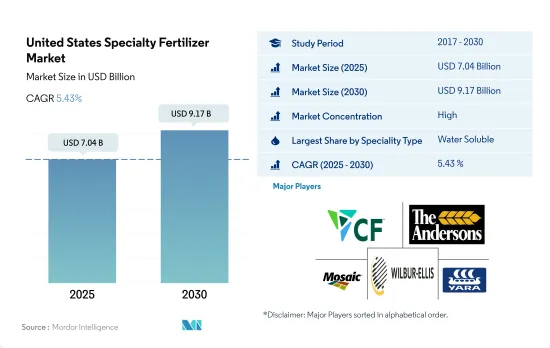
미국의 특수 비료 시장 규모는 2025년에 70억 4,000만 달러, 2030년에는 91억 7,000만 달러에 이르고, 예측 기간(2025-2030년)의 CAGR은 5.43%를 나타낼 것으로 예측됩니다.
지속 가능한 관개 농법의 채용이 증가하고 특수품의 채용이 급증
2018-2022년에 걸쳐, 미국의 특수 비료 시장은 2.5%의 수량 성장을 나타내, 그 잠재성과 다양한 작물 유형에 걸친 시장 기회의 확대에 추진되었습니다.
2022년까지 수용성 비료가 48.0%로 큰 시장 점유율을 차지했으며, 액체 비료가 46.3%, 방출 조절 비료(CRF)가 5.1%로 뒤를 이었습니다.
수용성 비료 수요는 그 다양한 영양 그레이드와, 잎면 살포, 시비, 토양 살포를 포함한 다양한 시용 방법에 의해 지지되고 있습니다. 특히, 수용성 비료는 조사 기간 중에 1.9%의 수량 성장을 기록했습니다.
미국의 액체 비료 부문은 조사 기간 동안 2.0%의 현저한 성장을 보여주었습니다.
2017년에는 5,800만 에이커의 관개농지가 있었습니다.
CAGR 5.2%로 예측되는 미국의 특수 비료 시장은 2023-2030년에 걸쳐 기세를 늘릴 것으로 예측됩니다.
미국 특수 비료 시장 동향
콩과 옥수수는 미국에서 재배되는 2대 작물입니다.
미국에서는 인구가 완만하게 증가하여 2020년 3억 3,590만 명에서 2022년에는 3억 3,820만 명으로 증가했습니다. 농업 생산성의 향상이 급무가 되고 있습니다. 작물의 수율을 높이기 위해, 비료는 오랫동안 사용되어 왔습니다.
콩과 옥수수가 미국의 주요 작물로 군림하고, 2022년에는 콩이 전미 경지 면적의 25.8%를 차지해 선두를 달리고 있으며, 옥수수가 25.7%, 밀이 11.1%로 그 뒤를 잇고 있습니다. 이 작물들은 주로 인디애나, 일리노이, 아이오와, 미주리, 네브래스카, 캔자스의 일부 지역을 포함하는 "옥수수 벨트"에서 주로 재배되고 있습니다. 옥수수와 콩 생산이 이 지역을 지배하고 있습니다.
농업자재 제조업체는 농업 종사자의 정확한 시비를 지원하기 위해, 적극적으로 기술 혁신을 실시했습니다.이것은 재배 코스트를 억제할 뿐만 아니라, 효율도 높여지고 있습니다.
질소 결핍은 미국의 작물 면적 전체에서 가장 널리 보이는 작물 양분 문제 중 하나입니다.
밭작물의 1차 양분(질소, 칼륨, 인)의 평균 사용량은 약 166.61킬로그램/헥타르입니다.질소는 45.93%, 칼륨은 28.11%, 인은 25.96%입니다.
농작물에서는 채소, 카놀라의 평균 1차 양분 사용량은 284.92킬로그램/헥타르이며, 밭작물에서 가장 높은 비율을 보였습니다.
옥수수가 둘째로 많고, 그 후 채소, 카놀라에서 평균 245.40킬로그램/헥타르입니다.
1차 영양소는 식물의 성장에 필수적이며 식물 효소의 기능을 높이고 식물 세포의 성장과 생화학적 프로세스를 개선합니다.
미국의 특수 비료 산업 개요
미국의 특수 비료 시장은 상당히 통합되어 있으며 상위 5개 기업에서 73.24%를 차지하고 있습니다.
기타 혜택
엑셀 형식 시장 예측(ME) 시트
3개월의 애널리스트 서포트
목차
제1장 주요 요약과 주요 조사 결과
제2장 보고서 제안
제3장 소개
조사의 전제조건과 시장 정의
조사 범위
조사 방법
제4장 주요 산업 동향
주요 작물의 작부 면적
밭작물
원예작물
평균 양분 시용률
미량영양소
밭작물
원예작물
1차 영양소
밭작물
원예작물
2차 다량 영양소
밭작물
원예작물
관개 농지
규제 프레임워크
밸류체인과 유통채널 분석
제5장 시장 세분화
스페셜리티 유형
CRF
폴리머 코트
폴리머 유황 코팅
기타
액체 비료
SRF
수용성
시비 모드
시비
잎면 살포
토양
작물 유형
밭작물
원예작물
잔디 및 관상용
제6장 경쟁 구도
주요 전략 동향
시장 점유율 분석
기업 상황
기업 프로파일
CF Industries Holdings, Inc.
Haifa Group
ICL Group Ltd
Koch Industries Inc.
Nutrien Ltd.
Sociedad Quimica y Minera de Chile SA
The Andersons Inc.
The Mosaic Company
Wilbur-Ellis Company LLC
Yara International ASA
제7장 CEO에 대한 주요 전략적 질문
제8장 부록
세계 개요
개요
Five Forces 분석 프레임워크
세계의 밸류체인 분석
시장 역학(DROs)
정보원과 참고문헌
도표 일람
주요 인사이트
데이터 팩
용어집
SHW
영문 목차
영문목차
The United States Specialty Fertilizer Market size is estimated at 7.04 billion USD in 2025, and is expected to reach 9.17 billion USD by 2030, growing at a CAGR of 5.43% during the forecast period (2025-2030).
The adoption of sustainable and irrigation agricultural practices is on the rise, leading to a surge in specialty adoption
From 2018 to 2022, the specialty fertilizer market in the United States witnessed a 2.5% volume growth, propelled by its potential and expanding market opportunities across diverse crop types.
By 2022, water-soluble fertilizers commanded a significant market share of 48.0%, followed by liquid fertilizers at 46.3% and controlled-release fertilizers (CRF) at 5.1%. In contrast, slow-release fertilizers held a modest 0.6% share, primarily due to their limited adoption in major crops like wheat, maize, and other cereals.
The demand for water-soluble fertilizers is buoyed by their diverse nutrient grades and versatile application methods, including foliar, fertigation, and soil application. Notably, water-soluble fertilizers witnessed a 1.9% volume growth during the study period.
The liquid fertilizers segment in the United States witnessed a notable 2.0% growth during the study period. This growth can be attributed to factors such as the rising adoption of precision farming, the ease of application, and the availability of wagons. Furthermore, the country's expanding micro-irrigation system is poised to further bolster this segment's growth.
In 2017, the country had 58 million acres of irrigated cropland. The even distribution of water-soluble fertilizers through the developing micro-irrigation system led to heightened nutrient availability, resulting in improved nutrient supplementation efficiency.
With a projected CAGR of 5.2%, the US specialty fertilizer market is set to gain momentum from 2023 to 2030. This growth is underpinned by a heightened governmental focus on curbing the environmental impact of conventional fertilizers and the concurrent surge in technological and scientific advancements.
United States Specialty Fertilizer Market Trends
Soybean and corn are the two largest crops grown in the United States
The United States witnessed a modest population growth, rising from 335.9 million in 2020 to 338.2 million in the year 2022. Over the past two decades, the nation's farmland area has shrunk by nearly 50 million acres, settling at 893.4 million acres by 2022. This diminishing farmland underscores the urgency to enhance agricultural productivity through Agri inputs. Fertilizers have long been employed to bolster crop yields. In 2022, four key crops, such as corn, cotton, soybean, and wheat, collectively commanded over 65.7% of the principal crop acreage in the United States.
Soybean and corn reign as the top crops in the United States, with soybean leading the pack in the year 2022, occupying 25.8% of the nation's arable land, followed closely by corn at 25.7%, and wheat at 11.1%. These crops predominantly thrive in the "Corn Belt," encompassing parts of Indiana, Illinois, Iowa, Missouri, Nebraska, and Kansas. Corn and soybean production dominates this region. Furthermore, the United States emerges as a significant rice exporter, with cultivation concentrated in three Southern regions and one in California, as per the United States Department of Agriculture.
Manufacturers of farm inputs are actively innovating to aid farmers in precise fertilizer application. This not only curbs cultivation costs but also bolsters efficiency. The US field crop sector holds substantial market potential, and with a surge in government funding and support, it is poised for positive growth in the coming years.
Nitrogen deficiency is one of the most prevalent crop nutrient problems across the cropping areas in the United States
In the field crop's average primary nutrients (Nitrogen, Potassium, and Phosphorus) application rate in the country is about 166.61 kilogram/Hectare. Nitrogen accounts for 45.93 %, Potassium accounts for 28.11 percentage, and phosphorus accounts for 25.96 percentage of total field crops' average primary nutrient application.
In field crops, Rapeseed/Canola was applied with an average primary nutrient application rate of 284.92 kilogram/Hectare, which is the highest in field crops. In primary nutrients, Nitrogen occupies first place with an average application rate of 229.60 kilogram/Hectare. This is because Nitrogen is required in large amounts for plant metabolism and it is a major component of chlorophyll and amino acids.
Corn/ Maize is the second largest followed by Rapeseed/ Canola with an average primary nutrient application rate of 245.40 kilogram/ Hectare. Corn accounts for about 31.44 percentage of total field crop production in the United States. The Nitrogen requirement of corn is about 50.06 percentage, phosphorus is 23.77 percentage, and Potash is 26.17 percentage of the total average primary nutrient application.
The primary nutrients are crucial for plant growth and boost the plant enzyme function, improving plant cell growth and biochemical processes. The deficiency of primary nutrients can affect plant health, growth, and crop production output. The application of primary nutrients in field crops is anticipated to increase to meet the demand by increasing productivity.
United States Specialty Fertilizer Industry Overview
The United States Specialty Fertilizer Market is fairly consolidated, with the top five companies occupying 73.24%. The major players in this market are CF Industries Holdings, Inc., The Andersons Inc., The Mosaic Company, Wilbur-Ellis Company LLC and Yara International ASA (sorted alphabetically).
Additional Benefits:
The market estimate (ME) sheet in Excel format
3 months of analyst support
TABLE OF CONTENTS
1 EXECUTIVE SUMMARY & KEY FINDINGS
2 REPORT OFFERS
3 INTRODUCTION
3.1 Study Assumptions & Market Definition
3.2 Scope of the Study
3.3 Research Methodology
4 KEY INDUSTRY TRENDS
4.1 Acreage Of Major Crop Types
4.1.1 Field Crops
4.1.2 Horticultural Crops
4.2 Average Nutrient Application Rates
4.2.1 Micronutrients
4.2.1.1 Field Crops
4.2.1.2 Horticultural Crops
4.2.2 Primary Nutrients
4.2.2.1 Field Crops
4.2.2.2 Horticultural Crops
4.2.3 Secondary Macronutrients
4.2.3.1 Field Crops
4.2.3.2 Horticultural Crops
4.3 Agricultural Land Equipped For Irrigation
4.4 Regulatory Framework
4.5 Value Chain & Distribution Channel Analysis
5 MARKET SEGMENTATION (includes market size in Value in USD and Volume, Forecasts up to 2030 and analysis of growth prospects)