인도네시아의 레디믹스 콘크리트 시장 : 시장 점유율 분석, 산업 동향 및 통계, 성장 예측(2025-2030년)
Indonesia Ready Mix Concrete - Market Share Analysis, Industry Trends & Statistics, Growth Forecasts (2025 - 2030)
상품코드:1687957
리서치사:Mordor Intelligence
발행일:2025년 03월
페이지 정보:영문
라이선스 & 가격 (부가세 별도)
ㅁ Add-on 가능: 고객의 요청에 따라 일정한 범위 내에서 Customization이 가능합니다. 자세한 사항은 문의해 주시기 바랍니다.
ㅁ 보고서에 따라 최신 정보로 업데이트하여 보내드립니다. 배송기일은 문의해 주시기 바랍니다.
한글목차
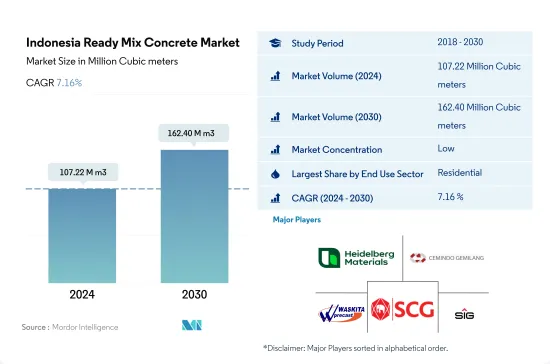
인도네시아의 레디믹스 콘크리트 시장 규모는 2024년에 1억 722만 입방미터로 평가되었고, 2030년에는 1억 6,240만 입방미터에 이를 전망이며, 예측 기간 2024년부터 2030년까지 CAGR은 7.16%로 성장할 것으로 예측됩니다.
트랜짓 믹스 유형이 상업 부문에서 인도네시아 콘크리트 시장 성장을 견인
모든 부문에서 2022년 인도네시아의 레디믹스 콘크리트 수요는 현장 타설 믹스 콘크리트의 사용이 증가했기 때문에 2021년보다 크게 감소했습니다. 이 결과, 2022년의 전국의 레디믹스 콘크리트 소비량은 2021년에 비해 15.7% 감소했습니다. 그러나 2023년에는 주택과 상업 등 모든 최종 용도 부문에서 높은 성장을 이루었기 때문에 전체 소비량은 2022년 대비 21.4% 증가한 것으로 평가되었습니다.
인도네시아에서 레디믹스 콘크리트 모르타르의 소비량은 주택 부문이 가장 많습니다. 예를 들어, 2022년에 주택 부문은 인도네시아 전반의 콘크리트 소비량의 약 40%의 점유율을 차지했습니다. 이 부문에서 가장 선호되는 레디믹스 콘크리트 유형은 트랜짓 믹스로 2022년 소비량의 76%를 차지했습니다.
주택에 이어 건설 면적이 크기 때문에 인도네시아에서 가장 레디믹스 콘크리트 소비량이 많은 것은 산업 및 시설 부문입니다. 예를 들어 2022년에는 산업 및 시설 부문이 국내 신설 바닥 면적의 31%를 차지했습니다. 이 부문에서 수축 믹스 유형의 레디믹스 콘크리트 수요는 예측 기간(2023-2030년)에 가장 빠른 CAGR 8.3%를 나타낼 것으로 예상됩니다.
인도네시아의 레디믹스 콘크리트 수요는 예측 기간 동안 상업 부문에서 가장 빠른 CAGR 8.94%로 성장을 지속하고, 성장할 것으로 예측됩니다. 이것은 주로 예측 기간 동안 CAGR 9.20%의 성장이 예상되는 전송 믹스의 사용 때문입니다. 트랜짓 믹스는 2022년 일본의 레디믹스 콘크리트 수요의 73%를 차지했습니다.
인도네시아의 레디믹스 콘크리트 시장 동향
인도네시아의 상업용 부동산 시장 규모는 2028년까지 1조 3,900억 달러에 달할 것으로 예측되며, 상업 부문 수요가 증가할 가능성이 높습니다.
2022년 인도네시아의 신규 상업층 면적은 전년 대비 9.7% 감소했습니다. 이 침체는 COVID-19 팬데믹 시 건축 활동의 침체에서 평상시로 돌아온 결과입니다. 유행 이전부터 인도네시아 상업 건물의 연간 에너지 원단위는 하락세를 보였으며 그 비율은 연률 2.64%였습니다. 그러나 2023년에는 회복이 보였고, 새로운 사무실, 창고, 소매공간을 필요로 하는 외국직접투자(FDI)의 급증이 원동력이 되어 새로운 상업층 면적이 5.7% 증가했습니다.
COVID-19가 대유행하는 가운데 2020년과 2021년 인도네시아는 약 960만 평방 피트를 차지하는 신규 상업층 면적의 대폭적인 급증을 보였습니다. 정부가 경제 활성화에 주력한 결과, 민간 및 공공 프로젝트 모두 건설 관련 검역이 완화되는 등의 조치가 취해졌습니다. 이를 통해 직원은 현장에서 일을 재개하고 기업은 사업을 계속할 수 있습니다. 특필해야 할 것은 인도네시아의 완성 공사고가 2020년에는 약 1조 3,200억 IDR에 달하였고, 2021년에는 1조 4,200억 IDR로 증가했다는 것입니다.
인도네시아의 신규 상업층 면적은 2023년 대비 2030년까지 약 58.72%의 대폭적인 성장이 예측되었습니다. 이러한 급증은 쇼핑몰, 사무실 및 기타 상업 공간에 대한 수요 증가로 인한 것입니다. 소매 부동산 부문은 일본에서 특히 매혹적인 부문으로 부상하고 있습니다. 예를 들어 상업용 부동산 시장 규모는 2028년까지 1조 3,900억 달러에 달할 것으로 예상됩니다. 인도네시아의 상업용 신설 바닥 면적은 예측 기간 동안 CAGR 6.82%로 성장을 지속하고, 안정적인 성장을 유지할 것으로 예상됩니다.
주택 수요 증가가 주택 부문 성장을 가속할 가능성이 높
2022년 인도네시아의 주택 신설 바닥 면적은 2021년 대비 7.10% 증가했습니다. 이 급증은 인구 증가, 부유화, 도시화로 인한 것입니다. 정부 주도의 주택 지원은 2022년에 29조 루피에 이르렀고, 주택 대출 유동성 시설 체계 하에서 2023년에는 32조 루피로 증가할 것으로 예측됩니다. 이 이니셔티브는 최소 22만 호의 주택 건설을 목표로 합니다. 주택 건설 부문은 현저한 성장을 이룰 전망입니다. 2023년에는 전년 대비 약 5,600만 평방피트로 증가할 것으로 추정됩니다.
2020년 인도네시아의 주택 신축상 면적은 2019년 대비 7.06% 증가했습니다. 이는 정부의 전략적 움직임으로 경기침체를 완화하고 수입감소에 고민하는 가계를 지원하기 위해 건설을 우선시했습니다. 그 결과 검역을 포함한 건설 활동의 한계가 크게 완화되었습니다. 그러나 2021년에는 동향이 역전하여 주택 착공 바닥 면적은 약 12.54% 감소했습니다. 이것은 주로 건설 부문에 대한 외국 직접 투자(FDI)의 침체에 기인합니다. 2021년 건설에 대한 FDI는 전년 대비 51% 감소했습니다.
인도네시아의 주택 신설 바닥 면적은 예측 기간 동안 수량 기준으로 CAGR 6.08%의 성장이 예상됩니다. 이 성장은 정부의 이니셔티브와 국내외 투자에 의해 뒷받침되는 이 나라의 도시화의 발전으로 인한 것입니다. 이러한 요인은 직접적 및 간접적으로, 이 나라에서 주택 요구의 고조를 강조하고, 결국 주택 건설을 촉진합니다. 급증하는 수요를 충족시키기 위해서는 2030년까지 연간 82만 호에서 100만 호의 주택이 필요할 것으로 예측됩니다.
인도네시아 레디믹스 콘크리트 산업 개요
인도네시아의 레디믹스 콘크리트 시장은 단편화되어 상위 5개사에서 7%를 차지하고 있습니다. 이 시장 주요 기업은 다음과 같습니다. Heidelberg Materials, PT Cemindo Gemilang Tbk, PT Waskita Beton Precast Tbk, SCG and SIG(sorted alphabetically).
기타 혜택
엑셀 형식 시장 예측(ME) 시트
3개월의 애널리스트 서포트
목차
제1장 주요 요약 및 주요 조사 결과
제2장 보고서 제안
제3장 서문
조사 전제조건 및 시장 정의
조사 범위
조사 방법
제4장 주요 산업 동향
최종 용도 분야의 동향
상업
산업 및 시설
인프라
주택
주요 인프라 프로젝트(현재 및 발표됨)
규제 프레임워크
밸류체인 및 유통채널 분석
제5장 시장 세분화
최종 용도 분야별
상업
산업 및 시설
인프라
주택
제품별
센트럴 믹스
수축 믹스
트랜짓 믹스
제6장 경쟁 구도
주요 전략 동향
시장 점유율 분석
기업 상황
기업 프로파일
Heidelberg Materials
Kalla Group.
PT Cemindo Gemilang Tbk
PT Waskita Beton Precast Tbk
PT. Adhimix Precast Indonesia
PT. Beton Indotama Surya
PT. Fresh Beton Indonesia
PT. Modernland Realty Tbk.
SCG
SIG
제7장 CEO에 대한 주요 전략적 질문
제8장 부록
세계 개요
개요
Porter's Five Forces 분석 프레임워크(산업 매력도 분석)
세계의 밸류체인 분석
시장 역학(DROs)
정보원 및 참고문헌
도표 일람
주요 인사이트
데이터 팩
용어집
AJY
영문 목차
영문목차
The Indonesia Ready Mix Concrete Market size is estimated at 107.22 million Cubic meters in 2024, and is expected to reach 162.40 million Cubic meters by 2030, growing at a CAGR of 7.16% during the forecast period (2024-2030).
Transit mixed type to drive the growth of the Indonesian ready mix concrete market in the commercial sector
Across all sectors, the demand for ready mix concrete in Indonesia in 2022 was significantly lower than in 2021 due to more use of on-site mix concrete. This resulted in the country's overall consumption of ready mix concrete being 15.7% lower in 2022 compared to 2021. However, in 2023, as high growth was anticipated across all end-use sectors, such as residential and commercial, the overall consumption was estimated to grow by 21.4% compared to 2022.
The residential sector accounts for the highest consumption volume of ready mix mortar in Indonesia. For instance, in 2022, the residential sector held a share of around 40% of the total ready mix concrete volume consumption across Indonesia. The most preferred type of ready mix concrete in the sector is transit mixed, which accounted for 76% of the consumption in 2022.
After residential, the highest volume of ready mix concrete in Indonesia is consumed in the industrial & institutional sector as it has the largest construction area after residential. For instance, in 2022, the industrial & institutional sector accounted for 31% of the total new floor area of the country. The demand for shrink-mixed type ready mix concrete in the sector is expected to record the fastest CAGR of 8.3% during the forecast period (2023-2030).
The overall demand for ready mix concrete in Indonesia is anticipated to grow, with the fastest CAGR of 8.94% in the commercial sector during the forecast period. This is mainly due to the usage of transit mix in the sector, which is expected to grow with a CAGR of 9.20% during the forecast period. Transit mix accounted for 73% of the country's ready mix concrete demand in 2022.
Indonesia Ready Mix Concrete Market Trends
Indonesian commercial real estate market volume is projected to reach USD 1.39 trillion by 2028 and is likely to augment the demand for commercial sector
In 2022, Indonesia witnessed a 9.7% decline in the volume of new commercial floor area compared to the previous year. This drop was a result of a return to normalcy following a decline in building activities during the COVID-19 pandemic. Even before the pandemic, commercial buildings in Indonesia were already showing a downward trend in annual energy intensity, accounting for a rate of 2.64% per year. However, in 2023, the country saw a rebound, registering a 5.7% increase in the volume of new commercial floor area, driven by a surge in foreign direct investment (FDI) necessitating new offices, warehouses, and retail spaces.
Amidst the COVID-19 pandemic, in 2020 and 2021, Indonesia witnessed a significant surge in the volume of new commercial floor area, accounting for approximately 9.6 million square feet. The government's focus on revitalizing the economy led to measures such as easing construction-related quarantines, both in private and public projects. This allowed employees to resume work on-site and companies to continue their operations. Notably, the value of completed constructions in Indonesia stood at around IDR 1.32 quadrillion in 2020 and rose to IDR 1.42 quadrillion in 2021.
The volume of new commercial floor area in Indonesia is projected to witness a robust growth of around 58.72% by 2030 compared to 2023. This surge is driven by a rising demand for shopping malls, offices, and other commercial spaces. The retail real estate segment is emerging as a particularly captivating sector in the country. For instance, the volume of the commercial real estate market is anticipated to reach USD 1.39 trillion by 2028. The commercial new floor area in Indonesia is expected to maintain steady growth, registering a CAGR of 6.82% during the forecast period.
Increase in demand for housing units is likely to augment the residential sector's growth
In 2022, Indonesia witnessed a 7.10% volume growth in residential new floor area compared to 2021. This surge can be attributed to increased population, wealth, and urbanization. The government-led housing aid reached IDR 29 trillion in 2022, which was projected to increase to IDR 32 trillion in 2023 under the Housing Financing Liquidity Facility scheme. This initiative aims to construct at least 220 thousand houses. The residential construction sector is poised to witness a significant growth rate. It was estimated to increase to approximately 56 million square feet in 2023 compared to the preceding year.
In 2020, the volume of residential new floor areas in Indonesia grew by 7.06% compared to 2019. This was a strategic move by the government, prioritizing construction to mitigate the economic downturn and support households grappling with reduced incomes. Consequently, restrictions on construction activities, including quarantines, were significantly eased. However, in 2021, the trend reversed, with a decline of about 12.54% in residential new floor area, primarily attributed to a dip in foreign direct investment (FDI) in the construction sector. FDI for construction plummeted by 51% in 2021 compared to the previous year.
The residential new floor area in Indonesia is projected to witness a CAGR of 6.08% in volume during the forecast period. This growth stems from the country's increasing urbanization, bolstered by government initiatives and foreign and domestic investments. These factors, directly and indirectly, underscore the mounting housing needs in the nation, ultimately driving residential building construction. Projections indicate that to meet the escalating demand, the country would require between 820,000 and 1 million housing units annually by 2030.
Indonesia Ready Mix Concrete Industry Overview
The Indonesia Ready Mix Concrete Market is fragmented, with the top five companies occupying 7%. The major players in this market are Heidelberg Materials, PT Cemindo Gemilang Tbk, PT Waskita Beton Precast Tbk, SCG and SIG (sorted alphabetically).
Additional Benefits:
The market estimate (ME) sheet in Excel format
3 months of analyst support
TABLE OF CONTENTS
1 EXECUTIVE SUMMARY & KEY FINDINGS
2 REPORT OFFERS
3 INTRODUCTION
3.1 Study Assumptions & Market Definition
3.2 Scope of the Study
3.3 Research Methodology
4 KEY INDUSTRY TRENDS
4.1 End Use Sector Trends
4.1.1 Commercial
4.1.2 Industrial and Institutional
4.1.3 Infrastructure
4.1.4 Residential
4.2 Major Infrastructure Projects (current And Announced)
4.3 Regulatory Framework
4.4 Value Chain & Distribution Channel Analysis
5 MARKET SEGMENTATION (includes market size, forecasts up to 2030 and analysis of growth prospects.)
5.1 End Use Sector
5.1.1 Commercial
5.1.2 Industrial and Institutional
5.1.3 Infrastructure
5.1.4 Residential
5.2 Product
5.2.1 Central Mixed
5.2.2 Shrink Mixed
5.2.3 Transit Mixed
6 COMPETITIVE LANDSCAPE
6.1 Key Strategic Moves
6.2 Market Share Analysis
6.3 Company Landscape
6.4 Company Profiles
6.4.1 Heidelberg Materials
6.4.2 Kalla Group.
6.4.3 PT Cemindo Gemilang Tbk
6.4.4 PT Waskita Beton Precast Tbk
6.4.5 PT. Adhimix Precast Indonesia
6.4.6 PT. Beton Indotama Surya
6.4.7 PT. Fresh Beton Indonesia
6.4.8 PT. Modernland Realty Tbk.
6.4.9 SCG
6.4.10 SIG
7 KEY STRATEGIC QUESTIONS FOR CONCRETE, MORTARS AND CONSTRUCTION CHEMICALS CEOS
8 APPENDIX
8.1 Global Overview
8.1.1 Overview
8.1.2 Porter's Five Forces Framework (Industry Attractiveness Analysis)