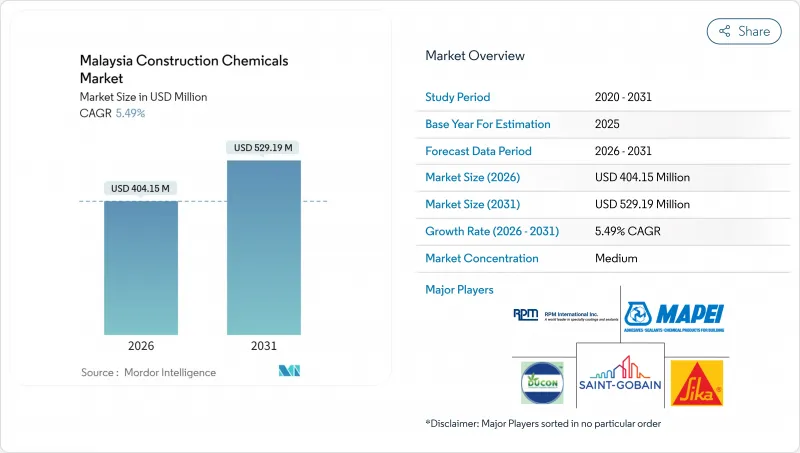
¸»·¹À̽þÆÀÇ °Ç¼³¿ë ÈÇÐÁ¦Ç° : ½ÃÀå Á¡À¯À² ºÐ¼®, »ê¾÷ µ¿Çâ ¹× Åë°è, ¼ºÀå ¿¹Ãø(2025-2030³â)
Malaysia Construction Chemicals - Market Share Analysis, Industry Trends & Statistics, Growth Forecasts (2025 - 2030)
»óǰÄÚµå
:
1684079
¸®¼Ä¡»ç
:
Mordor Intelligence Pvt Ltd
¹ßÇàÀÏ
:
2025³â 03¿ù
ÆäÀÌÁö Á¤º¸
:
¿µ¹®
¶óÀ̼±½º & °¡°Ý (ºÎ°¡¼¼ º°µµ)
¤± Add-on °¡´É: °í°´ÀÇ ¿äû¿¡ µû¶ó ÀÏÁ¤ÇÑ ¹üÀ§ ³»¿¡¼ CustomizationÀÌ °¡´ÉÇÕ´Ï´Ù. ÀÚ¼¼ÇÑ »çÇ×Àº ¹®ÀÇÇØ Áֽñ⠹ٶø´Ï´Ù.
¤± º¸°í¼¿¡ µû¶ó ÃֽŠÁ¤º¸·Î ¾÷µ¥ÀÌÆ®ÇÏ¿© º¸³»µå¸³´Ï´Ù. ¹è¼Û±âÀÏÀº ¹®ÀÇÇØ Áֽñ⠹ٶø´Ï´Ù.
¸»·¹À̽þÆÀÇ °Ç¼³¿ë ÈÇÐÁ¦Ç° ½ÃÀå ±Ô¸ð´Â 2024³â¿¡ 3¾ï 8,800¸¸ ´Þ·¯·Î ÃßÁ¤µÇ¸ç, 2030³â¿¡´Â 5¾ï 3,732¸¸ ´Þ·¯¿¡ ´ÞÇÒ °ÍÀ¸·Î ¿¹»óµÇ¸ç, ¿¹Ãø ±â°£(2024-2030³â) µ¿¾È ¿¬Æò±Õ 5.58%ÀÇ CAGR·Î ¼ºÀåÇÒ °ÍÀ¸·Î ¿¹»óµË´Ï´Ù.
Àú·ÅÇÑ ÁÖÅà °Ç¼³·Î °Ç¼³¿ë ÈÇÐÁ¦Ç° ¼ö¿ä Áõ°¡ Àü¸Á
- 2022³â ¸»·¹À̽þÆÀÇ °Ç¼³¿ë ÈÇÐÁ¦Ç° ½ÃÀåÀº »ó¾÷ ºÎ¹®°ú »ê¾÷ ¹× ½Ã¼³ ºÎ¹®ÀÇ ¼ö¿ä Áõ°¡¿¡ ÈûÀÔ¾î ±Ý¾× ±âÁØÀ¸·Î 6.91%·Î ¼ºÀåÇßÀ¸¸ç, 2023³â±îÁö ¸»·¹À̽þÆÀÇ °Ç¼³¿ë ÈÇÐÁ¦Ç°Àº ¾Æ½Ã¾ÆÅÂÆò¾ç ½ÃÀåÀÇ ¾à 1%¸¦ Â÷ÁöÇÒ °ÍÀ¸·Î ÃßÁ¤µË´Ï´Ù.
- ¸»·¹À̽þƿ¡¼´Â »ê¾÷ ¹× ½Ã¼³ ºÎ¹®ÀÌ 2022³â ¾à 32.77%¸¦ Â÷ÁöÇÏ¸ç °Ç¼³¿ë ÈÇÐÁ¦Ç°ÀÇ ÃÖ´ë ¼ÒºñÀÚ·Î ºÎ»óÇß½À´Ï´Ù. ¿¹Ãø¿¡ µû¸£¸é, 2030³â±îÁö ÀÌ ºÎ¹®ÀÇ ½Å±Ô °ÇÃà ¸éÀûÀº 2023³â ´ëºñ 303¸¸ Æò¹æÇÇÆ® Áõ°¡ÇÒ °ÍÀ¸·Î ¿¹»óµË´Ï´Ù. ÀÌ·¯ÇÑ ¼ºÀåÀº »ê¾÷, ±³À° ¹× ÀÇ·á °Ç¼³¿¡ ´ëÇÑ ÅõÀÚ Áõ°¡¿¡ ±âÀÎÇÕ´Ï´Ù. µµ½ÃÈ ¹× »ê¾÷È µîÀÇ ¿äÀÎÀÌ ÀÌ ºÐ¾ßÀÇ ¼ºÀåÀ» ´õ¿í ÃËÁøÇϰí ÀÖ½À´Ï´Ù. ±× °á°ú, ÀÌ ºÎ¹®ÀÇ °Ç¼³¿ë ÈÇÐÁ¦Ç° ¼ö¿ä´Â 2023³â 1¾ï 1,700¸¸ ´Þ·¯¿¡¼ 2030³â 1¾ï 5,700¸¸ ´Þ·¯·Î Áõ°¡ÇÒ °ÍÀ¸·Î ¿¹»óµË´Ï´Ù.
- ¸»·¹À̽þÆÀÇ ÁÖÅà ºÎ¹®Àº °Ç¼³¿ë ÈÇÐÁ¦Ç°ÀÇ °¡Àå ºü¸£°Ô ¼ºÀåÇÏ´Â ½ÃÀåÀ¸·Î, ¿¹Ãø ±â°£ µ¿¾È 6.45%ÀÇ CAGRÀ» ±â·ÏÇÒ °ÍÀ¸·Î ¿¹»óµË´Ï´Ù. ¸»·¹À̽þÆÀÇ ½Å±Ô ÁÖ°Å¿ë ¹Ù´Ú ¸éÀûÀº 2023³â 1¾ï 8,800¸¸ Æò¹æÇÇÆ®¿¡¼ 2030³â 2¾ï 5,000¸¸ Æò¹æÇÇÆ®·Î ±ÞÁõÇÒ °ÍÀ¸·Î ¿¹»óµË´Ï´Ù. ÀÌ·¯ÇÑ ¼ºÀåÀÇ ¿øµ¿·ÂÀº Áö¼ÓÀûÀÎ ÁÖÅà ¼ö¿ä, ÅõÀÚ Áõ°¡, ¿ìÈ£ÀûÀÎ Á¤ºÎ Á¤Ã¥ÀÔ´Ï´Ù. ƯÈ÷, Àú·ÅÇÑ ÁÖÅà °Ç¼³ÀÌ ¸»·¹ÀÌ½Ã¾Æ ÁÖÅà °Ç¼³ ºÎ¹®¿¡ Ȱ·ÂÀ» ºÒ¾î³ÖÀ» °ÍÀ¸·Î º¸ÀÔ´Ï´Ù. ±× °á°ú, ÁÖÅà ºÎ¹®ÀÇ °Ç¼³¿ë ÈÇÐÁ¦Ç° ¼ö¿ä´Â 2023³â ´ëºñ 2030³â±îÁö 4,823¸¸ ´Þ·¯ Áõ°¡ÇÒ °ÍÀ¸·Î ¿¹»óµË´Ï´Ù.
¸»·¹À̽þÆÀÇ °Ç¼³¿ë ÈÇÐÁ¦Ç° ½ÃÀå µ¿Çâ
°Ç¼³¿¡ ´ëÇÑ ¿Ü±¹ÀÎ Á÷Á¢ÅõÀÚ°¡ ±¹³» »ó¾÷ °ø°£ ¼ö¿ä¸¦ Áõ°¡½Ãų °¡´É¼ºÀÌ ³ô½À´Ï´Ù.
- 2022³â ¸»·¹À̽þÆÀÇ »ó¾÷¿ë °Ç¼³ ÇÁ·ÎÁ§Æ®°¡ Àü³â ´ëºñ 16% Áõ°¡ÇÏ¿© Äڷγª ÆÒµ¥¹ÍÀ¸·Î ÀÎÇÑ °æÁ¦ ȸº¹À» ¹Ý¿µÇß½À´Ï´Ù. ÀÌ·¯ÇÑ È¸º¹¼¼´Â 2022³â GDP°¡ 2021³â ´ëºñ 8.7% Áõ°¡ÇÑ °ÍÀ¸·Î ³ªÅ¸³µÀ¸¸ç, 2023³â¿¡µµ °æÁ¦°¡ ¾ÈÁ¤µÉ °ÍÀ¸·Î ¿¹»óµÊ¿¡ µû¶ó »ó¾÷¿ë °Ç¼³ ºÎ¹®Àº ²ÙÁØÈ÷ »ó½Â¼¼¸¦ À̾ ż¼¸¦ °®Ãß°í ÀÖ½À´Ï´Ù. ¿¹Ãø¿¡ µû¸£¸é, ½Å±Ô °ÇÃà ¸éÀûÀº 4.35% Áõ°¡ÇÏ¿© 2022³â¿¡µµ ±× ±â¼¼¸¦ ´õ¿í °¡¼ÓÈÇÒ °ÍÀ¸·Î º¸ÀÔ´Ï´Ù.
- »ó¾÷¿ë °ÇÃà ºÎ¹®Àº 2020³â°ú 2021³â¿¡ ½Å±Ô ¹Ù´Ú ¸éÀûÀÇ ±Þ°ÝÇÑ °¨¼Ò¶ó´Â Çϰ ±¹¸é¿¡ Á÷¸éÇßÀ¸¸ç, 2020³â¿¡´Â 2019³â ´ëºñ 54%, 2021³â¿¡´Â 2020³â ´ëºñ 32%ÀÇ °¨¼Ò¸¦ ±â·ÏÇßÀ¸¸ç, 2021³â¿¡´Â MCO(À̵¿Á¦ÇÑ·É)ÀÇ Àü±¹Àû ½ÃÇàÀ» Æ÷ÇÔÇÑ ±ÔÁ¦ °È°¡ ÀÌ ºÎ¹®ÀÇ »ý»êÀ» ´õ¿í ÀúÇØÇß½À´Ï´Ù. ÀÌ ºÎ¹®ÀÇ »ý»êÀ» ´õ¿í ÀúÇØÇß½À´Ï´Ù. º¸°í¼¿¡ µû¸£¸é, ¸»·¹À̽þƿ¡¼´Â MCO¸¸À¸·Î ÃÖ¼Ò 6°³¿ùÀÇ °Ç¼³ Áö¿¬ÀÌ ¹ß»ýÇß´Ù°í ÇÕ´Ï´Ù.
- ÇâÈÄ ¸»·¹À̽þÆÀÇ »ó¾÷¿ë °Ç¼³ ºÎ¹®Àº ¿¹Ãø ±â°£(2023-2030³â) µ¿¾È 4.67%ÀÇ CAGRÀ» ±â·ÏÇÏ¸ç °·ÂÇÑ ¼ºÀåÀ» º¸ÀÏ °ÍÀ¸·Î ¿¹»óµË´Ï´Ù. ÀÌ·¯ÇÑ ¹àÀº Àü¸ÁÀº ÃÖ±Ù ¸î ³â µ¿¾È ¿Ü±¹ÀÎ Á÷Á¢ÅõÀÚ(FDI)°¡ ±ÞÁõÇÑ µ¥ ±âÀÎÇÕ´Ï´Ù. ƯÈ÷ ¸»·¹À̽þƴ 2021³â°ú 2022³â¿¡ °Ç¼³, ³ó¾÷, Á¦Á¶¾÷, ±¤¾÷ ¹× ä¼®¾÷ µî ´Ù¾çÇÑ ºÐ¾ß¿¡¼ FDI°¡ Å©°Ô À¯ÀԵǾú½À´Ï´Ù. ÀÌ·¯ÇÑ Ãß¼¼´Â ÇâÈÄ ¸î ³â µ¿¾È »ç¹«½Ç, ¼Ò¸Å¼¾ÅÍ, È£ÅÚ µî »ó¾÷¿ë °ø°£¿¡ ´ëÇÑ ¼ö¿ä¸¦ ÃËÁøÇÒ °ÍÀ¸·Î ¿¹»óµË´Ï´Ù.
¸»·¹À̽þÆÀÇ µµ½Ã Àα¸ Áõ°¡´Â ÁÖÅà ºÎ¹® ¼ºÀåÀÇ ÁÖ¿ä ¿øµ¿·ÂÀÔ´Ï´Ù.
- ¸»·¹À̽þÆÀÇ ¼¼ÀÔÀº COVID-19 ±ÔÁ¦ ¿ÏÈ¿Í °ßÁ¶ÇÑ °æ±â ȸº¹¿¡ ÈûÀÔ¾î 2022³â GDPÀÇ 16.5%¸¦ Â÷ÁöÇÏ´Â 2,944¾ï MYR·Î ±ÞÁõÇß½À´Ï´Ù. ÀÌ¿¡ µû¶ó ÁÖÅà ºÎ¹®ÀÇ 2022³â »ý»ê·®Àº Àü³â ´ëºñ 9.28% Áõ°¡Çß½À´Ï´Ù. ÁÖÅà °Ç¼³Àº ´õ¿í ¼ºÀåÇÏ¿© 2023³â ½Å±Ô ÁÖÅà °Ç¼³ ¸éÀûÀÌ 4% °¡±îÀÌ Áõ°¡ÇÒ °ÍÀ¸·Î ¿¹»óµË´Ï´Ù. ÀÌ·¯ÇÑ ¸ð¸àÅÒÀº Skim Jaminan Kredit PerumahanÀ» ÅëÇÑ 4¾ï 3,340¸¸ ´Þ·¯ÀÇ ÁÖ¸ñÇÒ ¸¸ÇÑ º¸Áõ°ú Àú¼ÒµæÃþ ÁÖÅÃÀ» ´ë»óÀ¸·Î ÇÑ ³ë·Â µî 2022³â ¿¹»ê¾È¿¡ ¸í½ÃµÈ Á¤ºÎ Á¶Ä¡¿¡ ±âÀÎÇÕ´Ï´Ù.
- 2019³â ÁÖÅà ºÎ¹®Àº ±¤¹üÀ§ÇÑ °Ç¼³ ºÒȲÀ» ¹Ý¿µÇÏ¿© ½Å±Ô °ÇÃà ¸éÀûÀÌ Àü³â ´ëºñ 6.22% °¨¼ÒÇß½À´Ï´Ù. ¿¹¸¦ µé¾î, ¸»·¹À̽þÆÀÇ ÁÖÅà °Ç¼³ °ø»ç ±Ý¾×Àº 2019³â 3ºÐ±â¿¡ 2.7 % °¨¼ÒÇßÀ¸¸ç, 2020³âÀÇ COVID-19 ´ëÀ¯ÇàÀº »óȲÀ» ´õ¿í ¾ÇȽÃÄÑ 2019³â ´ëºñ 12.22 % ±Þ°¨Çß½À´Ï´Ù. ÀÌ Ç϶ô¼¼´Â 2021³â±îÁö Áö¼ÓµÇ¾úÀ¸¸ç, ÁÖ¿ä ¿øÀÎÀº Æó¼â Á¶Ä¡¿Í ³ëµ¿·Â ºÎÁ·À̾ú½À´Ï´Ù.
- ÀÌ·¯ÇÑ Ä§Ã¼¿¡µµ ºÒ±¸ÇÏ°í ¸»·¹À̽þÆÀÇ µµ½ÃÈ ÃßÁøÀº Á¤ºÎ ÀÌ´Ï¼ÅÆ¼ºê¿Í ±¹³»¿Ü ÅõÀÚ¿¡ ÈûÀÔ¾î ¸»·¹À̽þÆÀÇ ÁÖÅà ¼ö¿ä¸¦ ÃËÁøÇϰí ÀÖÀ¸¸ç, 2022³â µµ½Ã Àα¸´Â Àü³â ´ëºñ 1.76% Áõ°¡ÇßÀ¸¸ç, ÀÌ·¯ÇÑ Ãß¼¼´Â ¾ÕÀ¸·Îµµ °è¼ÓµÉ °ÍÀ¸·Î ¿¹»óµË´Ï´Ù. ÇâÈÄ ÁÖÅà ºÎ¹®Àº ¿¹Ãø ±â°£ µ¿¾È ½Å±Ô ÁÖÅà ¸éÀûÀÇ CAGRÀÌ 4.18%¿¡ ´ÞÇÒ °ÍÀ¸·Î ¿¹»óµË´Ï´Ù. ÀÌ·¯ÇÑ ¼ºÀå ±ËÀûÀº Á¤ºÎÀÇ 12Â÷ ¸»·¹ÀÌ½Ã¾Æ °èȹ¿¡ µû¶ó Àú·ÅÇÑ ÁÖÅà °ø±ÞÀ» ÃËÁøÇϱâ À§ÇÑ °øµ¿ÀÇ ³ë·Â¿¡ ÀÇÇØ µÞ¹ÞħµÇ°í ÀÖ½À´Ï´Ù.
¸»·¹À̽þÆÀÇ °Ç¼³¿ë ÈÇÐÁ¦Ç° »ê¾÷ °³¿ä
¸»·¹À̽þÆÀÇ °Ç¼³¿ë ÈÇÐÁ¦Ç° ½ÃÀåÀº »ó´çÈ÷ ÅëÇյǾî ÀÖÀ¸¸ç, »óÀ§ 5°³ ±â¾÷ÀÌ 69.59%¸¦ Á¡À¯Çϰí ÀÖ½À´Ï´Ù. ÀÌ ½ÃÀåÀÇ ÁÖ¿ä ±â¾÷Àº Cementaid International Group of Companies, Fosroc, Inc., MBCC Group, Saint-Gobain and Sika AG(¾ËÆÄºª¼øÀ¸·Î Á¤·Ä)ÀÔ´Ï´Ù.
±âŸ ÇýÅÃ
- ¿¢¼¿ Çü½ÄÀÇ ½ÃÀå ¿¹Ãø(ME) ½ÃÆ®
- 3°³¿ù ¾Ö³Î¸®½ºÆ® Áö¿ø
¸ñÂ÷
Á¦1Àå ÁÖ¿ä ¿ä¾à°ú ÁÖ¿ä Á¶»ç °á°ú
Á¦2Àå º¸°í¼ ¿ÀÆÛ
Á¦3Àå ¼Ò°³
- Á¶»ç °¡Á¤°ú ½ÃÀå Á¤ÀÇ
- Á¶»ç ¹üÀ§
- Á¶»ç ¹æ¹ý
Á¦4Àå ÁÖ¿ä »ê¾÷ µ¿Çâ
- ÃÖÁ¾ ¿ëµµ ºÎ¹® µ¿Çâ
- »ó¾÷
- »ê¾÷¡¤½Ã¼³
- ÀÎÇÁ¶ó
- ÁÖÅÃ
- ÁÖ¿ä ÀÎÇÁ¶ó ÇÁ·ÎÁ§Æ®(ÇöÀç ¹× ¹ßÇ¥µÈ)
- ±ÔÁ¦ ÇÁ·¹ÀÓ¿öÅ©
- ¹ë·ùüÀΰú À¯Åë ä³Î ºÐ¼®
Á¦5Àå ½ÃÀå ¼¼ºÐÈ(½ÃÀå ±Ô¸ð, 2030³â±îÁö ¿¹Ãø, ¼ºÀå Àü¸Á ºÐ¼®À» Æ÷ÇÔ)
- ÃÖÁ¾ ¿ëµµ ºÎ¹®
- »ó¾÷
- »ê¾÷¡¤½Ã¼³
- ÀÎÇÁ¶ó
- ÁÖÅÃ
- Á¦Ç°
- Á¢ÂøÁ¦
- ¼ºê ÇÁ·Î´öÆ®º°
- ÇÖ¸áÆ®
- ¹ÝÀÀ¼º
- ¿ëÁ¦Çü
- ¼ö¼º
- ¾ÞÄ¿¿Í ±×¶ó¿ìÆ®
- ¼ºê ÇÁ·Î´öÆ®º°
- ½Ã¸àÆ®°è °íÁ¤Àç
- ¼öÁö °íÁ¤
- ±âŸ À¯Çü
- ÄÜÅ©¸®Æ® È¥ÈÁ¦
- ¼ºê ÇÁ·Î´öÆ®º°
- ÃËÁøÁ¦
- °ø±â È¥ÀÔ È¥ÈÁ¦
- °í¹üÀ§ °¨¼öÁ¦(Ãʰ¡¼ÒÁ¦)
- Áö¿¬Á¦
- ¼öÃà Àú°¨ È¥ÈÁ¦
- Á¡µµ Á¶Á¤Á¦
- °¨¼öÁ¦(°¡¼ÒÁ¦)
- ±âŸ À¯Çü
- ÄÜÅ©¸®Æ® º¸È£ ÄÚÆÃ
- ¼ºê ÇÁ·Î´öÆ®º°
- ¾ÆÅ©¸±°è
- ¾Ë۵å
- ¿¡Æø½Ã
- Æú¸®¿ì·¹Åº
- ±âŸ ¼öÁö
- ¹Ù´Ú¿ë ¼öÁö
- ¼ºê ÇÁ·Î´öÆ®º°
- ¾ÆÅ©¸±
- ¿¡Æø½Ã
- Æú¸®¾Æ½ºÆÄ¶ó±ä
- Æú¸®¿ì·¹Åº
- ±âŸ ¼öÁö À¯Çü
- º¸¼ö¡¤Àç»ý ÄɹÌÄÃ
- ¼ºê ÇÁ·Î´öÆ®º°
- ¼¶À¯ ·¦ÇÎ ½Ã½ºÅÛ
- ÁÖÀÔ ±×¶ó¿ìÆ®Àç
- ¸¶ÀÌÅ©·Î ÄÜÅ©¸®Æ® ¸ð¸£Å¸¸£
- °³Áú ¸ð¸£Å¸¸£
- ö±Ù º¸È£Àç
- ½Ç¸µÀç
- ¼ºê ÇÁ·Î´öÆ®º°
- ¾ÆÅ©¸±
- ¿¡Æø½Ã
- Æú¸®¿ì·¹Åº
- ½Ç¸®ÄÜ
- ±âŸ ¼öÁö
- Ç¥¸é ó¸® ¾àǰ
- ¼ºê ÇÁ·Î´öÆ®º°
- °æÈ ÄÄÆÄ¿îµå
- ÀÌÇüÁ¦
- ±âŸ Á¦Ç° À¯Çü
- ¹æ¼ö ¼Ö·ç¼Ç
- ¼ºê ÇÁ·Î´öÆ®º°
- ÈÇÐÁ¦Ç°
- ¸âºê·¹ÀÎ
Á¦6Àå °æÀï ±¸µµ
- ÁÖ¿ä Àü·« µ¿Çâ
- ½ÃÀå Á¡À¯À² ºÐ¼®
- ±â¾÷ »óȲ
- ±â¾÷ °³¿ä
- Ardex Group
- Cementaid International Group of Companies
- Dribond Construction Chemicals
- Ducon Construction Chemicals Industries Ltd.
- Fosroc, Inc.
- MAPEI S.p.A.
- MBCC Group
- MC-Bauchemie
- Saint-Gobain
- Sika AG
Á¦7Àå CEO¿¡ ´ëÇÑ ÁÖ¿ä Àü·«Àû Áú¹®
Á¦8Àå ºÎ·Ï
- ¼¼°è °³¿ä
- °³¿ä
- Five Forces ºÐ¼® ÇÁ·¹ÀÓ¿öÅ©(»ê¾÷ ¸Å·Âµµ ºÐ¼®)
- ¼¼°èÀÇ ¹ë·ùüÀÎ ºÐ¼®
- ½ÃÀå ¿ªÇÐ(DROs)
- Á¤º¸ Ãâó¿Í Âü°í¹®Çå
- µµÇ¥
- ÁÖ¿ä ÀλçÀÌÆ®
- µ¥ÀÌÅÍÆÑ
- ¿ë¾îÁý
ksm
¿µ¹® ¸ñÂ÷
The Malaysia Construction Chemicals Market size is estimated at 388.00 million USD in 2024, and is expected to reach 537.32 million USD by 2030, growing at a CAGR of 5.58% during the forecast period (2024-2030).
The rise in affordable housing unit construction is likely to boost the demand for construction chemicals
- In 2022, Malaysia's construction chemicals market saw a 6.91% growth in value, driven by rising demand from the commercial and industrial & institutional sectors. By 2023, Malaysia's construction chemicals were estimated to represent approximately 1% of the broader Asia-Pacific market.
- The industrial & institutional sector emerged as the largest consumer of construction chemicals in Malaysia, accounting for about 32.77% in 2022. Projections indicate that the sector's new floor area in the country will surge by 3.03 million square feet by 2030, compared to 2023. This growth is attributed to increased investments in industrial, education, and healthcare construction. Factors like urbanization and industrialization are further bolstering this sector's growth. Consequently, the demand for construction chemicals in this sector is expected to rise from USD 117 million in 2023 to USD 157 million in 2030.
- Malaysia's residential sector is poised to be the fastest-growing consumer of construction chemicals, with a projected CAGR of 6.45% during the forecast period. The new residential floor area in the country is anticipated to surge from 188 million square feet in 2023 to 250 million square feet in 2030. This growth is driven by sustained housing demand, increased investments, and favorable government policies. Notably, the construction of affordable housing units is set to invigorate Malaysia's residential construction sector. Consequently, the demand for construction chemicals in the residential sector is projected to rise by USD 48.23 million by 2030, compared to 2023.
Malaysia Construction Chemicals Market Trends
Foreign direct investments into construction is likely to boost demand for commercial spaces in the country
- In 2022, Malaysia witnessed a 16% surge in commercial construction projects compared to the previous year, reflecting the nation's economic rebound from the COVID-19 pandemic. This recovery was evident in the country's GDP, which saw an 8.7% uptick in 2022 over 2021. With the anticipation of continued economic stability in 2023, the commercial construction sector is poised for a steady ascent. Forecasts indicate a 4.35% rise in new floor area, building on the momentum of 2022.
- The commercial construction sector faced a downturn in 2020 and 2021, with a sharp decline in new floor areas. In 2020, the reduction was a significant 54% compared to 2019, followed by a 32% drop in 2021 relative to 2020. Stricter regulations in 2021, including the nationwide implementation of the MCO (movement control order), further hampered the sector's output. Reports highlighted that the MCO alone led to construction delays of at least six months in Malaysia.
- Looking ahead, the commercial construction sector in Malaysia is poised for robust growth, with a projected CAGR of 4.67% during the forecast period (2023-2030). This positive trajectory can be attributed to the surge in foreign direct investments (FDI) witnessed in recent years. Notably, Malaysia saw a substantial influx of FDI across diverse sectors like construction, agriculture, manufacturing, and mining & quarrying in both 2021 and 2022. This trend is expected to fuel demand for commercial spaces, spanning offices, retail centers, hotels, and more, in the years to come.
The rising urban population in Malaysia is the major driving factor for the residential sector's growth
- Malaysia's revenue surged to MYR 294.4 billion, accounting for 16.5% of its GDP in 2022, bolstered by eased COVID-19 restrictions and a robust economic upturn. In line with this, the residential sector witnessed a 9.28% uptick in volume output in 2022 compared to the previous year. Residential constructions were poised for further growth, with a projected nearly 4% increase in new floor area in 2023. This momentum was attributed to government measures outlined in the Budget 2022, including a notable USD 433.4 million guarantee via Skim Jaminan Kredit Perumahan and initiatives targeting housing for low-income groups.
- In 2019, the residential sector saw a 6.22% dip in new floor area compared to the preceding year, reflecting a broader construction downturn. For instance, the value of residential construction work in Malaysia declined by 2.7% in Q3 2019. The COVID-19 pandemic in 2020 exacerbated the situation, leading to a steeper 12.22% drop in volume output compared to 2019. This decline persisted through 2021, largely due to lockdown measures and labor shortages.
- Despite these setbacks, Malaysia's urbanization drive, bolstered by government initiatives and both domestic and foreign investments, is fueling the country's housing demands. In 2022, the urban population saw a 1.76% increase from the previous year, and this trend is expected to continue. Looking ahead, the residential sector is projected to witness a CAGR of 4.18% in new floor areas during the forecast period. This growth trajectory is underpinned by a concerted effort to boost the supply of affordable housing, aligning with the government's 12th Malaysia Plan.
Malaysia Construction Chemicals Industry Overview
The Malaysia Construction Chemicals Market is fairly consolidated, with the top five companies occupying 69.59%. The major players in this market are Cementaid International Group of Companies, Fosroc, Inc., MBCC Group, Saint-Gobain and Sika AG (sorted alphabetically).
Additional Benefits:
- The market estimate (ME) sheet in Excel format
- 3 months of analyst support
TABLE OF CONTENTS
1 EXECUTIVE SUMMARY & KEY FINDINGS
2 REPORT OFFERS
3 INTRODUCTION
- 3.1 Study Assumptions & Market Definition
- 3.2 Scope of the Study
- 3.3 Research Methodology
4 KEY INDUSTRY TRENDS
- 4.1 End Use Sector Trends
- 4.1.1 Commercial
- 4.1.2 Industrial and Institutional
- 4.1.3 Infrastructure
- 4.1.4 Residential
- 4.2 Major Infrastructure Projects (current And Announced)
- 4.3 Regulatory Framework
- 4.4 Value Chain & Distribution Channel Analysis
5 MARKET SEGMENTATION (includes market size, forecasts up to 2030 and analysis of growth prospects.)
- 5.1 End Use Sector
- 5.1.1 Commercial
- 5.1.2 Industrial and Institutional
- 5.1.3 Infrastructure
- 5.1.4 Residential
- 5.2 Product
- 5.2.1 Adhesives
- 5.2.1.1 By Sub Product
- 5.2.1.1.1 Hot Melt
- 5.2.1.1.2 Reactive
- 5.2.1.1.3 Solvent-borne
- 5.2.1.1.4 Water-borne
- 5.2.2 Anchors and Grouts
- 5.2.2.1 By Sub Product
- 5.2.2.1.1 Cementitious Fixing
- 5.2.2.1.2 Resin Fixing
- 5.2.2.1.3 Other Types
- 5.2.3 Concrete Admixtures
- 5.2.3.1 By Sub Product
- 5.2.3.1.1 Accelerator
- 5.2.3.1.2 Air Entraining Admixture
- 5.2.3.1.3 High Range Water Reducer (Super Plasticizer)
- 5.2.3.1.4 Retarder
- 5.2.3.1.5 Shrinkage Reducing Admixture
- 5.2.3.1.6 Viscosity Modifier
- 5.2.3.1.7 Water Reducer (Plasticizer)
- 5.2.3.1.8 Other Types
- 5.2.4 Concrete Protective Coatings
- 5.2.4.1 By Sub Product
- 5.2.4.1.1 Acrylic
- 5.2.4.1.2 Alkyd
- 5.2.4.1.3 Epoxy
- 5.2.4.1.4 Polyurethane
- 5.2.4.1.5 Other Resin Types
- 5.2.5 Flooring Resins
- 5.2.5.1 By Sub Product
- 5.2.5.1.1 Acrylic
- 5.2.5.1.2 Epoxy
- 5.2.5.1.3 Polyaspartic
- 5.2.5.1.4 Polyurethane
- 5.2.5.1.5 Other Resin Types
- 5.2.6 Repair and Rehabilitation Chemicals
- 5.2.6.1 By Sub Product
- 5.2.6.1.1 Fiber Wrapping Systems
- 5.2.6.1.2 Injection Grouting Materials
- 5.2.6.1.3 Micro-concrete Mortars
- 5.2.6.1.4 Modified Mortars
- 5.2.6.1.5 Rebar Protectors
- 5.2.7 Sealants
- 5.2.7.1 By Sub Product
- 5.2.7.1.1 Acrylic
- 5.2.7.1.2 Epoxy
- 5.2.7.1.3 Polyurethane
- 5.2.7.1.4 Silicone
- 5.2.7.1.5 Other Resin Types
- 5.2.8 Surface Treatment Chemicals
- 5.2.8.1 By Sub Product
- 5.2.8.1.1 Curing Compounds
- 5.2.8.1.2 Mold Release Agents
- 5.2.8.1.3 Other Product Types
- 5.2.9 Waterproofing Solutions
- 5.2.9.1 By Sub Product
- 5.2.9.1.1 Chemicals
- 5.2.9.1.2 Membranes
6 COMPETITIVE LANDSCAPE
- 6.1 Key Strategic Moves
- 6.2 Market Share Analysis
- 6.3 Company Landscape
- 6.4 Company Profiles
- 6.4.1 Ardex Group
- 6.4.2 Cementaid International Group of Companies
- 6.4.3 Dribond Construction Chemicals
- 6.4.4 Ducon Construction Chemicals Industries Ltd.
- 6.4.5 Fosroc, Inc.
- 6.4.6 MAPEI S.p.A.
- 6.4.7 MBCC Group
- 6.4.8 MC-Bauchemie
- 6.4.9 Saint-Gobain
- 6.4.10 Sika AG
7 KEY STRATEGIC QUESTIONS FOR CONCRETE, MORTARS AND CONSTRUCTION CHEMICALS CEOS
8 APPENDIX
- 8.1 Global Overview
- 8.1.1 Overview
- 8.1.2 Porter's Five Forces Framework (Industry Attractiveness Analysis)
- 8.1.3 Global Value Chain Analysis
- 8.1.4 Market Dynamics (DROs)
- 8.2 Sources & References
- 8.3 List of Tables & Figures
- 8.4 Primary Insights
- 8.5 Data Pack
- 8.6 Glossary of Terms
°ü·ÃÀÚ·á