건설 보수 및 개수용 화학제품 시장 : 시장 점유율 분석, 산업 동향 및 통계, 성장 예측(2025-2030년)
Construction Repair and Rehabilitation Chemicals - Market Share Analysis, Industry Trends & Statistics, Growth Forecasts (2025 - 2030)
상품코드:1684061
리서치사:Mordor Intelligence
발행일:2025년 03월
페이지 정보:영문
라이선스 & 가격 (부가세 별도)
ㅁ Add-on 가능: 고객의 요청에 따라 일정한 범위 내에서 Customization이 가능합니다. 자세한 사항은 문의해 주시기 바랍니다.
ㅁ 보고서에 따라 최신 정보로 업데이트하여 보내드립니다. 배송기일은 문의해 주시기 바랍니다.
한글목차
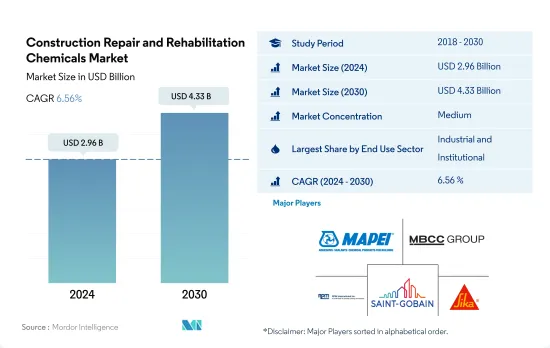
건설 보수 및 개수용 화학제품 시장 규모는 2024년에 29억 6,000만 달러로 평가되었고, 2030년에는 43억 3,000만 달러에 이를 전망이며, 시장 추계 및 예측 기간인 2024-2030년 CAGR 6.56%로 성장할 것으로 예측됩니다.
산업 건설 증가가 건설 보수 및 개수용 화학제품 수요를 견인할 것 같습니다.
세계의 건설 보수 및 개수용 화학제품 시장은 2022년에 금액으로 4.72%의 성장을 이루었지만, 이것은 상업, 공업 및 시설 건설 부문에서의 수요 증가에 견인된 것입니다. 이 성장은 2023년도 계속되어 2022년 대비 4.64%의 성장이 평가되었습니다.
2022년에는 공업 및 시설 분야가 압도적인 소비자로서 부상해, 건설 보수 및 개수용 화학제품 시장의 약 48.20%를 차지했습니다. 이 부문의 바닥 면적은 2023년에 90억 2,000만 평방 피트 확대될 것으로 예상되며, 이는 주로 산업, 교육 및 헬스케어 건설에 대한 투자 증가로 인한 것입니다. 그 결과, 이 분야의 건설 보수 및 개수용 화학제품 수요는 2023년에 약 5.25% 증가할 것으로 예상됩니다.
향후 산업 및 시설 분야는 성장 궤도를 유지하고 2023년부터 2030년까지의 CAGR은 금액 기준으로 7%로 예측됩니다. 이 부문의 세계 기존 바닥 면적은 2023년에 3,600억 평방 피트에 이르렀으며, 2030년에는 4,290억 평방 피트가 될 것으로 예측됩니다. 또한 인도, 인도네시아, 베트남 등의 경제가 급증하고 있으며, 이들 국가의 효율적인 공장 수요를 충족하는 산업용 부동산의 필요성에 큰 영향을 미치고 있습니다. 그 결과 이 분야의 보수 및 개수용 화학제품 시장은 2023년 13억 3,000만 달러에서 2030년에는 21억 5,000만 달러로 급증할 것으로 예상됩니다.
따라서 예측 기간 동안 상당한 성장이 예상됩니다.
건설 보수 및 개수용 화학제품 시장의 미래는 아시아태평양 국가의 GDP 성장에 영향을 받습니다.
세계의 건설 보수 및 개수용 화학제품 시장은 2022년에 금액 베이스로 5% 증가했지만, 이것은 건축물이 및 인프라 개수의 급증이 원동력이 되었습니다. 이러한 이니셔티브는 경제 성장을 가속하고 에너지 효율 기준을 강화하는 것을 목표로 합니다. 세계의 건설 보수 및 개수용 화학제품 시장은 북미와 아시아태평양이 견인해, 2023년에는 금액 베이스로 한층 더 4.6%의 성장을 기록한 것으로 평가되고 있습니다.
중국, 일본, 인도 등의 국가들이 견인하는 아시아태평양은 세계 건설 보수 및 개수용 화학제품 소비를 지배하고 있습니다. 이 3개국만으로 2022년 시장 매출의 28%를 차지했습니다. 특필해야 할 것은 주입 그라우트 재료에 이어 마이크로 콘크리트 모르타르가 아시아태평양 시장에 크게 기여한 것입니다.
유럽은 건설 보수 및 개수용 화학제품의 소비량으로 2위에 랭크되고 있으며 독일, 프랑스, 영국이 주요한 공헌국입니다. 2022년에는 이들 3개국이 유럽 시장액의 47% 가까이를 차지했습니다. 산업, 시설 및 인프라 분야는 유럽에서 화학 물질의 주요 소비자입니다.
아시아태평양은 2023년부터 2030년까지 금액 기준 CAGR 7.12%로 건설 보수 및 개수용 화학제품 시장에서 가장 높은 성장을 이룰 것으로 예측되고 있습니다. 이 성장은 인도, 중국, 태국, 일본을 포함한 이 지역의 견조한 경제에 의해 촉진될 것으로 보입니다. 특히 중국과 인도의 GDP는 각각 연률 5.2%와 5.9%로 성장하고 있습니다.
세계의 건설 보수 및 개수용 화학제품 시장 동향
상업 건설 투자 및 오피스 공간 증가로 상업 부문을 밀어올릴 가능성이 높습니다.
2022년 세계의 상업 부문은 사무실, 호텔, 소매 쇼핑몰과 같은 부동산 수요의 급증으로 견인되어 바닥 면적이 2% 증가했습니다. 특필해야 할 것은 인도의 소매 업계로 상위 7개 도시에서 몰 면적이 260만 평방 피트를 넘어 2021년부터 27% 급증했습니다. 다음 2023년에는 세계 상업 부문의 바닥 면적이 약 68억 평방 피트 급증했는데, 이는 주로 외국 직접투자(FDI)의 급증에 힘입어 세계에 새로운 사무실, 창고, 소매점포가 필요하게 되었습니다.
2018년부터 2021년까지 세계 상업 부문의 바닥 면적은 6.33% 확대되었습니다. 2021년에는 세계 거의 390개 대도시에서 사무실 가동률이 80% 이상인 견조한 성장세를 보였습니다. 또한 2021년 3분기부터 3천만 평방피트의 사무실 공간이 순수하게 흡수되었습니다. 그 결과, 2021년 세계 상업 부문의 바닥 면적은 전년 대비 약 65억 평방피트 확대되었습니다.
예측에 따르면 세계 상업 부문의 바닥 면적은 예측 기간 동안 수량 기준으로 2.21%의 연평균 복합 성장률(CAGR)을 기록할 전망입니다. 이 성장의 원동력이 되는 것은 상업 건설 지출과 사무실 공간에 대한 수요 증가입니다. 예를 들어 미국의 상업 시설 건설 지출은 2027년까지 6,460억 달러에 달할 전망입니다. 인도에서는 상위 7개 도시의 등급 A 오피스 시장이 2026년까지 약 10억 평방 피트로 확대되고 2030년까지 12억 평방 피트로 확대될 것으로 예상됩니다.
주택 수요 증가 및 개수 투자가 주택 부문 건설을 뒷받침할 가능성이 높습니다.
2022년 세계 주택 부문은 인구 증가, 부유층 증가, 급속한 도시화 등의 요인으로 기존 바닥 면적이 1.35% 증가했습니다. 특히 주택건설 부문은 주로 주택수 증가로 2023년에는 약 282억 평방피트의 바닥면적이 급증했습니다. 특히 미국에서는 2023년까지 2억 4,119만 호의 주택이 건설된 것으로 평가되었습니다.
2018년부터 2021년 사이에 세계 주택 부문의 바닥 면적은 수량 기준으로 약 4.05% 확대되었습니다. 2020년에 주택 부문은 세계 건설 업계의 44%를 차지했으며, 가장 큰 하위 부문으로서의 지위를 굳히고 세계 성장의 중요한 원동력이 되었습니다. 2021년 세계의 주택 바닥 면적은 약 276억 평방 피트 증가하여 미국에서만 133만 호의 주택이 완성되어 전년 대비 4% 증가했습니다.
향후 세계 주택 부문의 바닥 면적은 수량 기준으로 1.50%의 연평균 복합 성장률(CAGR)을 나타낼 것으로 예측됩니다. 이 성장은 지속적인 주택 수요, 투자 증가, 정부 지원 정책에 의해 촉진될 것입니다. 합리적인 가격의 주택을 중시함으로써 세계 주택 건설 부문은 활기를 회복하고 회복에 도움이 될 것입니다. 예를 들어 인도에서는 2030년까지 2,500만 호의 합리적인 가격의 주택이 필요할 것으로 예상됩니다. 또한 유럽에서는 2030년까지 주택 개수에 약 25억 유로를 투자할 계획이 있습니다.
건설 보수 및 개수용 화학제품 산업의 개요
건설 보수 및 개수용 화학제품 시장은 적당히 통합되어 상위 5개사에서 51.58%를 차지하고 있습니다. 이 시장 주요 기업은 다음과 같습니다. MAPEI SpA, MBCC Group, RPM International Inc., Saint-Gobain 및 Sika AG(알파벳순 정렬).
기타 혜택
엑셀 형식 시장 예측(ME) 시트
3개월의 애널리스트 서포트
목차
제1장 주요 요약 및 주요 조사 결과
제2장 보고서 제안
제3장 서문
조사 전제조건 및 시장 정의
조사 범위
조사 방법
제4장 주요 산업 동향
최종 용도 분야의 동향
상업
산업 및 시설
주택
규제 프레임워크
밸류체인 및 유통채널 분석
제5장 시장 세분화
최종 용도 분야별
상업
산업 및 시설
인프라
주택
서브 제품별
섬유 포장 시스템
주입 그라우트재
마이크로 콘크리트 모르타르
개질 모르타르
철근 보호재
지역별
아시아태평양
국가별
호주
중국
인도
인도네시아
일본
말레이시아
한국
태국
베트남
기타 아시아태평양
유럽
국가별
프랑스
독일
이탈리아
러시아
스페인
영국
기타 유럽
중동 및 아프리카
국가별
사우디아라비아
아랍에미리트(UAE)
기타 중동 및 아프리카
북미
국가별
캐나다
멕시코
미국
남미
국가별
아르헨티나
브라질
기타 남미
제6장 경쟁 구도
주요 전략 동향
시장 점유율 분석
기업 상황
기업 프로파일
Ardex Group
Fosroc, Inc.
MAPEI SpA
MBCC Group
MC-Bauchemie
Remmers Gruppe AG
RPM International Inc.
Saint-Gobain
Sika AG
Simpson Strong-Tie Company, Inc.
제7장 CEO에 대한 주요 전략적 질문
제8장 부록
세계 개요
개요
Porter's Five Forces 분석 프레임워크(산업 매력도 분석)
세계 밸류체인 분석
시장 역학(DROs)
정보원 및 참고문헌
도표 일람
주요 인사이트
데이터 팩
용어집
AJY
영문 목차
영문목차
The Construction Repair and Rehabilitation Chemicals Market size is estimated at 2.96 billion USD in 2024, and is expected to reach 4.33 billion USD by 2030, growing at a CAGR of 6.56% during the forecast period (2024-2030).
Rising industrial construction is likely to drive the demand for repair and rehabilitation chemicals
The global market for repair and rehabilitation chemicals experienced a 4.72% growth in value in 2022, driven by rising demand from the commercial and industrial and institutional construction sectors. This growth was estimated to continue in 2023, with a projected rate of 4.64% compared to 2022.
In 2022, the industrial and institutional sector emerged as the dominant consumer, accounting for approximately 48.20% of the repair and rehabilitation chemicals market. This sector's floor area was set to expand by 9.02 billion square feet in 2023, primarily fueled by increased investments in industrial, education, and healthcare construction. Consequently, the demand for repair and rehabilitation chemicals in this sector is expected to rise by about 5.25% in 2023.
Looking ahead, the industrial and institutional sector is poised to maintain its growth trajectory, with a projected CAGR of 7% in value from 2023 to 2030. The global existing floor area for this sector is forecasted to reach 360 billion square feet in 2023 and further climb to 429 billion square feet by 2030, driven by heightened industrial construction investments worldwide. Furthermore, several economies such as India, Indonesia, and Vietnam have shown rapid expansion that considerably impacted the need for an industrial property to meet the demands of efficient factories in the countries. As a result, the market for repair and rehabilitation chemicals in this sector is anticipated to surge from USD 1.33 billion in 2023 to USD 2.15 billion in 2030.
Therefore, the market studied is expected to witness substantial growth during the forecast period.
The future of the construction repair and rehabilitation chemicals market is set to be influenced by the GDP growth of Asia-Pacific countries
The global construction repair and rehabilitation chemicals market witnessed a 5% increase in terms of value in 2022, driven by a surge in building and infrastructure renovations. These initiatives aimed to boost economic growth and enhance energy efficiency standards. The global construction repair and rehabilitation chemicals market is projected to record a further 4.6% growth in 2023 by value, with North America and Asia-Pacific leading the way.
Asia-Pacific, led by countries such as China, Japan, and India, dominates the global consumption of repair and rehabilitation chemicals. These three nations alone accounted for 28% of the market's value in 2022. Notably, micro-concrete mortars emerged as a significant contributor to the Asia-Pacific market, following injection grouting materials.
Europe ranks second in terms of repair and rehabilitation chemical consumption, with Germany, France, and the United Kingdom being the primary contributors. In 2022, these three countries represented nearly 47% of Europe's market value. The industrial, institutional, and infrastructure segments are the major consumers of these chemicals in Europe.
Asia-Pacific is projected to witness the highest growth in the construction repair and rehabilitation chemicals market, with a CAGR of 7.12% in terms of value from 2023 to 2030. This growth is likely to be fueled by the region's robust economies, including India, China, Thailand, and Japan. Notably, China and India's GDPs are growing at annual rates of 5.2% and 5.9%, respectively.
Global Construction Repair and Rehabilitation Chemicals Market Trends
Rising commercial construction investment and office spaces are likely to boost the commercial sector
In 2022, the global commercial sector witnessed a 2% increase in its floor area, driven by a surge in demand for properties like offices, hotels, and retail malls. Notably, the Indian retail industry saw a significant uptick, with its top seven cities adding over 2.6 million sq. ft of mall space, marking a 27% jump from 2021. The following year, in 2023, the global commercial sector's floor area surged by approximately 6.8 billion sq. ft, largely propelled by a surge in foreign direct investment (FDI), necessitating new offices, warehouses, and retail outlets worldwide.
Between 2018 and 2021, the global commercial sector's floor area expanded by 6.33% in volume. In 2021, office occupancy witnessed a robust growth of over 80% across nearly 390 metro cities globally. Additionally, from Q3 2021, there was a net absorption of 30 million sq. ft. of office space. Consequently, the global commercial sector's floor area swelled by approximately 6.5 billion sq. ft. in 2021 compared to the previous year.
Projections indicate that the global commercial sector's floor area will register a CAGR of 2.21% in volume during the forecast period. This growth is fueled by heightened demand for commercial construction spending and office spaces. For instance, commercial construction spending in the United States is set to hit USD 646 billion by 2027. In India, the Grade A office market in the top seven cities is expected to expand to nearly 1 billion sq. ft by 2026 and further to 1.2 billion sq. ft by 2030.
Increasing demand for housing units and investments in renovation are likely to boost residential sector constructions
In 2022, the global residential sector witnessed a 1.35% increase in its existing floor area, driven by factors like population growth, rising wealth, and rapid urbanization. The residential construction sector, specifically, saw a surge of around 28.2 billion sq. ft in its floor area in 2023, primarily due to a rise in the number of homes. Notably, the United States was projected to have 241.19 million homes by 2023.
Between 2018 and 2021, the global residential sector's floor area expanded by approximately 4.05% in terms of volume. In 2020, the residential sector accounted for 44% of the global construction industry, solidifying its position as the largest subsector and a key driver of global growth. The global residential floor area grew by about 27.6 billion sq. ft in 2021, with the United States alone completing 1.33 million housing units, marking a 4% increase from the previous year.
Looking ahead, the global residential sector's floor area is projected to witness a CAGR of 1.50% in terms of volume. This growth will be fueled by sustained housing demand, increased investments, and supportive government policies. The emphasis on affordable housing is set to rejuvenate the global residential construction sector, aiding its recovery. For instance, it is estimated that India will require an additional 25 million affordable housing units by 2030 to meet the needs of its expanding urban population. Additionally, Europe has plans to invest approximately EUR 2.5 billion in residential dwelling renovations by 2030.
Construction Repair and Rehabilitation Chemicals Industry Overview
The Construction Repair and Rehabilitation Chemicals Market is moderately consolidated, with the top five companies occupying 51.58%. The major players in this market are MAPEI S.p.A., MBCC Group, RPM International Inc., Saint-Gobain and Sika AG (sorted alphabetically).
Additional Benefits:
The market estimate (ME) sheet in Excel format
3 months of analyst support
TABLE OF CONTENTS
1 EXECUTIVE SUMMARY & KEY FINDINGS
2 REPORT OFFERS
3 INTRODUCTION
3.1 Study Assumptions & Market Definition
3.2 Scope of the Study
3.3 Research Methodology
4 KEY INDUSTRY TRENDS
4.1 End Use Sector Trends
4.1.1 Commercial
4.1.2 Industrial and Institutional
4.1.3 Residential
4.2 Regulatory Framework
4.3 Value Chain & Distribution Channel Analysis
5 MARKET SEGMENTATION (includes market size, forecasts up to 2030 and analysis of growth prospects.)
5.1 End Use Sector
5.1.1 Commercial
5.1.2 Industrial and Institutional
5.1.3 Infrastructure
5.1.4 Residential
5.2 Sub Product
5.2.1 Fiber Wrapping Systems
5.2.2 Injection Grouting Materials
5.2.3 Micro-concrete Mortars
5.2.4 Modified Mortars
5.2.5 Rebar Protectors
5.3 Region
5.3.1 Asia-Pacific
5.3.1.1 By Country
5.3.1.1.1 Australia
5.3.1.1.2 China
5.3.1.1.3 India
5.3.1.1.4 Indonesia
5.3.1.1.5 Japan
5.3.1.1.6 Malaysia
5.3.1.1.7 South Korea
5.3.1.1.8 Thailand
5.3.1.1.9 Vietnam
5.3.1.1.10 Rest of Asia-Pacific
5.3.2 Europe
5.3.2.1 By Country
5.3.2.1.1 France
5.3.2.1.2 Germany
5.3.2.1.3 Italy
5.3.2.1.4 Russia
5.3.2.1.5 Spain
5.3.2.1.6 United Kingdom
5.3.2.1.7 Rest of Europe
5.3.3 Middle East and Africa
5.3.3.1 By Country
5.3.3.1.1 Saudi Arabia
5.3.3.1.2 United Arab Emirates
5.3.3.1.3 Rest of Middle East and Africa
5.3.4 North America
5.3.4.1 By Country
5.3.4.1.1 Canada
5.3.4.1.2 Mexico
5.3.4.1.3 United States
5.3.5 South America
5.3.5.1 By Country
5.3.5.1.1 Argentina
5.3.5.1.2 Brazil
5.3.5.1.3 Rest of South America
6 COMPETITIVE LANDSCAPE
6.1 Key Strategic Moves
6.2 Market Share Analysis
6.3 Company Landscape
6.4 Company Profiles
6.4.1 Ardex Group
6.4.2 Fosroc, Inc.
6.4.3 MAPEI S.p.A.
6.4.4 MBCC Group
6.4.5 MC-Bauchemie
6.4.6 Remmers Gruppe AG
6.4.7 RPM International Inc.
6.4.8 Saint-Gobain
6.4.9 Sika AG
6.4.10 Simpson Strong-Tie Company, Inc.
7 KEY STRATEGIC QUESTIONS FOR CONCRETE, MORTARS AND CONSTRUCTION CHEMICALS CEOS
8 APPENDIX
8.1 Global Overview
8.1.1 Overview
8.1.2 Porter's Five Forces Framework (Industry Attractiveness Analysis)