건설용 화학제품 : 시장 점유율 분석, 산업 동향, 통계, 성장 예측(2025-2030년)
Construction Chemicals - Market Share Analysis, Industry Trends & Statistics, Growth Forecasts (2025 - 2030)
상품코드:1685785
리서치사:Mordor Intelligence
발행일:2025년 03월
페이지 정보:영문
라이선스 & 가격 (부가세 별도)
ㅁ Add-on 가능: 고객의 요청에 따라 일정한 범위 내에서 Customization이 가능합니다. 자세한 사항은 문의해 주시기 바랍니다.
ㅁ 보고서에 따라 최신 정보로 업데이트하여 보내드립니다. 배송기일은 문의해 주시기 바랍니다.
한글목차
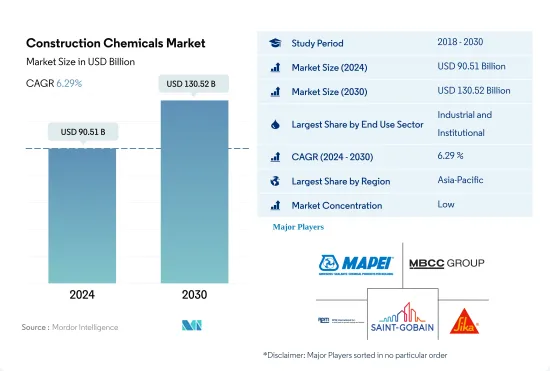
2024년 건설용 화학제품 시장 규모는 905억 1,000만 달러, 2030년에는 1,305억 2,000만 달러에 이를 것으로 예측되며, 예측 기간 중(2024-2030년) CAGR은 6.29%로 성장할 것으로 예상됩니다.
주요 국가의 주택 부문에 대한 정부 투자와 정책은 건설용 화학제품 수요를 촉진할 것으로 예상됩니다.
건설용 화학제품은 시멘트, 콘크리트 및 기타 건축자재와 함께 사용되는 화학 제제를 의미합니다. 2022년 건설용 화학제품의 세계 소비액은 약 4.37%의 성장을 보였으며, 2023년에는 연간 5.57%의 성장률을 기록할 것으로 예상됩니다. 이 급증은 산업 및 시설 부문과 주택 건설 부문에서의 수요 증가에 기인하고 있습니다.
산업 및 시설 섹터는 2022년 건설용 화학제품의 최대 소비자로 부상하여 세계 소비의 약 34.8%를 차지했습니다. 헬스케어, 교육, 산업 인프라에 대한 투자가 이 섹터의 성장을 뒷받침하는 자세입니다. 또한 도시화와 산업화라는 세계의 동향이 시장 확대의 카탈리스트로서 작용하고 있습니다. 이 분야의 신설 바닥 면적은 2023년에 약 90억 평방 피트, 2030년에는 약 110억 평방 피트에 이를 것으로 예상됩니다. 그 결과, 공업 및 시설 섹터의 건설용 화학제품 수요는 2023-2030년간 140억 달러 증가할 것으로 예상됩니다.
주택 부문은 건설용 화학제품의 소비자로서 가장 급성장하며 예측 기간 동안 최고의 CAGR 6.90%를 나타낼 것으로 예상됩니다. 이러한 급증은 지속적인 주택 수요, 투자 증가, 정부 지원 정책에 기인합니다. 예를 들어 인도네시아 정부(GOI)는 2025년까지 100만호의 주택을 건설하는 목표를 내걸고 있으며, 이 나라의 주택 수요는 3,000만호에 달할 것으로 예측되고 있습니다. 세계적으로 보면, 주택 부문의 신설 바닥 면적은 예측 기간 동안 CAGR 3.81%를 나타낼 것으로 예상되며, 건설용 화학제품 수요를 더욱 촉진하고 있습니다.
인도, 브라질, 인도네시아, 베트남 등 아시아태평양의 주요 국가들이 건설용 화학제품의 세계 수요를 끌어올릴 가능성이 높습니다.
콘크리트 혼화제, 방수 솔루션, 앵커 및 그라우트, 바닥용 수지 등을 포함한 건설용 화학제품은 건물과 구조물의 기능성을 높이는 데 매우 중요한 역할을 합니다. 세계 건설용 화학제품 시장은 2022년에 약 4.37%의 성장을 기록했으며, 아시아태평양이 42.8%, 유럽이 25.3%로 가장 높은 성장세를 보였습니다. 2023년 세계의 건설용 화학제품 시장은 2022년 대비 5.57% 성장했습니다.
2023년까지 아시아태평양은 건설용 화학제품의 가장 큰 소비자가 되어 세계 시장의 43.0% 점유율을 차지했습니다. 주택 수요 증가와 산업 및 시설 분야에 대한 투자 증가에 따라, 건설 활동이 계속 증가했습니다. 예를 들어, 산업 및 시설의 바닥 면적은 2023년에는 45억 9,000만 평방 피트, 2030년에는 57억 6,000만 평방 피트까지 더욱 증가할 것으로 예상됩니다. 그 결과 이 지역의 건설용 화학제품 시장은 2030년까지 2023년 대비 62.2%성장할 것으로 예상됩니다.
아시아태평양은 건설용 화학제품의 소비자로 가장 급성장하고 있으며 예측 기간 동안 7.15%라는 최고의 CAGR을 나타낼 것으로 예상됩니다. 이 성장은 이 지역의 주택 부문이 견인할 것으로 예상됩니다. 예를 들어, 2030년까지 인도 인구의 40% 이상이 도시에 거주할 것으로 예상되며, 약 2,500만 호의 저렴한 주택 수요가 창출될 것으로 예상됩니다. 이 지역의 주택 바닥 면적은 크게 증가하고 2023년 대비 2030년까지 42억 3,000만 평방 피트 증가할 것으로 예상됩니다. 그 결과, 이 지역의 건설용 화학제품 시장은 2030년까지 4억 9,600만 달러의 상당한 증가를 보일 것으로 예상됩니다.
세계 건설용 화학제품 시장 동향
아시아태평양의 대규모 오피스 빌딩 건설 프로젝트의 급증으로 세계 상업 건축 전용 바닥 면적이 증가 할 전망
2022년 세계 상업용 건축물의 신설 바닥 면적은 전년 대비 0.15%의 소폭 성장이 되었습니다. 유럽은 2030년 이산화탄소 배출 목표에 맞추어 에너지 효율적인 오피스 빌딩을 추진하는 움직임이 배경에 있습니다. 직원의 사무실 복귀에 따라 유럽 기업은 임대 계약을 재개하고 2022년에는 450만 평방 피트의 신규 오피스 건설에 박차를 가했습니다. 이 기세는 2023년에도 계속되어 세계 성장률은 4.26%로 예측되고 있습니다.
COVID-19의 유행은 노동력과 자재 부족을 일으켜 상업시설 건설 프로젝트의 취소와 지연을 초래했습니다. 그러나 폐쇄가 완화되고 건설활동이 재개됨에 따라 2021년 세계 상업시설의 신설 바닥 면적은 11.11% 급증했고 아시아태평양이 20.98%의 성장률로 선도했습니다.
향후 세계 상업시설의 신설 바닥 면적의 CAGR은 4.56%를 나타낼 것으로 예상됩니다. 아시아태평양의 CAGR은 5.16%로 예측되며 다른 지역을 능가할 것으로 예상됩니다. 이 성장의 원동력이 되고 있는 것은 중국, 인도, 한국, 일본에 있어서의 상업시설 건설 프로젝트의 활성화입니다. 특히 베이징, 상하이, 홍콩, 타이베이 등 중국의 주요 도시에서는 A급 사무실 공간 건설이 가속화되고 있습니다. 또한 인도에서는 2023년부터 2025년에 걸쳐 상위 7개 도시에서 약 2,325만 평방 피트에 이르는 약 60개의 쇼핑몰이 오픈할 예정입니다. 아시아태평양 전역의 이러한 노력을 합산하면 2030년까지 상업시설의 신규 바닥면적은 2022년 대비 15억 6,000만 평방피트 증가할 것으로 예상됩니다.
세계 주택 부문을 뒷받침하는 저렴한 주택 계획에 대한 정부 투자 증가로 남미 주택 건설이 가장 빠르게 성장할 것으로 추정됩니다.
2022년 세계 주택건축의 신규 바닥면적은 2021년 대비 약 2억 8,900만 평방피트 감소했습니다. 이는 토지 부족, 노동력 부족, 건축자재 가격의 지속 불가능한 급등으로 인한 주택 위기 때문입니다. 이 위기는 아시아태평양에 심각한 영향을 미쳤으며, 2022년 신설지면적은 2021년 대비 5.39% 감소했습니다. 그러나 2023년에는 2030년까지 30억 명을 수용할 수 있는 저렴한 주택을 새로 건설하기 위한 자금을 조달할 수 있는 정부 투자로 세계 신설 바닥 면적은 2022년 대비 3.31% 증가할 것으로 예측되어 보다 밝은 전망이 기대됩니다.
COVID-19의 유행은 경기 감속을 일으켜, 그 때문에 많은 주택 건설 프로젝트가 중지 또는 연기되어 2020년 세계의 신설 바닥 면적은 2019년에 비해 4.79% 감소했습니다. 2021년에 규제가 해제되어 주택 프로젝트에 대한 우울한 수요가 해소되면서 신설 바닥 면적은 2020년 대비 11.22% 증가했으며, 유럽이 18.28%로 가장 높은 성장세를 보였고, 남미가 2020년 대비 17.36% 증가했습니다.
세계의 주택용 신설 바닥 면적은 예측 기간 동안 CAGR 3.81%의 연평균 성장률을 기록할 것으로 예상되며 남미가 가장 빠른 CAGR 4.05%의 연평균 성장률을 기록할 것으로 예상됩니다. 브라질의 Minha Casa Minha Vida는 2023년에 발표되었으며, 정부는 저소득 가구에 저렴한 주택을 제공하기 위해 19억 8,000만 달러의 투자를 계획하고 있으며, 칠레의 FOGAES도 2023년에 발표되었으며 초기 투자액은 5,000만 달러였습니다.
건설용 화학제품 산업 개요
건설용 화학 제품 시장은 세분화되어 상위 5개사에서 27.13%를 차지하고 있습니다. 이 시장 주요 기업은 다음과 같습니다. MAPEI SpA, MBCC Group, RPM International Inc., Saint-Gobain and Sika AG(sorted alphabetically).
기타 혜택
엑셀 형식 시장 예측(ME) 시트
3개월간의 애널리스트 서포트
목차
제1장 주요 요약과 주요 조사 결과
제2장 보고서 제안
제3장 소개
조사의 전제조건과 시장 정의
조사 범위
조사 방법
제4장 주요 산업 동향
최종 용도 분야의 동향
상업
산업 및 시설
인프라
주택
주요 인프라 프로젝트(현재 및 발표됨)
규제 프레임워크
밸류체인과 유통채널 분석
제5장 시장 세분화
최종 용도 분야
상업
산업 및 시설
인프라
주택
제품
접착제
서브 제품별
핫멜트
반응성
용제계
수성
앵커와 그라우트
서브 제품별
시멘트계 고정재
수지 고정
기타 유형
콘크리트 혼화제
서브 제품별
촉진제
공기혼입혼화제
고범위 감수제(초가소제)
지연제
수축 저감 혼화제
점도 조정제
감수제(가소제)
기타 유형
콘크리트 보호 페인트
서브 제품별
아크릴계
알키드
에폭시
폴리우레탄
기타 수지
바닥용 수지
서브 제품별
아크릴
에폭시
폴리아스파라긴
폴리우레탄
기타 수지 유형
보수 및 재생케미컬
서브 제품별
섬유 포장 시스템
주입 그라우트재
마이크로 콘크리트 모르타르
개질 모르타르
철근보호재
실링재
서브 제품별
아크릴
에폭시
폴리우레탄
실리콘
기타 수지
표면 처리 약품
서브 제품별
경화 컴파운드
이형제
기타 제품 유형
방수 솔루션
서브 제품별
화학제품
멤브레인
지역별
아시아태평양
국가별
호주
중국
인도
인도네시아
일본
말레이시아
한국
태국
베트남
기타 아시아태평양
유럽
국가별
프랑스
독일
이탈리아
러시아
스페인
영국
기타 유럽
중동 및 아프리카
국가별
사우디아라비아
아랍에미리트(UAE)
기타 중동 및 아프리카
북미
국가별
캐나다
멕시코
미국
남미
국가별
아르헨티나
브라질
기타 남미
제6장 경쟁 구도
주요 전략 동향
시장 점유율 분석
기업 상황
기업 프로파일
Ardex Group
Arkema
CEMEX, SAB de CV
Fosroc, Inc.
HB Fuller Company
Henkel AG & Co. KGaA
Jiangsu Subote New Material Co., Ltd.
LATICRETE International, Inc.
MAPEI SpA
MBCC Group
MC-Bauchemie
Oriental Yuhong
RPM International Inc.
Saint-Gobain
Sika AG
제7장 CEO에 대한 주요 전략적 질문
제8장 부록
세계 개요
개요
Five Forces 분석 프레임워크(산업 매력도 분석)
세계의 밸류체인 분석
시장 역학(DROs)
정보원과 참고문헌
도표 일람
주요 인사이트
데이터 팩
용어집
SHW
영문 목차
영문목차
The Construction Chemicals Market size is estimated at 90.51 billion USD in 2024, and is expected to reach 130.52 billion USD by 2030, growing at a CAGR of 6.29% during the forecast period (2024-2030).
Government investments and policies for the housing sector in leading economies are expected to drive the demand for construction chemicals
Construction chemicals refer to chemical formulations used in conjunction with cement, concrete, or other construction materials. In 2022, the global consumption value of construction chemicals witnessed a growth of approximately 4.37%, and it was expected to register an annual growth rate of 5.57% in 2023. This surge can be attributed to the increased demand from the industrial & institutional and residential construction sectors.
The industrial & institutional sector emerged as the largest consumer of construction chemicals in 2022, accounting for about 34.8% of the global consumption. Investments in healthcare, education, and industrial infrastructure are poised to bolster this sector's growth. Additionally, the global trends of urbanization and industrialization are acting as catalysts for the market's expansion. The sector's new floor area was projected to reach around 9 billion sq. ft in 2023, and it is expected to reach an estimated 11 billion sq. ft by 2030. Consequently, the demand for construction chemicals in the industrial & institutional sector is projected to witness a USD 14 billion increase from 2023 to 2030.
The residential sector is expected to be the fastest-growing consumer of construction chemicals, recording the highest CAGR of 6.90% during the forecast period. This surge can be attributed to sustained housing demand, increasing investments, and supportive government policies. For instance, the Government of Indonesia (GOI) has set a target to construct 1 million housing units by 2025, with the country's housing requirements projected to reach 30 million units. Globally, the new floor area in the residential sector is anticipated to witness a CAGR of 3.81% during the forecast period, further fueling the demand for construction chemicals.
Leading countries in Asia-Pacific, such as India, Brazil, Indonesia, and Vietnam, are likely to boost the global demand for construction chemicals
Construction chemicals, including concrete admixtures, waterproofing solutions, anchors & grouts, flooring resins, and others, play a pivotal role in enhancing the functionality of buildings and structures. The global construction chemicals market witnessed a growth of approximately 4.37% in 2022, with Asia-Pacific and Europe having the highest growth of 42.8% and 25.3%, respectively. Construction chemicals globally were estimated to grow by 5.57% in 2023 compared to 2022.
By 2023, Asia-Pacific was the largest consumer of construction chemicals, accounting for a 43.0% share of the global market. Construction activities continued to increase in line with the growing demand for housing units and rising investments in the industrial and institutional sector. For instance, the industrial and institutional floor area was set to reach 4.59 billion square feet in 2023; it is expected to further increase to 5.76 billion square feet by 2030. As a result, the region's construction chemicals market is expected to grow 62.2% by 2030 compared to 2023.
Asia-Pacific is expected to be the fastest-growing consumer of construction chemicals, recording the highest CAGR of 7.15% during the forecast period. This growth is expected to be driven by the region's residential sector. For instance, by 2030, it is anticipated that over 40% of India's population will reside in urban areas, creating a demand for approximately 25 million affordable housing units. The residential floor area in the region is expected to witness a significant surge, adding 4.23 billion sq. ft by 2030 compared to 2023. Consequently, the construction chemicals market in the region is projected to witness a substantial increase of USD 496 million by 2030.
Global Construction Chemicals Market Trends
Asia-Pacific's surge in large-scale office building projects is set to elevate the global floor area dedicated to commercial construction
In 2022, the global new floor area for commercial construction witnessed a modest growth of 0.15% from the previous year. Europe stood out with a significant surge of 12.70%, driven by a push for high-energy-efficient office buildings to align with its 2030 carbon emission targets. As employees returned to offices, European companies, resuming lease decisions, spurred the construction of 4.5 million square feet of new office space in 2022. This momentum is poised to persist in 2023, with a projected global growth rate of 4.26%.
The COVID-19 pandemic caused labor and material shortages, leading to cancellations and delays in commercial construction projects. However, as lockdowns eased and construction activities resumed, the global new floor area for commercial construction surged by 11.11% in 2021, with Asia-Pacific taking the lead with a growth rate of 20.98%.
Looking ahead, the global new floor area for commercial construction is set to achieve a CAGR of 4.56%. Asia-Pacific is anticipated to outpace other regions, with a projected CAGR of 5.16%. This growth is fueled by a flurry of commercial construction projects in China, India, South Korea, and Japan. Notably, major Chinese cities like Beijing, Shanghai, Hong Kong, and Taipei are gearing up for an uptick in Grade A office space construction. Additionally, India is set to witness the opening of approximately 60 shopping malls, spanning 23.25 million square feet, in its top seven cities between 2023 and 2025. Collectively, these endeavors across Asia-Pacific are expected to add a staggering 1.56 billion square feet to the new floor area for commercial construction by 2030, compared to 2022.
South America's estimated fastest growth in residential constructions due to increasing government investments in schemes for affordable housing to boost the global residential sector
In 2022, the global new floor area for residential construction declined by around 289 million square feet compared to 2021. This can be attributed to the housing crisis generated due to the shortage of land, labor, and unsustainably high construction materials prices. This crisis severely impacted Asia-Pacific, where the new floor area declined 5.39% in 2022 compared to 2021. However, a more positive outlook is expected in 2023 as the global new floor area is predicted to grow by 3.31% compared to 2022, owing to government investments that can finance the construction of new affordable homes capable of accommodating 3 billion people by 2030.
The COVID-19 pandemic caused an economic slowdown, due to which many residential construction projects got canceled or delayed, and the global new floor area declined by 4.79% in 2020 compared to 2019. As the restrictions were lifted in 2021 and pent-up demand for housing projects was released, new floor area grew 11.22% compared to 2020, with Europe having the highest growth of 18.28%, followed by South America, which rose 17.36% in 2021 compared to 2020.
The global new floor area for residential construction is expected to register a CAGR of 3.81% during the forecast period, with South America predicted to develop at the fastest CAGR of 4.05%. Schemes and initiatives like the Minha Casa Minha Vida in Brazil announced in 2023 with a few regulatory changes, for which the government plans an investment of USD 1.98 billion to provide affordable housing units for low-income families, and the FOGAES in Chile also publicized in 2023, with an initial investment of USD 50 million, are aimed at providing mortgage loans to families for affordable housing and will encourage the construction of new residential units.
Construction Chemicals Industry Overview
The Construction Chemicals Market is fragmented, with the top five companies occupying 27.13%. The major players in this market are MAPEI S.p.A., MBCC Group, RPM International Inc., Saint-Gobain and Sika AG (sorted alphabetically).
Additional Benefits:
The market estimate (ME) sheet in Excel format
3 months of analyst support
TABLE OF CONTENTS
1 EXECUTIVE SUMMARY & KEY FINDINGS
2 REPORT OFFERS
3 INTRODUCTION
3.1 Study Assumptions & Market Definition
3.2 Scope of the Study
3.3 Research Methodology
4 KEY INDUSTRY TRENDS
4.1 End Use Sector Trends
4.1.1 Commercial
4.1.2 Industrial and Institutional
4.1.3 Infrastructure
4.1.4 Residential
4.2 Major Infrastructure Projects (current And Announced)
4.3 Regulatory Framework
4.4 Value Chain & Distribution Channel Analysis
5 MARKET SEGMENTATION (includes market size, forecasts up to 2030 and analysis of growth prospects.)
5.1 End Use Sector
5.1.1 Commercial
5.1.2 Industrial and Institutional
5.1.3 Infrastructure
5.1.4 Residential
5.2 Product
5.2.1 Adhesives
5.2.1.1 By Sub Product
5.2.1.1.1 Hot Melt
5.2.1.1.2 Reactive
5.2.1.1.3 Solvent-borne
5.2.1.1.4 Water-borne
5.2.2 Anchors and Grouts
5.2.2.1 By Sub Product
5.2.2.1.1 Cementitious Fixing
5.2.2.1.2 Resin Fixing
5.2.2.1.3 Other Types
5.2.3 Concrete Admixtures
5.2.3.1 By Sub Product
5.2.3.1.1 Accelerator
5.2.3.1.2 Air Entraining Admixture
5.2.3.1.3 High Range Water Reducer (Super Plasticizer)
5.2.3.1.4 Retarder
5.2.3.1.5 Shrinkage Reducing Admixture
5.2.3.1.6 Viscosity Modifier
5.2.3.1.7 Water Reducer (Plasticizer)
5.2.3.1.8 Other Types
5.2.4 Concrete Protective Coatings
5.2.4.1 By Sub Product
5.2.4.1.1 Acrylic
5.2.4.1.2 Alkyd
5.2.4.1.3 Epoxy
5.2.4.1.4 Polyurethane
5.2.4.1.5 Other Resin Types
5.2.5 Flooring Resins
5.2.5.1 By Sub Product
5.2.5.1.1 Acrylic
5.2.5.1.2 Epoxy
5.2.5.1.3 Polyaspartic
5.2.5.1.4 Polyurethane
5.2.5.1.5 Other Resin Types
5.2.6 Repair and Rehabilitation Chemicals
5.2.6.1 By Sub Product
5.2.6.1.1 Fiber Wrapping Systems
5.2.6.1.2 Injection Grouting Materials
5.2.6.1.3 Micro-concrete Mortars
5.2.6.1.4 Modified Mortars
5.2.6.1.5 Rebar Protectors
5.2.7 Sealants
5.2.7.1 By Sub Product
5.2.7.1.1 Acrylic
5.2.7.1.2 Epoxy
5.2.7.1.3 Polyurethane
5.2.7.1.4 Silicone
5.2.7.1.5 Other Resin Types
5.2.8 Surface Treatment Chemicals
5.2.8.1 By Sub Product
5.2.8.1.1 Curing Compounds
5.2.8.1.2 Mold Release Agents
5.2.8.1.3 Other Product Types
5.2.9 Waterproofing Solutions
5.2.9.1 By Sub Product
5.2.9.1.1 Chemicals
5.2.9.1.2 Membranes
5.3 Region
5.3.1 Asia-Pacific
5.3.1.1 By Country
5.3.1.1.1 Australia
5.3.1.1.2 China
5.3.1.1.3 India
5.3.1.1.4 Indonesia
5.3.1.1.5 Japan
5.3.1.1.6 Malaysia
5.3.1.1.7 South Korea
5.3.1.1.8 Thailand
5.3.1.1.9 Vietnam
5.3.1.1.10 Rest of Asia-Pacific
5.3.2 Europe
5.3.2.1 By Country
5.3.2.1.1 France
5.3.2.1.2 Germany
5.3.2.1.3 Italy
5.3.2.1.4 Russia
5.3.2.1.5 Spain
5.3.2.1.6 United Kingdom
5.3.2.1.7 Rest of Europe
5.3.3 Middle East and Africa
5.3.3.1 By Country
5.3.3.1.1 Saudi Arabia
5.3.3.1.2 United Arab Emirates
5.3.3.1.3 Rest of Middle East and Africa
5.3.4 North America
5.3.4.1 By Country
5.3.4.1.1 Canada
5.3.4.1.2 Mexico
5.3.4.1.3 United States
5.3.5 South America
5.3.5.1 By Country
5.3.5.1.1 Argentina
5.3.5.1.2 Brazil
5.3.5.1.3 Rest of South America
6 COMPETITIVE LANDSCAPE
6.1 Key Strategic Moves
6.2 Market Share Analysis
6.3 Company Landscape
6.4 Company Profiles
6.4.1 Ardex Group
6.4.2 Arkema
6.4.3 CEMEX, S.A.B. de C.V.
6.4.4 Fosroc, Inc.
6.4.5 H.B. Fuller Company
6.4.6 Henkel AG & Co. KGaA
6.4.7 Jiangsu Subote New Material Co., Ltd.
6.4.8 LATICRETE International, Inc.
6.4.9 MAPEI S.p.A.
6.4.10 MBCC Group
6.4.11 MC-Bauchemie
6.4.12 Oriental Yuhong
6.4.13 RPM International Inc.
6.4.14 Saint-Gobain
6.4.15 Sika AG
7 KEY STRATEGIC QUESTIONS FOR CONCRETE, MORTARS AND CONSTRUCTION CHEMICALS CEOS
8 APPENDIX
8.1 Global Overview
8.1.1 Overview
8.1.2 Porter's Five Forces Framework (Industry Attractiveness Analysis)