


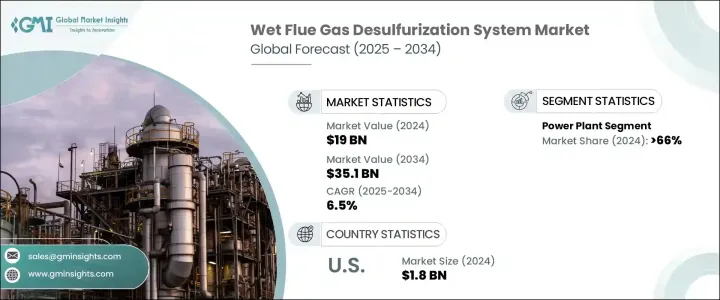
세계의 습식 배연 탈황 장치 시장은 2024년 190억 달러로 평가되었고, 전 세계적으로 청정 에너지원에 대한 관심이 높아지고 산업 공정, 특히 발전 분야에서 이산화황 배출을 줄이기 위한 환경 규제가 강화됨에 따라 연평균 6.5%씩 성장하여 2034년에는 351억 달러에 달할 것으로 예상됩니다.
습식 배연 탈황 장치의 도입은 산업계가 이러한 규정을 준수하고 환경에 미치는 영향을 줄이는 데 필수적입니다.
기술의 발전으로 습식 배연 탈황 장치의 효율성과 비용 효율성이 크게 향상되었습니다. 배출 기준을 충족시키기 위해 습식 배연 탈황 장치를 사용자 정의 할 수 있다는 것이 습식 배연 탈황 장치의 보급에 더욱 기여합니다. 습식 배연 탈황 장치는 배출 제어를 위한 유연한 옵션이 되어 있습니다. 산업계는 회수된 이산화황을 폐기물로 처리하는 대신 드라이월, 시멘트, 농산물에 사용되는 수익을 낳는 재료로 변환할 수 있게 되었습니다.
| 시장 범위 | |
|---|---|
| 시작 연도 | 2024년 |
| 예측 연도 | 2025-2034년 |
| 시작 금액 | 190억 달러 |
| 예측 금액 | 351억 달러 |
| CAGR | 6.5% |
발전 분야는 여전히 가장 큰 용도 부문이며, 2024년에는 전체의 66%를 차지했습니다. 아시아태평양, 특히 중국과 인도에서는 급속한 산업화가 진행되고 있으며, 그에 따라 대기 오염이 심각화되어 배출 가스의 효과적인 제어 기술에 대한 수요가 높아지고 있습니다.
2024년 미국의 습식 배연 탈황 장치 시장 규모는 18억 달러에 달했고 발전소로부터의 SO2 배출을 제한하는 수은·대기 유해물질 기준(MATS)이나 주를 가로지르는 대기 오염 규칙(CSAPR) 등의 엄격한 규제 조치에 힘쓰고 있습니다.
습식 배연 탈황 장치 시장 주요 기업으로는 CECO Environmental, KC Cottrell India, Hitachi Zosen Inova AG, Marsulex Environmental Technologies, Verantis Environmental Solutions Group, KCH Services, Inc. Mitsubishi Heavy Industries Ltd. Valmet Corporation, GMC Enterprises, Inc. Ducon Infratechnologies Ltd. Nederman Holding AB, General Electric, SA HAMON, Tri-Mer Corporation, Thermax Limited 등이 있습니다. 이러한 기업들은 시장의 진화하는 수요에 대응하기 위해 제품 라인업 확대와 장치 효율 향상에 주력하고 있습니다. 전략적 파트너십, 혁신, 지속가능성에 대한 헌신은 시장에서의 존재감과 경쟁력을 강화하기 위해 채택된 주요 전략입니다.
The Global Wet Flue Gas Desulfurization System Market was valued at USD 19 billion in 2024 and is estimated to grow at a CAGR of 6.5% to reach USD 35.1 billion by 2034 driven by the increasing global emphasis on cleaner energy sources and stricter environmental regulations aimed at reducing sulfur dioxide (SO?) emissions from industrial processes, particularly in power generation. Adopting WFGD systems is essential for industries to comply with these regulations and mitigate their environmental impact.

Technological advancements have significantly improved the efficiency and cost-effectiveness of WFGD systems. Innovations in absorbent materials and system designs have enhanced SO? removal capabilities, making these systems more accessible to industries. The ability to customize WFGD systems to meet specific emission standards further contributes to their widespread adoption. The ability to customize WFGD systems to meet specific emission standards further contributes to their widespread adoption. Industries are increasingly favoring solutions tailored to align with regional regulatory frameworks, making WFGD systems a flexible choice for emission control. This adaptability ensures compliance with current and future environmental policies, essential as governments continue tightening pollution standards. Additionally, the production of by-products like synthetic gypsum, which can be utilized in construction materials, adds economic value to these systems. Instead of treating sulfur dioxide capture as waste, industries can now convert it into a revenue-generating material used in drywall, cement, and agricultural products.
| Market Scope | |
|---|---|
| Start Year | 2024 |
| Forecast Year | 2025-2034 |
| Start Value | $19 Billion |
| Forecast Value | $35.1 Billion |
| CAGR | 6.5% |
The power generation sector remains the largest application segment, accounting for 66% share in 2024, attributed to the high SO? emissions associated with coal-fired power plants and the stringent regulations governing these emissions. The Asia Pacific region, particularly China and India, is experiencing rapid industrialization, increasing pollution levels, and a heightened demand for effective emission control technologies.
United States Wet Flue Gas Desulfurization System Market was valued at USD 1.8 billion in 2024, fueled by stringent regulatory measures, such as the Mercury and Air Toxics Standards (MATS) and the Cross-State Air Pollution Rule (CSAPR), which limit SO? emissions from power plants. Compliance with these regulations necessitates the implementation of advanced emission control technologies, including WFGD systems.
Key players in the Wet Flue Gas Desulfurization System Market include CECO Environmental, KC Cottrell India, Hitachi Zosen Inova AG, Marsulex Environmental Technologies, Verantis Environmental Solutions Group, KCH Services, Inc., Mitsubishi Heavy Industries Ltd., Valmet Corporation, GEA Group Aktiengesellschaft, Babcock & Wilcox Enterprises, Inc., Ducon Infratechnologies Ltd., Nederman Holding AB, General Electric, S.A. HAMON, Tri-Mer Corporation, and Thermax Limited. These companies are focusing on expanding their product offerings and enhancing system efficiencies to meet the evolving demands of the market. Strategic partnerships, technological innovations, and a commitment to sustainability are key strategies employed to strengthen their market presence and competitiveness.