


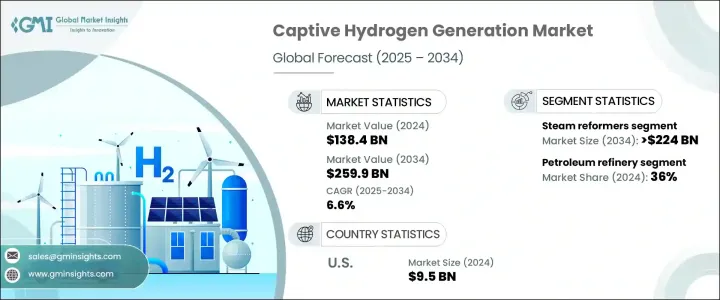
세계의 캡티브 수소 생성 시장 규모는 2024년에 1,384억 달러로 평가되었고, CAGR 6.6%로 성장할 전망이며, 2034년에는 2,599억 달러에 달할 것으로 예측됩니다.
지속 가능한 에너지 관행으로의 전환과 탈탄소화의 추진이 현장 수소 제조 솔루션의 채용을 산업계에 촉구하고 있습니다. 이 동향은 보다 깨끗하고 효율적인 대체 연료에 대한 수요가 높아지고 있는 정제, 화학, 운송 등의 주요 분야에서 특히 두드러집니다. 세계 산업계가 온실가스 배출 감소를 목표로 하는 가운데 캡티브 수소 시스템의 역할은 더욱 중요해지고 있습니다. 청정 수소 제조 기술의 진보는 확장성을 높이고 운영 비용을 낮추며 시스템 전체의 효율을 높임으로써 이 기세에 기여하고 있으며, 온사이트 발전은 산업 사용자에게 점점 더 매력적인 선택지가 되고 있습니다.
특히 고순도 연료를 필요로 하는 공정에서 사용되는 수소 수요가 꾸준히 증가하고 있기 때문에 시장은 콤팩트한 모듈식 시스템에 대한 대규모 투자로부터 혜택을 받을 것으로 예측됩니다. 이러한 시스템은 설치의 유연성을 제공하고 다양한 생산 능력에 맞출 수 있기 때문에 외부 수소 공급 업체에 대한 의존도를 줄이고 싶은 중규모 시설에 특히 매력적입니다. 기술의 진화와 더불어 정부의 지원 정책도 성장을 가속화하고 있습니다. 세제 혜택, 보조금, 카본 프라이싱 메커니즘 등의 인센티브는 선행 투자 비용을 상쇄함으로써 산업계 기업이 보다 깨끗한 연료 솔루션으로 이행하는 것을 지원하고 있습니다. 캡티브 수소 생성은 또한 신뢰성 높은 지역 밀착형 연료 생산이 장기적인 에너지 목표에 부합하는 보다 광범위한 넷제로 에미션 과제에서도 전략적인 역할을 하고 있습니다. 이러한 요인들이 맞물려 세계 시장 전체가 강력한 성장을 이룰 수 있는 기반이 마련되고 있습니다.
| 시장 범위 | |
|---|---|
| 시작 연도 | 2024년 |
| 예측 연도 | 2025-2034년 |
| 시작 금액 | 1,384억 달러 |
| 예측 금액 | 2,599억 달러 |
| CAGR | 6.6% |
시장은 공정별로 수증기 개질, 전기분해, 그 밖의 기술로 분류됩니다. 이 중 수증기 개질은 압도적인 지위를 차지하고 있어 2034년까지 2,240억 달러 이상을 창출할 것으로 예측되고 있습니다. 이 과정은 천연가스와 같은 탄화수소 원료를 효율적이고 대규모로 수소로 변환할 수 있기 때문에 널리 지지받고 있습니다. 높은 수율의 수소 생성에 대한 산업계의 기호는 수증기 개질용의 확립된 인프라가 이용 가능한 것과 맞물려 이 부문의 매력을 계속 강화하고 있습니다. 더불어 수증기 개질 장치는 정제 등의 산업에서 기존 에너지 시스템과의 적합성이 높기 때문에 널리 채택되고 예측 기간을 통해 지속적인 수요가 확보됩니다.
용도별로 시장 세분화는 석유 정제, 화학 처리, 금속 및 기타 산업 영역으로 구분됩니다. 2024년에는 석유정제소가 36%의 점유율로 시장을 선도하였고, 2034년까지 CAGR 6.3%로 성장할 것으로 예측되고 있습니다. 이 성장의 원동력은 수소화 분해와 탈황 등의 작업을 지원하기 위해 신뢰성이 높고 비용 효율적인 수소 공급이 필요하다는 점입니다. 정유소에서는 물류 비용을 절감하고 에너지 신뢰성을 높이기 위해 온사이트 수소 솔루션에 대한 관심이 높아지고 있습니다. 연료의 자가 발전으로의 이행은, 배출 삭감 목표를 따르면서, 공급의 두절과 관련된 리스크를 경감하는 데 도움이 됩니다. 자가 발전은 비용과 규제 준수를 관리하면서 생산 연속성을 유지하는 것을 목표로 하는 정유소에 있어서 전략적 우위성을 제공합니다.
지역별로는 미국이 세계 시장에 대한 강력한 공헌국으로 부상하고 있으며, 그 평가액은 2022년에 90억 달러, 2023년에 92억 달러, 2024년에 95억 달러로 평가되었습니다. 북미는 2024년 세계 시장 점유율의 약 9%를 차지했으며, 청정 에너지 채택이 가속화됨에 따라 이 비율은 증가할 것으로 예상됩니다. 미국 시장은, 에너지 비용의 삭감 및 업무 효율의 향상을 요구하는 복수의 부문에 걸치는 수요 증가의 혜택을 받고 있습니다. 이에 따라 국내 기업은, 다양한 최종 용도 전용의 온디맨드로 수소를 제조할 수 있는 고도의 시스템을 개발하고 있습니다. 발전기 설계에 있어서 혁신은, 보다 컴팩트하고 확장 가능한 솔루션을 가능하게 해, 상업 및 산업 환경에의 폭넓은 전개를 재촉하고 있습니다. 동시에 수소 제조 및 저장 인프라에 대한 설비 투자 확대가 이 지역의 장기적인 산업 성장의 길을 열어주고 있습니다.
캡티브 수소 생성 분야의 주요 기업은 지속가능성, 효율성, 진화하는 산업 요건에 대한 적응성에 중점을 두고 있습니다. 이들 기업은 혁신적인 기술을 개발하고 세계적인 발자취를 강화하기 위해 자원을 투입하고 있습니다. 이러한 기업은, 선진적인 시스템의 개시, 신흥 지역에의 진출, 깨끗한 수소 솔루션의 전개 가속을 목표로 한 파트너십 형성 등, 새로운 비즈니스 찬스를 적극적으로 추구하고 있습니다. 온사이트 발전의 수요가 높아질 것으로 예상되는 가운데, 업계의 리더들은, 장래의 시장 개척으로부터 이익을 얻기 위한 전략적 입장에 있습니다.
The Global Captive Hydrogen Generation Market was valued at USD 138.4 billion in 2024 and is estimated to grow at a CAGR of 6.6% to reach USD 259.9 billion by 2034. The transition toward sustainable energy practices and the increasing push for decarbonization are encouraging industries to adopt on-site hydrogen production solutions. This trend is especially prominent across key sectors like refining, chemicals, and transportation, where the demand for cleaner, more efficient fuel alternatives is gaining traction. As global industries aim to reduce greenhouse gas emissions, the role of captive hydrogen systems has become more pivotal. Advancements in clean hydrogen production technology are contributing to this momentum by enhancing scalability, lowering operational costs, and boosting overall system efficiency, making on-site generation an increasingly attractive option for industrial users.

With demand for hydrogen steadily rising, particularly for use in processes that require high-purity fuel, the market is expected to benefit from significant investments in compact and modular systems. These systems offer installation flexibility and can be tailored to varying production capacities, which is particularly appealing for medium-sized facilities seeking to reduce reliance on external hydrogen suppliers. In addition to technological evolution, supportive government policies are amplifying growth. Incentives like tax breaks, grants, and carbon pricing mechanisms are helping industrial players transition toward cleaner fuel solutions by offsetting upfront capital costs. Captive hydrogen generation is also playing a strategic role in broader net-zero emissions agendas, where reliable and localized fuel production aligns with long-term energy goals. Collectively, these factors are laying the groundwork for robust growth across global markets.
| Market Scope | |
|---|---|
| Start Year | 2024 |
| Forecast Year | 2025-2034 |
| Start Value | $138.4 Billion |
| Forecast Value | $259.9 Billion |
| CAGR | 6.6% |
The market is categorized by process into steam reforming, electrolysis, and other technologies. Among these, steam reformers hold a dominant position and are anticipated to generate over USD 224 billion by 2034. This process is widely favored due to its ability to convert hydrocarbon feedstocks such as natural gas into hydrogen efficiently and at scale. The ongoing industrial preference for high-yield hydrogen generation, combined with the availability of established infrastructure for steam reforming, continues to strengthen the segment's appeal. Additionally, the compatibility of steam reformers with existing energy systems in industries like refining further contributes to its widespread adoption, ensuring sustained demand throughout the forecast period.
In terms of application, the captive hydrogen generation market is segmented into petroleum refineries, chemical processing, metals, and other industrial domains. Petroleum refineries led the market in 2024 with a 36% share and are forecast to grow at a CAGR exceeding 6.3% through 2034. This growth is driven by the need for a dependable and cost-efficient hydrogen supply to support operations like hydrocracking and desulfurization. Refineries are increasingly turning to on-site hydrogen solutions to cut logistics costs and enhance energy reliability. The transition toward in-house fuel generation helps mitigate risks associated with supply disruptions while aligning with emissions reduction targets. Captive generation offers a strategic edge for refiners aiming to maintain production continuity while managing expenses and regulatory compliance.
Regionally, the United States is emerging as a strong contributor to the global market, with valuations of USD 9 billion in 2022, USD 9.2 billion in 2023, and USD 9.5 billion in 2024. North America accounted for approximately 9% of the global market share in 2024, and this proportion is expected to increase as clean energy adoption accelerates. The U.S. market is benefiting from increased demand across multiple sectors seeking to reduce energy costs and improve operational efficiency. In response, domestic firms are developing advanced systems capable of producing hydrogen on demand for various end-use applications. Innovations in generator design are enabling more compact and scalable solutions, encouraging broader deployment in commercial and industrial settings. At the same time, growing capital investment in hydrogen production and storage infrastructure is paving the way for long-term industry growth in the region.
Leading companies in the captive hydrogen generation space are focused on sustainability, efficiency, and adaptability to meet evolving industrial requirements. These firms are dedicating resources to develop innovative technologies and strengthen their global footprint. They are actively pursuing new business opportunities by launching advanced systems, expanding into emerging regions, and forming partnerships aimed at accelerating the deployment of clean hydrogen solutions. With demand for on-site generation expected to rise, industry leaders are strategically positioned to benefit from future market developments.