탄소 중립 시장(-2035년) : 활동 유형별, 구성요소 유형별, 대상 산업별, 기업 유형별, 지역별, 산업 동향, 예측
Carbon Neutrality Market, Till 2035: Distribution by Type of Activity, Type of Component, Industries Served, Type of Enterprise, and Geographical Regions: Industry Trends and Global Forecasts
상품코드:1830270
리서치사:Roots Analysis
발행일:On Demand Report
페이지 정보:영문 174 Pages
라이선스 & 가격 (부가세 별도)
한글목차
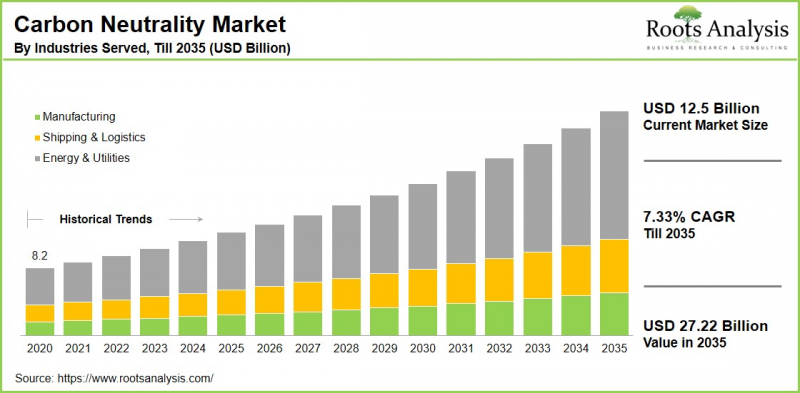
세계 탄소 중립 시장 규모는 현재 125억 달러에서 2035년까지 272억 2,000만 달러에 달할 것으로 예상되며, 2035년까지 예측 기간 동안 7.33%의 연평균 성장률을 보일 것으로 예상됩니다.
탄소 중립 시장 : 성장과 동향
탄소 중립이란 대기 중으로 배출되는 이산화탄소의 양과 배출되는 이산화탄소의 양이 일치하는 상태를 말하며, 탄소발자국 감축을 위한 전략으로 탄소 배출이 순 제로가 되는 것을 말합니다. 중요한 것은 탄소 중립 실현이 가져다주는 혜택은 기후변화로 인한 악영향에 대응하는 것뿐만 아니라 환경오염 감소, 공중보건 향상, 녹색 일자리 창출을 통한 경제성장, 식량안보 향상, 생물다양성 보호에도 기여한다는 점입니다.
세계 탄소 중립 시장은 중국, 인도 등 개발도상국의 수요 증가로 인해 예측 기간 동안 안정적인 성장세를 보일 것으로 예상됩니다. 또한, 탄소 포집 및 저장(CCS)과 직접 공기 회수를 포함한 탄소 중립 제품의 발전과 혁신이 이러한 노력을 주도하고 있으며, 산업계가 배출량을 줄일 수 있도록 돕고 있습니다. 마이크로소프트와 같은 기업들은 탄소 중립을 위한 노력에 많은 투자를 하고 있으며, 이러한 기술의 발전을 가속화하여 탄소 중립을 달성하는 기업의 지속가능성 목표를 향해 나아가고 있습니다.
위의 요인으로 인해 탄소 중립 시장은 예측 기간 동안 크게 성장할 것으로 예상됩니다.
세계의 탄소 중립 시장에 대해 조사했으며, 시장 규모 추정과 기회 분석, 경쟁 상황, 기업 프로파일 등의 정보를 전해드립니다.
목차
섹션 1 보고서 개요
제1장 서문
제2장 조사 방법
제3장 시장 역학
제4장 거시경제 지표
섹션 2 정성적 인사이트
제5장 주요 요약
제6장 소개
제7장 규제 시나리오
섹션 3 시장 개요
제8장 주요 기업의 종합적인 데이터베이스
제9장 경쟁 구도
제10장 화이트 스페이스 분석
제11장 기업 경쟁력 분석
제12장 탄소 중립 시장의 스타트업 생태계
섹션 4 기업 개요
제13장 기업 개요
분석 개요
Carbon Footprint
Climate Impact
ClimeCo
EcoAct
ENGIE
ESG Enterprise
Green Mountain Energy
SAP
Schneider Electric
Terrapass
섹션 5 시장 동향
제14장 메가트렌드 분석
제15장 미충족 수요 분석
제16장 특허 분석
제17장 최근 발전
섹션 6 시장 기회 분석
제18장 세계의 탄소 중립 시장
제19장 시장 기회 : 활동 유형별
제20장 시장 기회 : 구성요소 유형별
제21장 시장 기회 : 대상 산업별
제22장 시장 기회 : 기업 유형별
제23장 북미의 탄소 중립 시장 기회
제24장 유럽의 탄소 중립 시장 기회
제25장 아시아의 탄소 중립 시장 기회
제26장 중동 및 북아프리카(MENA)의 탄소 중립 시장 기회
제27장 라틴아메리카의 탄소 중립 시장 기회
제28장 기타 지역의 탄소 중립 시장 기회
제29장 시장 집중 분석 : 주요 기업별
제30장 인접 시장 분석
섹션 7 전략적 툴
제31장 중요한 승리 전략
제32장 Porter's Five Forces 분석
제33장 SWOT 분석
제34장 밸류체인 분석
제35장 Roots의 전략적 제안
섹션 8 기타 독점적 인사이트
제36장 1차 조사로부터의 인사이트
제37장 보고서 결론
섹션 9 부록
KSM
영문 목차
영문목차
Carbon Neutrality Market Overview
As per Roots Analysis, the global carbon neutrality market size is estimated to grow from USD 12.5 billion in the current year USD 27.22 billion by 2035, at a CAGR of 7.33% during the forecast period, till 2035.
The opportunity for carbon neutrality market has been distributed across the following segments:
Type of Activity
Emissions Reduction
Renewable Energy Use
Type of Component
Services
Solutions
Industries Served
Manufacturing
Shipping & Logistics
Energy & Utilities
Type of Enterprise
Large Enterprise
Small and Medium Enterprise
Geographical Regions
North America
US
Canada
Mexico
Other North American countries
Europe
Austria
Belgium
Denmark
France
Germany
Ireland
Italy
Netherlands
Norway
Russia
Spain
Sweden
Switzerland
UK
Other European countries
Asia
China
India
Japan
Singapore
South Korea
Other Asian countries
Latin America
Brazil
Chile
Colombia
Venezuela
Other Latin American countries
Middle East and North Africa
Egypt
Iran
Iraq
Israel
Kuwait
Saudi Arabia
UAE
Other MENA countries
Rest of the World
Australia
New Zealand
Other countries
Carbon Neutrality Market: Growth and Trends
Carbon neutrality refers to a condition in which the quantity of carbon dioxide released into the atmosphere matches the amount that is taken out, resulting in a net-zero carbon emissions level through strategies aimed at reducing carbon footprints. Importantly, the benefits of achieving carbon neutrality not only address the negative impacts of climate change but also contribute to decreased environmental pollution, enhanced public health, economic growth through the creation of green jobs, improved food security, and the protection of biodiversity.
The market for carbon neutrality worldwide is projected to experience steady growth during the forecast period, driven by increasing demand in developing nations such as China and India. Further, advancements and innovations in carbon neutrality products, including carbon capture and storage (CCS) as well as direct air capture, are leading this initiative, allowing industries to lower their emissions. Significantly, companies like Microsoft are making considerable investments in carbon neutrality initiatives to speed up the advancement of these technologies, illustrating a trend toward corporate sustainability objectives in attaining carbon neutrality.
Owing to the above mentioned factors, the carbon neutrality market is expected to grow significantly during the forecast period.
Carbon Neutrality Market: Key Segments
Market Share by Type of Activity
Based on type of activity, the global carbon neutrality market is segmented into emissions reduction and renewable energy use. According to our estimates, currently, the naphthenic segment captures the majority of the market share. This is due to its holistic strategy for tackling greenhouse gas emissions across multiple sectors, especially in industries that are heavy on energy consumption.
On the other hand, the renewable energy use segment is projected to experience a comparatively higher CAGR during the forecast period. This growth can be attributed to the rising global energy needs, and increased concerns about energy security.
Market Share by Type of Component
Based on type of component, the global carbon neutrality market is segmented into services and solutions. According to our estimates, currently, the services segment captures the majority of the market share. This is due to the rising complexity of carbon management and the increasing need for expert assistance among organizations aiming to reach their sustainability objectives.
Market Share by Industries Served
Based on industries served, the global carbon neutrality market is segmented into manufacturing, shipping & logistics and energy & utilities. According to our estimates, currently, the energy & utilities segment captures the majority of the market share. Additionally, this segment is anticipated to experience a faster growth rate during the forecast period. This can be attributed to its critical role in developing strategies aimed at reducing greenhouse gas emissions, as it is among the largest sources of carbon emissions.
Market Share by Type of Enterprise
Based on type of enterprise, the global carbon neutrality market is segmented into large enterprise and small and medium enterprises. According to our estimates, currently, the large enterprise segment captures the majority of the market share. This trend can be attributed to their substantial financial resources, allowing them to invest in cutting-edge technologies and carbon neutrality programs.
Market Share by Geographical Regions
Based on geographical regions, the carbon neutrality market is segmented into North America, Europe, Asia, Latin America, Middle East and North Africa, and the rest of the world. According to our estimates, currently, North America captures the majority share of the market. Conversely, Asia is expected to experience a notably higher compound annual growth rate (CAGR) during the forecast period. The primary drivers of this swift growth include strong government commitments from China, Japan, and South Korea to attain net-zero emissions.
Example Players in Carbon Neutrality Market
Carbon Footprint
Climate Impact
ClimeCo
EcoAct
ENGIE
ESG Enterprise
Green Mountain Energy
SAP
Schneider Electric
Terrapass
Carbon Neutrality Market: Research Coverage
The report on the carbon neutrality market features insights on various sections, including:
Market Sizing and Opportunity Analysis: An in-depth analysis of the carbon neutrality market, focusing on key market segments, including [A] type of activity, [B] type of component, [C] industries served, [D] type of enterprise, and [E] geographical regions.
Competitive Landscape: A comprehensive analysis of the companies engaged in the carbon neutrality market, based on several relevant parameters, such as [A] year of establishment, [B] company size, [C] location of headquarters and [D] ownership structure.
Company Profiles: Elaborate profiles of prominent players engaged in the carbon neutrality market, providing details on [A] location of headquarters, [B] company size, [C] company mission, [D] company footprint, [E] management team, [F] contact details, [G] financial information, [H] operating business segments, [I] carbon neutrality portfolio, [J] moat analysis, [K] recent developments, and an informed future outlook.
Megatrends: An evaluation of ongoing megatrends in the carbon neutrality industry.
Patent Analysis: An insightful analysis of patents filed / granted in the carbon neutrality domain, based on relevant parameters, including [A] type of patent, [B]patent publication year, [C] patent age and [D] leading players.
Recent Developments: An overview of the recent developments made in the carbon neutrality market, along with analysis based on relevant parameters, including [A] year of initiative, [B] type of initiative, [C] geographical distribution and [D] most active players.
Porter's Five Forces Analysis: An analysis of five competitive forces prevailing in the carbon neutrality market, including threats of new entrants, bargaining power of buyers, bargaining power of suppliers, threats of substitute products and rivalry among existing competitors.
SWOT Analysis: An insightful SWOT framework, highlighting the strengths, weaknesses, opportunities and threats in the domain. Additionally, it provides Harvey ball analysis, highlighting the relative impact of each SWOT parameter.
Value Chain Analysis: A comprehensive analysis of the value chain, providing information on the different phases and stakeholders involved in the carbon neutrality market.
Key Questions Answered in this Report
How many companies are currently engaged in carbon neutrality market?
Which are the leading companies in this market?
What factors are likely to influence the evolution of this market?
What is the current and future market size?
What is the CAGR of this market?
How is the current and future market opportunity likely to be distributed across key market segments?
Reasons to Buy this Report
The report provides a comprehensive market analysis, offering detailed revenue projections of the overall market and its specific sub-segments. This information is valuable to both established market leaders and emerging entrants.
Stakeholders can leverage the report to gain a deeper understanding of the competitive dynamics within the market. By analyzing the competitive landscape, businesses can make informed decisions to optimize their market positioning and develop effective go-to-market strategies.
The report offers stakeholders a comprehensive overview of the market, including key drivers, barriers, opportunities, and challenges. This information empowers stakeholders to stay abreast of market trends and make data-driven decisions to capitalize on growth prospects.
Additional Benefits
Complimentary Excel Data Packs for all Analytical Modules in the Report
15% Free Content Customization
Detailed Report Walkthrough Session with Research Team
Free Updated report if the report is 6-12 months old or older
TABLE OF CONTENTS
SECTION I: REPORT OVERVIEW
1. PREFACE
1.1. Introduction
1.2. Market Share Insights
1.3. Key Market Insights
1.4. Report Coverage
1.5. Key Questions Answered
1.6. Chapter Outlines
2. RESEARCH METHODOLOGY
2.1. Chapter Overview
2.2. Research Assumptions
2.3. Database Building
2.3.1. Data Collection
2.3.2. Data Validation
2.3.3. Data Analysis
2.4. Project Methodology
2.4.1. Secondary Research
2.4.1.1. Annual Reports
2.4.1.2. Academic Research Papers
2.4.1.3. Company Websites
2.4.1.4. Investor Presentations
2.4.1.5. Regulatory Filings
2.4.1.6. White Papers
2.4.1.7. Industry Publications
2.4.1.8. Conferences and Seminars
2.4.1.9. Government Portals
2.4.1.10. Media and Press Releases
2.4.1.11. Newsletters
2.4.1.12. Industry Databases
2.4.1.13. Roots Proprietary Databases
2.4.1.14. Paid Databases and Sources
2.4.1.15. Social Media Portals
2.4.1.16. Other Secondary Sources
2.4.2. Primary Research
2.4.2.1. Introduction
2.4.2.2. Types
2.4.2.2.1. Qualitative
2.4.2.2.2. Quantitative
2.4.2.3. Advantages
2.4.2.4. Techniques
2.4.2.4.1. Interviews
2.4.2.4.2. Surveys
2.4.2.4.3. Focus Groups
2.4.2.4.4. Observational Research
2.4.2.4.5. Social Media Interactions
2.4.2.5. Stakeholders
2.4.2.5.1. Company Executives (CXOs)
2.4.2.5.2. Board of Directors
2.4.2.5.3. Company Presidents and Vice Presidents
2.4.2.5.4. Key Opinion Leaders
2.4.2.5.5. Research and Development Heads
2.4.2.5.6. Technical Experts
2.4.2.5.7. Subject Matter Experts
2.4.2.5.8. Scientists
2.4.2.5.9. Doctors and Other Healthcare Providers
2.4.2.6. Ethics and Integrity
2.4.2.6.1. Research Ethics
2.4.2.6.2. Data Integrity
2.4.3. Analytical Tools and Databases
3. MARKET DYNAMICS
3.1. Forecast Methodology
3.1.1. Top-Down Approach
3.1.2. Bottom-Up Approach
3.1.3. Hybrid Approach
3.2. Market Assessment Framework
3.2.1. Total Addressable Market (TAM)
3.2.2. Serviceable Addressable Market (SAM)
3.2.3. Serviceable Obtainable Market (SOM)
3.2.4. Currently Acquired Market (CAM)
3.3. Forecasting Tools and Techniques
3.3.1. Qualitative Forecasting
3.3.2. Correlation
3.3.3. Regression
3.3.4. Time Series Analysis
3.3.5. Extrapolation
3.3.6. Convergence
3.3.7. Forecast Error Analysis
3.3.8. Data Visualization
3.3.9. Scenario Planning
3.3.10. Sensitivity Analysis
3.4. Key Considerations
3.4.1. Demographics
3.4.2. Market Access
3.4.3. Reimbursement Scenarios
3.4.4. Industry Consolidation
3.5. Robust Quality Control
3.6. Key Market Segmentations
3.7. Limitations
4. MACRO-ECONOMIC INDICATORS
4.1. Chapter Overview
4.2. Market Dynamics
4.2.1. Time Period
4.2.1.1. Historical Trends
4.2.1.2. Current and Forecasted Estimates
4.2.2. Currency Coverage
4.2.2.1. Overview of Major Currencies Affecting the Market
4.2.2.2. Impact of Currency Fluctuations on the Industry
4.2.3. Foreign Exchange Impact
4.2.3.1. Evaluation of Foreign Exchange Rates and Their Impact on Market
4.2.3.2. Strategies for Mitigating Foreign Exchange Risk
4.2.4. Recession
4.2.4.1. Historical Analysis of Past Recessions and Lessons Learnt
4.2.4.2. Assessment of Current Economic Conditions and Potential Impact on the Market
4.2.5. Inflation
4.2.5.1. Measurement and Analysis of Inflationary Pressures in the Economy
4.2.5.2. Potential Impact of Inflation on the Market Evolution
4.2.6. Interest Rates
4.2.6.1. Overview of Interest Rates and Their Impact on the Market
4.2.6.2. Strategies for Managing Interest Rate Risk
4.2.7. Commodity Flow Analysis
4.2.7.1. Type of Commodity
4.2.7.2. Origins and Destinations
4.2.7.3. Values and Weights
4.2.7.4. Modes of Transportation
4.2.8. Global Trade Dynamics
4.2.8.1. Import Scenario
4.2.8.2. Export Scenario
4.2.9. War Impact Analysis
4.2.9.1. Russian-Ukraine War
4.2.9.2. Israel-Hamas War
4.2.10. COVID Impact / Related Factors
4.2.10.1. Global Economic Impact
4.2.10.2. Industry-specific Impact
4.2.10.3. Government Response and Stimulus Measures
4.2.10.4. Future Outlook and Adaptation Strategies
4.2.11. Other Indicators
4.2.11.1. Fiscal Policy
4.2.11.2. Consumer Spending
4.2.11.3. Gross Domestic Product (GDP)
4.2.11.4. Employment
4.2.11.5. Taxes
4.2.11.6. R&D Innovation
4.2.11.7. Stock Market Performance
4.2.11.8. Supply Chain
4.2.11.9. Cross-Border Dynamics
SECTION II: QUALITATIVE INSIGHTS
5. EXECUTIVE SUMMARY
6. INTRODUCTION
6.1. Chapter Overview
6.2. Overview of Carbon Neutrality Market
6.2.1. Type of Component
6.2.2. Type of Industries Served
6.2.3. Type of Enterprise
6.3. Future Perspective
7. REGULATORY SCENARIO
SECTION III: MARKET OVERVIEW
8. COMPREHENSIVE DATABASE OF LEADING PLAYERS
9. COMPETITIVE LANDSCAPE
9.1. Chapter Overview
9.2. Carbon Neutrality: Overall Market Landscape
9.2.1. Analysis by Year of Establishment
9.2.2. Analysis by Company Size
9.2.3. Analysis by Location of Headquarters
9.2.4. Analysis by Ownership Structure
10. WHITE SPACE ANALYSIS
11. COMPANY COMPETITIVENESS ANALYSIS
12. STARTUP ECOSYSTEM IN THE CARBON NEUTRALITY MARKET
12.1. Carbon Neutrality Market: Market Landscape of Startups
12.1.1. Analysis by Year of Establishment
12.1.2. Analysis by Company Size
12.1.3. Analysis by Company Size and Year of Establishment
12.1.4. Analysis by Location of Headquarters
12.1.5. Analysis by Company Size and Location of Headquarters
12.1.6. Analysis by Ownership Structure
12.2. Key Findings
SECTION IV: COMPANY PROFILES
13. COMPANY PROFILES
13.1. Chapter Overview
13.2. Carbon Footprint*
13.2.1. Company Overview
13.2.2. Company Mission
13.2.3. Company Footprint
13.2.4. Management Team
13.2.5. Contact Details
13.2.6. Financial Performance
13.2.7. Operating Business Segments
13.2.8. Service / Product Portfolio (project specific)
13.2.9. MOAT Analysis
13.2.10. Recent Developments and Future Outlook
13.3. Climate Impact
13.4. ClimeCo
13.5. EcoAct
13.6. ENGIE
13.7. ESG Enterprise
13.8. Green Mountain Energy
13.9. SAP
13.10. Schneider Electric
13.11. Terrapass
SECTION V: MARKET TRENDS
14. MEGA TRENDS ANALYSIS
15. UNMET NEED ANALYSIS
16. PATENT ANALYSIS
17. RECENT DEVELOPMENTS
17.1. Chapter Overview
17.2. Recent Funding
17.3. Recent Partnerships
17.4. Other Recent Initiatives
SECTION VI: MARKET OPPORTUNITY ANALYSIS
18. GLOBAL CARBON NEUTRALITY MARKET
18.1. Chapter Overview
18.2. Key Assumptions and Methodology
18.3. Trends Disruption Impacting Market
18.4. Demand Side Trends
18.5. Supply Side Trends
18.6. Global Carbon Neutrality Market, Historical Trends (Since 2020) and Forecasted Estimates (Till 2035)
18.7. Multivariate Scenario Analysis
18.7.1. Conservative Scenario
18.7.2. Optimistic Scenario
18.8. Investment Feasibility Index
18.9. Key Market Segmentations
19. MARKET OPPORTUNITIES BASED ON TYPE OF ACTIVITY
19.1. Chapter Overview
19.2. Key Assumptions and Methodology
19.3. Revenue Shift Analysis
19.4. Market Movement Analysis
19.5. Penetration-Growth (P-G) Matrix
19.6. Carbon Neutrality Market for Emissions Reduction: Historical Trends (Since 2020) and Forecasted Estimates (Till 2035)
19.7. Carbon Neutrality Market for Renewable Energy Use: Historical Trends (Since 2020) and Forecasted Estimates (Till 2035)
19.8. Data Triangulation and Validation
19.8.1. Secondary Sources
19.8.2. Primary Sources
19.8.3. Statistical Modeling
20. MARKET OPPORTUNITIES BASED ON TYPE OF COMPONENT
20.1. Chapter Overview
20.2. Key Assumptions and Methodology
20.3. Revenue Shift Analysis
20.4. Market Movement Analysis
20.5. Penetration-Growth (P-G) Matrix
20.6. Carbon Neutrality Market for Services: Historical Trends (Since 2020) and Forecasted Estimates (Till 2035)
20.7. Carbon Neutrality Market for Solutions: Historical Trends (Since 2020) and Forecasted Estimates (Till 2035)
20.8. Data Triangulation and Validation
20.8.1. Secondary Sources
20.8.2. Primary Sources
20.8.3. Statistical Modeling
21. MARKET OPPORTUNITIES BASED ON INDUSTRIES SERVED
21.1. Chapter Overview
21.2. Key Assumptions and Methodology
21.3. Revenue Shift Analysis
21.4. Market Movement Analysis
21.5. Penetration-Growth (P-G) Matrix
21.6. Carbon Neutrality Market for Manufacturing: Historical Trends (Since 2020) and Forecasted Estimates (Till 2035)
21.7. Carbon Neutrality Market for Shipping & Logistics: Historical Trends (Since 2020) and Forecasted Estimates (Till 2035)
21.8. Carbon Neutrality Market for Energy & Utilities: Historical Trends (Since 2020) and Forecasted Estimates (Till 2035)
21.9. Data Triangulation and Validation
21.9.1. Secondary Sources
21.9.2. Primary Sources
21.9.3. Statistical Modeling
22. MARKET OPPORTUNITIES BASED ON TYPE OF ENTERPRISE
22.1. Chapter Overview
22.2. Key Assumptions and Methodology
22.3. Revenue Shift Analysis
22.4. Market Movement Analysis
22.5. Penetration-Growth (P-G) Matrix
22.6. Carbon Neutrality Market for Large Enterprise: Historical Trends (Since 2020) and Forecasted Estimates (Till 2035)
22.7. Carbon Neutrality Market for Small and Medium Enterprise: Historical Trends (Since 2020) and Forecasted Estimates (Till 2035)
22.8. Data Triangulation and Validation
22.8.1. Secondary Sources
22.8.2. Primary Sources
22.8.3. Statistical Modeling
23. MARKET OPPORTUNITIES FOR CARBON NEUTRALITY IN NORTH AMERICA
23.1. Chapter Overview
23.2. Key Assumptions and Methodology
23.3. Revenue Shift Analysis
23.4. Market Movement Analysis
23.5. Penetration-Growth (P-G) Matrix
23.6. Carbon Neutrality Market in North America: Historical Trends (Since 2020) and Forecasted Estimates (Till 2035)
23.6.1. Carbon Neutrality Market in the US: Historical Trends (Since 2020) and Forecasted Estimates (Till 2035)
23.6.2. Carbon Neutrality Market in Canada: Historical Trends (Since 2020) and Forecasted Estimates (Till 2035)
23.6.3. Carbon Neutrality Market in Mexico: Historical Trends (Since 2020) and Forecasted Estimates (Till 2035)
23.6.4. Carbon Neutrality Market in Other North American Countries: Historical Trends (Since 2020) and Forecasted Estimates (Till 2035)
23.7. Data Triangulation and Validation
24. MARKET OPPORTUNITIES FOR CARBON NEUTRALITY IN EUROPE
24.1. Chapter Overview
24.2. Key Assumptions and Methodology
24.3. Revenue Shift Analysis
24.4. Market Movement Analysis
24.5. Penetration-Growth (P-G) Matrix
24.6. Carbon Neutrality Market in Europe: Historical Trends (Since 2020) and Forecasted Estimates (Till 2035)
24.6.1. Carbon Neutrality Market in Austria: Historical Trends (Since 2020) and Forecasted Estimates (Till 2035)
24.6.2. Carbon Neutrality Market in Belgium: Historical Trends (Since 2020) and Forecasted Estimates (Till 2035)
24.6.3. Carbon Neutrality Market in Denmark: Historical Trends (Since 2020) and Forecasted Estimates (Till 2035)
24.6.4. Carbon Neutrality Market in France: Historical Trends (Since 2020) and Forecasted Estimates (Till 2035)
24.6.5. Carbon Neutrality Market in Germany: Historical Trends (Since 2020) and Forecasted Estimates (Till 2035)
24.6.6. Carbon Neutrality Market in Ireland: Historical Trends (Since 2020) and Forecasted Estimates (Till 2035)
24.6.7. Carbon Neutrality Market in Italy: Historical Trends (Since 2020) and Forecasted Estimates (Till 2035)
24.6.8. Carbon Neutrality Market in Netherlands: Historical Trends (Since 2020) and Forecasted Estimates (Till 2035)
24.6.9. Carbon Neutrality Market in Norway: Historical Trends (Since 2020) and Forecasted Estimates (Till 2035)
24.6.10. Carbon Neutrality Market in Russia: Historical Trends (Since 2020) and Forecasted Estimates (Till 2035)
24.6.11. Carbon Neutrality Market in Spain: Historical Trends (Since 2020) and Forecasted Estimates (Till 2035)
24.6.12. Carbon Neutrality Market in Sweden: Historical Trends (Since 2020) and Forecasted Estimates (Till 2035)
24.6.13. Carbon Neutrality Market in Switzerland: Historical Trends (Since 2020) and Forecasted Estimates (Till 2035)
24.6.14. Carbon Neutrality Market in the UK: Historical Trends (Since 2020) and Forecasted Estimates (Till 2035)
24.6.15. Carbon Neutrality Market in Other European Countries: Historical Trends (Since 2020) and Forecasted Estimates (Till 2035)
24.7. Data Triangulation and Validation
25. MARKET OPPORTUNITIES FOR CARBON NEUTRALITY IN ASIA
25.1. Chapter Overview
25.2. Key Assumptions and Methodology
25.3. Revenue Shift Analysis
25.4. Market Movement Analysis
25.5. Penetration-Growth (P-G) Matrix
25.6. Carbon Neutrality Market in Asia: Historical Trends (Since 2020) and Forecasted Estimates (Till 2035)
25.6.1. Carbon Neutrality Market in China: Historical Trends (Since 2020) and Forecasted Estimates (Till 2035)
25.6.2. Carbon Neutrality Market in India: Historical Trends (Since 2020) and Forecasted Estimates (Till 2035)
25.6.3. Carbon Neutrality Market in Japan: Historical Trends (Since 2020) and Forecasted Estimates (Till 2035)
25.6.4. Carbon Neutrality Market in Singapore: Historical Trends (Since 2020) and Forecasted Estimates (Till 2035)
25.6.5. Carbon Neutrality Market in South Korea: Historical Trends (Since 2020) and Forecasted Estimates (Till 2035)
25.6.6. Carbon Neutrality Market in Other Asian Countries: Historical Trends (Since 2020) and Forecasted Estimates (Till 2035)
25.7. Data Triangulation and Validation
26. MARKET OPPORTUNITIES FOR CARBON NEUTRALITY IN MIDDLE EAST AND NORTH AFRICA (MENA)
26.1. Chapter Overview
26.2. Key Assumptions and Methodology
26.3. Revenue Shift Analysis
26.4. Market Movement Analysis
26.5. Penetration-Growth (P-G) Matrix
26.6. Carbon Neutrality Market in Middle East and North Africa (MENA): Historical Trends (Since 2020) and Forecasted Estimates (Till 2035)
26.6.1. Carbon Neutrality Market in Egypt: Historical Trends (Since 2020) and Forecasted Estimates (Till 205)
26.6.2. Carbon Neutrality Market in Iran: Historical Trends (Since 2020) and Forecasted Estimates (Till 2035)
26.6.3. Carbon Neutrality Market in Iraq: Historical Trends (Since 2020) and Forecasted Estimates (Till 2035)
26.6.4. Carbon Neutrality Market in Israel: Historical Trends (Since 2020) and Forecasted Estimates (Till 2035)
26.6.5. Carbon Neutrality Market in Kuwait: Historical Trends (Since 2020) and Forecasted Estimates (Till 2035)
26.6.6. Carbon Neutrality Market in Saudi Arabia: Historical Trends (Since 2020) and Forecasted Estimates (Till 2035)
26.6.7. Carbon Neutrality Market in United Arab Emirates (UAE): Historical Trends (Since 2020) and Forecasted Estimates (Till 2035)
26.6.8. Carbon Neutrality Market in Other MENA Countries: Historical Trends (Since 2020) and Forecasted Estimates (Till 2035)
26.7. Data Triangulation and Validation
27. MARKET OPPORTUNITIES FOR CARBON NEUTRALITY IN LATIN AMERICA
27.1. Chapter Overview
27.2. Key Assumptions and Methodology
27.3. Revenue Shift Analysis
27.4. Market Movement Analysis
27.5. Penetration-Growth (P-G) Matrix
27.6. Carbon Neutrality Market in Latin America: Historical Trends (Since 2020) and Forecasted Estimates (Till 2035)
27.6.1. Carbon Neutrality Market in Argentina: Historical Trends (Since 2020) and Forecasted Estimates (Till 2035)
27.6.2. Carbon Neutrality Market in Brazil: Historical Trends (Since 2020) and Forecasted Estimates (Till 2035)
27.6.3. Carbon Neutrality Market in Chile: Historical Trends (Since 2020) and Forecasted Estimates (Till 2035)
27.6.4. Carbon Neutrality Market in Colombia Historical Trends (Since 2020) and Forecasted Estimates (Till 2035)
27.6.5. Carbon Neutrality Market in Venezuela: Historical Trends (Since 2020) and Forecasted Estimates (Till 2035)
27.6.6. Carbon Neutrality Market in Other Latin American Countries: Historical Trends (Since 2020) and Forecasted Estimates (Till 2035)
27.7. Data Triangulation and Validation
28. MARKET OPPORTUNITIES FOR CARBON NEUTRALITY IN REST OF THE WORLD
28.1. Chapter Overview
28.2. Key Assumptions and Methodology
28.3. Revenue Shift Analysis
28.4. Market Movement Analysis
28.5. Penetration-Growth (P-G) Matrix
28.6. Carbon Neutrality Market in Rest of the World: Historical Trends (Since 2020) and Forecasted Estimates (Till 2035)
28.6.1. Carbon Neutrality Market in Australia: Historical Trends (Since 2020) and Forecasted Estimates (Till 2035)
28.6.2. Carbon Neutrality Market in New Zealand: Historical Trends (Since 2020) and Forecasted Estimates (Till 2035)
28.6.3. Carbon Neutrality Market in Other Countries
28.7. Data Triangulation and Validation
29. MARKET CONCENTRATION ANALYSIS: DISTRIBUTION BY LEADING PLAYERS