디지털 바이오마커 시장 : 제품 유형별, 솔루션 목적별, 바이오마커 유형별, 치료 분야별, 비즈니스 모델별, 주요 지역별 - 업계 동향과 세계 예측(- 2035년)
Digital Biomarkers Market by Type of Product, Purpose of Solution, Type of Biomarker, Therapeutic Area, Business Model and Key Geographical Regions : Industry Trends and Global Forecasts, Till 2035
상품코드:1682708
리서치사:Roots Analysis
발행일:2025년 03월
페이지 정보:영문 369 Pages
라이선스 & 가격 (부가세 별도)
한글목차
세계 디지털 바이오마커 시장 규모는 2035년까지 예측 기간 동안 18.48%의 연평균 복합 성장률(CAGR)로 확대되어 현재 56억 달러에서 2035년까지 358억 달러로 성장할 것으로 예상됩니다.
디지털 바이오마커 솔루션은 센서나 웨어러블과 같은 하드웨어와 소프트웨어 기능을 결합하여 인체 내 특정 바이오마커를 모니터링하고 이를 분석하여 표적 적응증에 대한 중요한 통찰력을 얻을 수 있도록 하는 솔루션입니다. 현대 헬스케어에서 디지털 바이오마커는 임상적으로 관련된 건강 매개변수를 지속적으로 모니터링하고 평가할 수 있게 함으로써 진단과 치료의 정확성을 높이는 데 도움을 주고 있습니다. 유엔이 발표한 보고서에 따르면, 65세 이상 인구는 2050년까지 두 배인 15억 명에 육박할 것으로 예측되고 있습니다. 만성 질환의 유병률 증가와 고령화로 인해 전체 의료 비용은 향후 몇 년동안 크게 증가 할 가능성이 높습니다. 연구에 따르면 조기 개입을 통한 지속적인 증상 추적은 환자의 삶의 질 향상과 의료 관리 부담 감소 등 다양한 이점을 제공하는 것으로 나타났습니다.
또한, 가상 및 분산형 임상 연구 증가로 인해 환자가 직접 대면하지 않고도 정확하고 신뢰할 수 있는 실시간 건강 정보를 제공할 수 있는 디지털 바이오마커의 채택이 가속화되고 있습니다. 이러한 추세는 임상 연구에 더 많은 환자의 참여를 촉진하고, 보다 환자 중심적인 접근 방식을 제공하며, 보다 다양하고 정교한 바이오마커 데이터 세트를 제공합니다. 원격 환자 모니터링 솔루션(특히 만성 질환의 경우)의 채택이 증가하고 개인 맞춤형 치료의 선호도가 높아짐에 따라 디지털 바이오마커 시장은 당분간 큰 폭으로 성장할 것으로 예상됩니다.
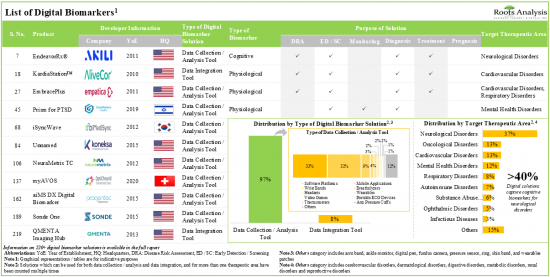
현재 220개 이상의 디지털 바이오마커 솔루션이 전 세계 다양한 업체에서 출시/개발 중이며, 이들 솔루션의 대부분은 데이터 수집/분석 도구(특히 소프트웨어 플랫폼과 손목밴드)입니다.
디지털 솔루션의 40% 이상이 다양한 생리적 바이오마커(맥박, 심장박동, 체온 등)와 관련된 데이터를 수집/분석하고 있으며, 대부분 성인과 노인의 실시간 모니터링에 사용되고 있습니다. 다양한 자원을 보유한 여러 기업들(신생 기업부터 전통 기업까지)이 이 분야에 적극적으로 참여하고 있으며, 이들 기업의 대부분은 북미에 기반을 두고 있습니다. 산업계뿐만 아니라 비산업계 기업들도 이 분야에서 전략적 제휴를 맺고 있으며, 대륙 간 및 대륙 내 제휴의 대부분은 북미에 기반을 둔 기업들에 의해 이루어지고 있습니다.
지난 3년간 디지털 바이오마커 분야에서 진행 중인 혁신과 임상 결과를 논의하기 위해 50회 이상의 행사(오프라인 및 온라인)가 개최되었으며, 약 55명의 저명한 이해관계자들이 이 행사에 참여하였습니다. 디지털 바이오마커와 관련된 750건 이상의 특허가 다양한 이해관계자들에게 출원/출원되어 이 영역에서 생성된 지적 재산을 보호하고 있습니다. 디지털 바이오마커 시장은 2035년까지 연평균 18.5%(CAGR)로 성장할 것으로 예측되며, 예측된 기회는 다양한 유형의 제품, 솔루션 목적, 바이오마커 유형에 따라 분산될 가능성이 높습니다.
세계의 디지털 바이오마커(Digital Biomarker) 시장에 대해 조사했으며, 시장 개요와 함께 제품 유형별/솔루션 목적별/바이오마커 유형별/치료 분야별/비즈니스 모델별/주요 지역별 동향, 시장 진출 기업 프로파일 등의 정보를 정리하여 전해드립니다.
목차
제1장 서문
제2장 조사 방법
제3장 경제 및 기타 프로젝트 특유의 고려사항
제4장 주요 요약
제5장 서론
제6장 시장 구도
제7장 제품 경쟁력 분석
제8장 기업 개요 : 디지털 바이오마커 솔루션 개발 기업
제9장 파트너십 및 협업
제10장 자금조달과 투자
제11장 세계 이벤트 분석
제12장 특허 분석
제13장 대형 제약회사의 이니셔티브
제14장 시장에 대한 영향 분석 : 성장 촉진요인 및 억제요인, 기회, 과제
제15장 세계의 디지털 바이오마커 솔루션 시장
제16장 디지털 바이오마커 솔루션 시장, 제품 유형별
제17장 디지털 바이오마커 솔루션 시장, 솔루션 목적별
제18장 디지털 바이오마커 솔루션 시장, 바이오마커 유형별
제19장 디지털 바이오마커 솔루션 시장, 치료 분야별
제20장 디지털 바이오마커 솔루션 시장, 비즈니스 모델별
제21장 디지털 바이오마커 솔루션 시장, 주요 지역별
제22장 결론
제23장 주요 인사이트
제24장 부록 1 : 표 형식 데이터
제25장 부록 2 : 기업 및 단체 리스트
LSH
영문 목차
영문목차
DIGITAL BIOMARKERS MARKET: OVERVIEW
As per Roots Analysis, the global digital biomarkers market is estimated to grow from USD 5.6 billion in the current year to USD 35.8 billion by 2035, at a CAGR of 18.48% during the forecast period, till 2035.
The market opportunity for cell and gene therapy supply chain software has been distributed across the following segments:
Type of Product
Software / Applications
Wearables
Sensors
Gaming Solutions
Purpose of Solution
Diagnosis
Early Detection
Monitoring
Predictive Insights
Type of Biomarker
Cognitive Biomarkers
Idiosyncratic Biomarkers
Physiological Biomarkers
Vocal Biomarkers
Other Biomarkers
Therapeutic Area
Autoimmune Disorders
Cardiovascular Disorders
Infectious Diseases
Mental Health Disorders
Neurological Disorders
Respiratory Disorders
Substance Abuse Disorders
Others
Business Model
B2B
B2C
Key Geographical Regions
North America
Europe
Asia-Pacific
Middle East and North Africa
Rest of the World
DIGITAL BIOMARKERS MARKET: GROWTH AND TRENDS
Digital biomarker solutions are a combination of hardware and software features, such as sensors, and wearables, that monitor specific biomarkers in the human body that can be analyzed to generate significant insights about target indication(s). In modern healthcare, digital biomarkers help enhance diagnostic and therapeutic precision by enabling continuous monitoring and evaluation of clinically relevant health parameters. As per the report published by the United Nations, the population aged 65 years and above is projected to double reaching close to 1.5 billion in 2050. Owing to the rise in the prevalence of chronic disorders and the aging population, the overall healthcare costs are likely to be increased substantially over the coming years. Studies have shown that continuous symptom tracking with early intervention offers various benefits, such as improvement in the quality of life of patients and reduced medical management burden.
Further, the growing number of virtual and decentralized clinical studies has spurred the adoption of digital biomarkers that provide accurate, reliable and real-time health information without the need for frequent in-person visits by the patients. This trend promotes the participation of a large number of patients in clinical studies, offers a more patient-centric approach, and provides a more diverse and elaborate dataset of biomarkers. Driven by the rising adoption of remote patient monitoring solutions (specifically during chronic indications) and preference for personalized treatments, the digital biomarkers market is likely to grow at a significant pace in the foreseeable future.
DIGITAL BIOMARKERS MARKET: KEY INSIGHTS
The report delves into the current state of the digital biomarkers market and identifies potential growth opportunities within the industry. Some key findings from the report include:
Presently, over 220 digital biomarker solutions are available / being developed by different players across the globe; of these, the majority of the solutions are data collection / analysis tools (specifically software platforms and wrist bands).
Over 40% of digital solutions collect / analyze data related to various physiological biomarkers (such as pulse rate, heart rate and body temperature); most of these are used for real-time monitoring of adults and older adults.
Several firms (encompassing startups as well as well-established companies), with varying resources, have been actively involved in this domain; the majority of these firms are based in North America.
Several industry as well as non-industry players have forged strategic deals in this domain; most of the intercontinental and intracontinental partnerships have been signed by players based in North America.
Foreseeing a lucrative potential within this domain, several firms have invested over USD 3 billion (across over 160 funding instances), since 2015; notably, majority of the funds were raised for developing imaging biomarkers.
In the past three years, over 50 events (offline and online) have been held to discuss the ongoing innovation and clinical outcomes in the digital biomarkers' domain; further, around 55 eminent stakeholders have participated in these events.
Since 2019, over 750 patents related to digital biomarkers have been filed / granted to various stakeholders to protect the intellectual property generated within this domain.
The digital biomarkers market is anticipated to grow at an annualized rate (CAGR) of 18.5%, till 2035; the projected opportunity is likely to be distributed across different types of products, purposes of solutions and types of biomarkers.
DIGITAL BIOMARKERS MARKET: KEY SEGMENTS
Wearables Segment Occupies the Largest Share of the Digital Biomarkers Market
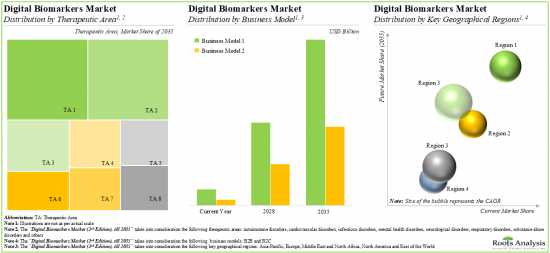
Based on the type of product, the market is segmented into software / applications, wearables, sensors and gaming solutions. At present, the wearables segment holds the maximum share of the digital biomarkers market. This can be attributed to the shifting preference of patients towards virtual consultations and telemedicine, and the growing prevalence of neurodegenerative disorders which in turn, has led to higher adoption of wearable digital biomarker solutions. It is worth highlighting that the digital biomarkers market for sensors is likely to grow at a relatively higher CAGR in the coming decade.
Monitoring Segment is Likely to Dominate the Digital Biomarkers Market During the Forecast Period
Based on the purpose of solution, the market is segmented into diagnosis, early detection, monitoring, and predictive insights. Currently, monitoring segment holds the maximum share of the digital biomarkers market. This can be attributed to the increasing prevalence of chronic disorders, which necessitates continuous tracking of health parameters of patients. It is worth noting that the digital biomarkers market for predictive insights is likely to grow at a relatively higher CAGR in the coming decade.
Physiological Biomarkers Occupy the Largest Share of the Digital Biomarkers Market
Based on the type of biomarker, the market is segmented into cognitive, idiosyncratic, physiological, vocal and other biomarkers. At present, the digital biomarker solutions that capture physiological biomarkers hold the maximum share of the digital biomarkers market. This can be attributed to high clinical validation of such biomarkers, compared to the other types of biomarkers, such as cognitive, idiosyncratic and vocal biomarkers. It is worth highlighting that the digital biomarkers market for vocal digital biomarkers is likely to grow at a relatively higher CAGR in the coming decade.
Neurological Disorders Account for the Largest Share of the Digital Biomarkers Market
Based on the therapeutic areas, the market is segmented into autoimmune disorders, cardiovascular disorders, infectious diseases, mental health disorders, neurological disorders, respiratory disorders, substance abuse disorders and other disorders. While neurological disorders account for a relatively higher market share, it is worth highlighting that the autoimmune disorders and substance abuse disorders segment is expected to witness substantial market growth in the coming years.
B2C Business Model Occupies the Largest Share of the Digital Biomarkers Market
Based on the business model, the market is segmented into B2B and B2C. At present, majority of the revenue is generated through the B2C business model. However, this trend is likely to evolve during the forecasted period, as developers are increasingly adopting B2B business models in order to maintain sustained growth.
North America Accounts for the Largest Share of the Market
Based on key geographical regions, the market is segmented into North America, Europe, Asia-Pacific, Middle East and North Africa, and Rest of the world. The majority share is expected to be captured by players based in North America. It is worth highlighting that, over the years, the market in Asia-Pacific is expected to grow at a higher CAGR.
Example Players in the Digital Biomarkers Market
Acculi Labs
ActiGraph
AliveCor
ATCOR
BACtrack
Biogen
BioSerenity
BioSensics
Eyenuk
Empatica
Feel Therapeutics
icometrix
iMediSync
IXICO
Kinsa
Koneksa Health
Kontigo Care
Progentec Diagnostics
Quibim
Vocalis Health
Primary Research Overview
The opinions and insights presented in this study were influenced by discussions conducted with multiple stakeholders. The research report features detailed transcripts of interviews held with the following industry stakeholders:
Founder and Chief Executive Officer, Small Company, India
Co-founder and Chief Executive Officer, Small Company, France
Business Development Manager, Mid-sized Company, UK
Former Chief Commercial Officer, Small Company, Israel
DIGITAL BIOMARKERS MARKET: RESEARCH COVERAGE
Market Sizing and Opportunity Analysis: The report features an in-depth analysis of the digital biomarkers market, focusing on key market segments, including [A] type of product, [B] purpose of solution, [C] type of biomarker, [D] therapeutic area, [E] business model and [F] key geographical regions.
Market Landscape: A comprehensive evaluation of digital biomarker solutions, considering various parameters, such as [A] type of product, [B] type of digital biomarker solution, [C] type of biomarker, [D] status of development, [E] purpose of biomarker, [F] target therapeutic area, [G] target population, [H] type of end-user, [I] clinical validation of biomarker solution and [J] AI integration within biomarker solution. In addition, the chapter includes a detailed analysis of digital biomarkers developers, along with information on their [K] year of establishment, [L] company size (in terms of employee count), [M] location of headquarters, [N] type of business model and [O] most active players (in terms of number of digital biomarker solutions offered).
Product Competitiveness Analysis: A comprehensive competitive analysis of digital biomarker solutions, examining factors, such as developer strength, product competitiveness and status of development.
Company Profiles: In-depth profiles of key digital biomarkers developers, focusing on [A] company overviews, [B] financial information (if available), [C] digital biomarker portfolio, [D] recent developments and [D] an informed future outlook.
Partnerships and Collaborations: An analysis of partnerships established in this sector based on several parameters, such as [A] year of partnership, [B] type of partnership, [C] type of biomarker, [D] target therapeutic area, [E] type of partner and [F] most active players (in terms of the number of partnerships signed). This section also highlights the regional distribution of partnership activity in this market.
Funding and Investment Analysis: A detailed evaluation of the investments made in this domain based on several parameters, such as [A] year of funding, [B] type of funding, [C] amount invested (USD million), [D] type of biomarker, [E] therapeutic area, [F] most active players (in terms of number of funding instances and amount raised), [G] most active investors (in terms of number of funding instances) and [H] regional distribution of funding.
Global Events Analysis: A detailed analysis of global events attended by the companies in the digital biomarkers industry, based on relevant parameters such as year of event, type of event, event platform, event organizer, location of event, and most active players, speakers and designations (in terms of number of events).
Patent Analysis: Detailed analysis of various patents filed / granted related to digital biomarkers based on [A] type of patent (granted patents, patent applications and others), [B] publication year, [C] application year, [D] patent jurisdiction, [E] cooperative patent classification (CPC) symbols, [F] type of applicant and [G] most active players (in terms of the number of patents filed / granted). It also includes a patent benchmarking analysis and a detailed valuation analysis.
Big Pharma Analysis: A comprehensive examination of various initiatives focused on digital biomarkers undertaken by major pharmaceutical companies. This analysis various initiatives, such as number of clinical trials, number of collaborations, number of conferences attended, number of funding instances, and number of publications.
Market Impact Analysis: The report analyzes various factors such as drivers, restraints, opportunities, and challenges affecting market growth.
KEY QUESTIONS ANSWERED IN THIS REPORT
How many companies are currently engaged in this market?
Which are the leading companies in this market?
What kind of partnership models are commonly adopted by industry stakeholders?
How much investment has been made by industry stakeholders in recent years?
What factors are likely to influence the evolution of this market?
What is the current and future market size?
What is the CAGR of this market?
How is the current and future market opportunity likely to be distributed across key market segments?
REASONS TO BUY THIS REPORT
The report provides a comprehensive market analysis, offering detailed revenue projections of the overall market and its specific sub-segments. This information is valuable to both established market leaders and emerging entrants.
Stakeholders can leverage the report to gain a deeper understanding of the competitive dynamics within the market. By analyzing the competitive landscape, businesses can make informed decisions to optimize their market positioning and develop effective go-to-market strategies.
The report offers stakeholders a comprehensive overview of the market, including key drivers, barriers, opportunities, and challenges. This information empowers stakeholders to stay abreast of market trends and make data-driven decisions to capitalize on growth prospects.
ADDITIONAL BENEFITS
Complimentary PPT Insights Packs
Complimentary Excel Data Packs for all Analytical Modules in the Report
10% Free Content Customization
Detailed Report Walkthrough Session with Research Team
Free Updated report if the report is 6-12 months old or older
TABLE OF CONTENTS
1. PREFACE
1.1. Digital Biomarker Solutions Market
1.2. Market Share Insights
1.3. Key Market Insights
1.4. Report Coverage
1.5. Key Questions Answered
1.6. Chapter Outlines
2. RESEARCH METHODOLOGY
2.1 Chapter Overview
2.2. Research Assumptions
2.3. Project Methodology
2.4. Forecast Methodology
2.5. Robust Quality Control
2.6. Key Market Segmentation
2.7. Key Considerations
2.7.1. Demographics
2.7.2. Economic Factors
2.7.3. Government Regulations
2.7.4. Supply Chain
2.7.5. COVID Impact
2.7.6. Market Access
2.7.7. Healthcare Policies
2.7.8. Industry Consolidation
3.ECONOMIC AND OTHER PROJECT SPECIFIC CONSIDERATIONS
3.1. Chapter Overview
3.2. Market Dynamics
3.2.1. Time Period
3.2.1.1. Historical Trends
3.2.1.2. Current and Future Estimates
3.2.2. Currency Coverage and Foreign Exchange Rate
3.2.2.1. Major Currencies Affecting the Market
3.2.2.2. Factors Affecting Currency Fluctuations and Foreign Exchange Rates
3.2.2.3. Impact of Foreign Exchange Rate Volatility on the Market
3.2.2.4. Strategies for Mitigating Foreign Exchange Risk
3.2.3. Trade Policies
3.2.3.1. Impact of Trade Barriers on the Market
3.2.3.2. Strategies for Mitigating the Risks Associated with Trade Barriers
3.2.4. Recession
3.2.4.1. Historical Analysis of Past Recessions and Lessons Learnt
3.2.4.2. Assessment of Current Economic Conditions and Potential Impact on the Market
3.2.5. Inflation
3.2.5.1. Measurement and Analysis of Inflationary Pressures in the Economy
3.2.5.2. Potential Impact of Inflation on the Market Evolution
4. EXECUTIVE SUMMARY
5. INTRODUCTION
5.1 Chapter Overview
5.2. Overview of Digital Biomarkers
5.2.1. Classification of Digital Biomarkers
5.2.2. Types of Biological Signals Captured by Digital Biomarker Solutions
5.2.3. Key Advantages and Limitations
5.3. Product Development and Commercialization Path for Digital Biomarker Solutions
5.3.1. Discovery
5.3.2. Validations and Submissions
5.3.3. Distribution and Marketing
5.4. Recent Advancements related to Digital Biomarker Solutions
5.5. Impact of COVID-19 Pandemic on the Digital Biomarkers Domain
5.6. Prevalent Trends Related to Digital Biomarker Solutions
5.6.1. Emerging Focus Areas
6. MARKET LANDSCAPE
6.1. Chapter Overview
6.2. Digital Biomarker Solutions: Overall Market Landscape
6.2.1. Analysis by Type of Product
6.2.2. Analysis by Type of Digital Biomarker Solution
6.2.3. Analysis by Type of Biomarker
6.2.4. Analysis by Status of Development
6.2.5. Analysis by Type of Biomarker and Status of Development
6.2.6. Analysis by Purpose of Digital Biomarker Solution
6.2.7. Analysis by Target Therapeutic Area
6.2.8. Analysis by Type of Biomarker and Target Therapeutic Area
6.2.9. Analysis by Target Population
6.2.10. Analysis by End-user
6.2.11. Analysis by Availability of Clinical Validation
6.2.12. Analysis by Availability of Clinical Validates Solutions by Target Therapeutic Area
6.2.13. Analysis by Availability of AI Integration
6.3. Digital Biomarker Solutions: Developer Landscape
6.3.1. Analysis by Year of Establishment
6.3.2. Analysis by Company Size
6.3.3. Analysis by Location of Headquarters
6.3.4. Analysis by Company Size and Location of Headquarters
6.3.5. Most Active Players: Analysis by Number of Digital Biomarker Solutions Developed
7. PRODUCT COMPETITIVENESS ANALYSIS
7.1. Chapter Overview
7.2. Assumptions and Key Parameters
7.3. Methodology
7.4. Digital Biomarker Solutions: Product Competitiveness Analysis
7.4.1. Digital Biomarker Solutions Developed by Players based in North America
7.4.2. Digital Biomarker Solutions Developed by Players based in Europe
7.4.3. Digital Biomarker Solutions Developed by Players based in Asia-Pacific and Rest of the World
8. COMPANY PROFILES: DIGITAL BIOMARKER SOLUTIONS DEVELOPERS
8.1. Chapter Overview
8.2. Detailed Company Profiles of Leading Digital Biomarker Solutions Developers
8.2.1. BioSensics
8.2.1.1. Company Overview
8.2.1.2. Digital Biomarker Solutions Portfolio
8.2.1.3. Recent Developments and Future Outlook
8.2.2. AliveCor
8.2.2.1. Company Overview
8.2.2.2. Digital Biomarker Solutions Portfolio
8.2.2.3. Recent Developments and Future Outlook
8.2.3. BACtrack
8.2.3.1. Company Overview
8.2.3.2. Digital Biomarker Solutions Portfolio
8.2.3.3. Recent Developments and Future Outlook
8.2.4. Eyenuk
8.2.4.1. Company Overview
8.2.4.2. Digital Biomarker Solutions Portfolio
8.2.4.3. Recent Developments and Future Outlook
8.2.5. Quibim
8.2.5.1. Company Overview
8.2.5.2. Digital Biomarker Solutions Portfolio
8.2.5.3. Recent Developments and Future Outlook
8.2.6. Feel Therapeutics
8.2.6.1. Company Overview
8.2.6.2. Digital Biomarker Solutions Portfolio
8.2.6.3. Recent Developments and Future Outlook
8.2.7. Empatica
8.2.7.1. Company Overview
8.2.7.2. Digital Biomarker Solutions Portfolio
8.2.7.3. Recent Developments and Future Outlook
8.2.8. icometrix
8.2.8.1. Company Overview
8.2.8.2. Digital Biomarker Solutions Portfolio
8.2.8.3. Recent Developments and Future Outlook
8.2.9. Biogen
8.2.9.1. Company Overview
8.2.9.2. Digital Biomarker Solutions Portfolio
8.2.9.3. Recent Developments and Future Outlook
8.3. Short Company Profiles of Other Prominent Developers
8.3.1. Acculi Labs
8.3.1.1. Company Overview
8.3.1.2. Product Portfolio: Digital Biomarker Solutions
8.3.2. IXICO
8.3.2.1. Company Overview
8.3.2.2. Product Portfolio: Digital Biomarker Solutions
8.3.3. Kinsa
8.3.3.1. Company Overview
8.3.3.2. Product Portfolio: Digital Biomarker Solutions
8.3.4. Progentec Diagnostics
8.3.4.1. Company Overview
8.3.4.2. Product Portfolio: Digital Biomarker Solutions
8.3.5. Vocalis Health
8.3.5.1. Company Overview
8.3.5.2. Product Portfolio: Digital Biomarker Solutions
8.3.6. Kontigo Care
8.3.6.1. Company Overview
8.3.6.2. Product Portfolio: Digital Biomarker Solutions
8.3.7. Koneksa Health
8.3.7.1. Company Overview
8.3.7.2. Product Portfolio: Digital Biomarker Solutions
8.3.8. ActiGraph
8.3.8.1. Company Overview
8.3.8.2. Product Portfolio: Digital Biomarker Solutions
8.3.9. BioSerenity
8.3.9.1. Company Overview
8.3.9.2. Product Portfolio: Digital Biomarker Solutions
8.3.10. ATCOR
8.3.10.1. Company Overview
8.3.10.2. Product Portfolio: Digital Biomarker Solutions
8.3.11. iMediSync
8.3.11.1. Company Overview
8.3.11.2. Product Portfolio: Digital Biomarker Solutions
9. PARTNERSHIPS AND COLLABORATIONS
9.1. Chapter Overview
9.2. Partnership Models
9.3. Digital Biomarker Solutions: Partnerships and Collaborations
9.3.1. Analysis by Year of Partnership
9.3.2. Analysis by Type of Partnership
9.3.3. Analysis by Year and Type of Partnership
9.3.4. Analysis by Type of Biomarker
9.3.5. Analysis by Type of Partnership and Type of Biomarker
9.3.6. Analysis by Therapeutic Area
9.3.7. Analysis of Type of Partnership and Therapeutic Area
9.3.8. Analysis by Type of Partner
9.3.9. Most Active Players: Analysis by Number of Partnerships
9.3.10. Analysis by Geography
9.3.10.1. Intracontinental and Intercontinental Deals
9.3.10.2. International and Local Deals
10. FUNDING AND INVESTMENTS
10.1. Chapter Overview
10.2. Funding Models
10.3. Digital Biomarker Solutions: Funding and Investments
10.3.1. Analysis by Year of Investment
10.3.2. Analysis by Amount Invested
10.3.3. Analysis of Funding Instances by Type of Funding
10.3.4. Analysis of Amount Invested by Type of Funding
10.3.5. Analysis of Funding Instances by Type of Biomarker
10.3.6. Analysis of Funding Instances and Amount Invested by Therapeutic Area
10.3.7. Leading Investors: Distribution by Number of Funding Instances
10.3.8. Most Active Players: Distribution by Number of Funding Instances
10.3.9. Most Active Players: Analysis by Amount Raised
10.3.10. Most Active Players: Analysis by Geography
11. GLOBAL EVENTS ANALYSIS
11.1. Chapter Overview
11.2. Scope and Methodology
11.3. Digital Biomarker Solutions: Global Events Analysis
11.3.1. Analysis by Year of Event
11.3.2. Analysis by Type of Event
11.3.3. Analysis by Year and Type of Event
11.3.4. Analysis by Event Platform
11.3.5. Analysis by Location of Event
11.3.6. Word Cloud Analysis: Key Focus Areas
11.3.7. Most Active Event Organizers: Analysis by Number of Events
11.3.8. Most Active Players: Analysis by Number of Events
11.4. Global Events: Speaker Analysis
11.4.1. Most Active Speakers: Analysis by Number of Events
11.4.2. Analysis by Designation / Qualification of Speakers
11.5. List of Upcoming Global Events
11.6. Concluding Remarks
12. PATENT ANALYSIS
12.1. Chapter Overview
12.2. Scope and Methodology
12.3. Digital Biomarker Solutions: Patent Analysis
12.3.1. Analysis by Patent Application Year
12.3.2. Analysis by Patent Publication Year
12.3.3. Analysis by Type of Patent and Patent Publication Year
12.3.4. Analysis by Patent Jurisdiction
12.3.5. Analysis by CPC Symbols
12.3.6. Analysis by Patent Publication Year and Type of Applicant
12.3.7. Leading Players: Analysis by Number of Patents
12.3.8. Leading Patent Assignees: Analysis by Number of Patents
12.4. Patent Benchmarking Analysis
12.4.1. Analysis By Patent Characteristics
12.5. Patent Valuation
12.6. Leading Patents by Number of Citations
13. BIG PHARMA INITIATIVES
13.1. Chapter Overview
13.2. Methodology and Key Parameters
13.3. Big Pharma Initiatives Related to Digital Biomarker Solutions
13.3.1. Analysis by Type of Initiatives
13.3.2. Heat Map Analysis
13.4. Big Pharma Players: Benchmark Analysis
13.4.1. Spider Web Analysis: AbbVie
13.4.2. Spider Web Analysis: Amgen
13.4.3. Spider Web Analysis: AstraZeneca
13.4.4. Spider Web Analysis: Bayer
13.4.5. Spider Web Analysis: Bristol Myers Squibb
13.4.6. Spider Web Analysis: Eli Lilly
13.4.7. Spider Web Analysis: GlaxoSmithKline
13.4.8. Spider Web Analysis: Johnson & Johnson
13.4.9. Spider Web Analysis: Merck
13.4.10. Spider Web Analysis: Novartis
13.4.11. Spider Web Analysis: Pfizer
13.4.12. Spider Web Analysis: Roche
13.4.13. Spider Web Analysis: Sanofi
13.4.14. Spider Web Analysis: Takeda Pharmaceuticals
13.5. Most Active Players: Distribution by Number of Initiatives
14. MARKET IMPACT ANALYSIS: DRIVERS, RESTRAINTS, OPPORTUNITIES AND CHALLENGES
14.1. Chapter Overview
14.2. Market Drivers
14.3. Market Restraints
14.4. Market Opportunities
14.5. Market Challenges
14.6. Conclusion
15. GLOBAL DIGITAL BIOMARKER SOLUTIONS MARKET
15.1. Chapter Overview
15.2. Assumptions and Methodology
15.3. Global Digital Biomarker Solutions Market, Historical Trends (since 2018) and Future
Estimates (till 2035)
15.3.1. Scenario Analysis
15.3.1.1. Conversative Scenario
15.3.1.2. Optimistic Scenario
15.4. Key Market Segmentation
16. DIGITAL BIOMARKER SOLUTIONS MARKET, BY TYPE OF PRODUCT
16.1. Chapter Overview
16.2. Assumptions and Methodology
16.3. Digital Biomarker Solutions Market: Distribution by Type of Product, 2018, 2024 and 2035
16.3.1. Digital Biomarker Solutions Market for Software / Applications: Historical Trends (since 2018) and Future Estimates (till 2035)
16.3.2. Digital Biomarker Solutions Market for Wearables: Historical Trends Historical Trends (since 2018) and Future
Estimates (till 2035)
16.3.3. Digital Biomarker Solutions Market for Sensors: Historical Trends (since 2018) and Future
Estimates (till 2035)
16.3.4. Digital Biomarker Solutions Market for Gaming Solutions: Historical Trends (since 2018) and Future
Estimates (till 2035)
16.4. Data Triangulation and Validation
17. DIGITAL BIOMARKER SOLUTIONS MARKET, BY PURPOSE OF SOLUTION
17.1. Chapter Overview
17.2. Assumptions and Methodology
17.3. Digital Biomarker Solutions Market: Distribution by Purpose of Solution, 2018, 2024 and 2035
17.3.1. Digital Biomarker Solutions Market for Monitoring: Historical Trends (since 2018) and Future Estimates (till 2035)
17.3.2. Digital Biomarker Solutions Market for Diagnosis: Historical Trends (since 2018) and Future Estimates (till 2035)
17.3.3. Digital Biomarker Solutions Market for Early Detection: Historical Trends (since 2018) and Future Estimates (till 2035)
17.3.4. Digital Biomarker Solutions Market for Predictive Insights: Historical Trends (since 2018) and Future Estimates (till 2035)
17.4. Data Triangulation and Validation
18. DIGITAL BIOMARKER SOLUTIONS MARKET, BY TYPE OF BIOMARKER
18.1. Chapter Overview
18.2. Assumptions and Methodology
18.3. Digital Biomarker Solutions Market: Distribution by Type of Biomarker, 2018, 2024 and 2035
18.3.1. Digital Biomarker Solutions Market for Physiological Biomarkers: Historical Trends (since 2018) and Future Estimates (till 2035)
18.3.2. Digital Biomarker Solutions Market for Vocal Biomarkers: Historical Trends (since 2018) and Future Estimates (till 2035)
18.3.3. Digital Biomarker Solutions Market for Cognitive Biomarkers: Historical Trends (since 2018) and Future Estimates (till 2035)
18.3.4. Digital Biomarker Solutions Market for Idiosyncratic Biomarkers: Historical Trends (since 2018) and Future Estimates (till 2035)
18.3.5. Digital Biomarker Solutions Market for Other Biomarkers: Historical Trends (since 2018) and Future Estimates (till 2035)
18.4. Data Triangulation and Validation
19. DIGITAL BIOMARKER SOLUTIONS MARKET, BY THERAPEUTIC AREA
19.1. Chapter Overview
19.2. Assumptions and Methodology
19.3. Digital Biomarker Solutions Market: Distribution by Therapeutic Area, 2018, 2024 and 2035
19.3.1. Digital Biomarker Solutions Market for Neurological Disorders: Historical Trends (since 2018) and Future Estimates (till 2035)
19.3.2. Digital Biomarker Solutions Market for Mental Health Disorders: Historical Trends (since 2018) and Future Estimates (till 2035)
19.3.3. Digital Biomarker Solutions Market for Cardiovascular Disorders: Historical Trends (since 2018) and Future Estimates (till 2035)
19.3.4. Digital Biomarker Solutions Market for Infectious Diseases: Historical Trends (since 2018) and Future Estimates (till 2035)
19.3.5. Digital Biomarker Solutions Market for Respiratory Disorders: Historical Trends (since 2018) and Future Estimates (till 2035)
19.3.6. Digital Biomarker Solutions Market for Autoimmune Disorders: Historical Trends (since 2018) and Future Estimates (till 2035)
19.3.7. Digital Biomarker Solutions Market for Substance Abuse Disorders: Historical Trends (since 2018) and Future Estimates (till 2035)
19.3.8. Digital Biomarker Solutions Market for Other Disorders: Historical Trends (since 2018) and Future Estimates (till 2035)
19.4. Data Triangulation and Validation
20. DIGITAL BIOMARKER SOLUTIONS MARKET, BY BUSINESS MODEL
20.1. Chapter Overview
20.2. Assumptions and Methodology
20.3. Digital Biomarker Solutions Market: Distribution by Business Model, 2018, 2024 and 2035
20.3.1. Digital Biomarker Solutions Market for B2B Model: Historical Trends (since 2018) and Future Estimates (till 2035)
20.3.2. Digital Biomarker Solutions Market for B2C Model: Historical Trends (since 2018) and Future Estimates (till 2035)
20.4. Data Triangulation and Validation
21. DIGITAL BIOMARKER SOLUTIONS MARKET, BY KEY GEOGRAPHICAL REGIONS
21.1. Chapter Overview
21.2. Assumptions and Methodology
21.3. Digital Biomarker Solutions Market: Distribution by Key Geographical Regions, 2018, 2024 and 2035
21.3.1. Digital Biomarker Solutions Market in North America: Historical Trends (since 2018) and Future Estimates (till 2035)
21.3.2. Digital Biomarker Solutions Market in Europe: Historical Trends (since 2018) and Future Estimates (till 2035)
21.3.3. Digital Biomarker Solutions Market in Asia-Pacific: Historical Trends (since 2018) and Future Estimates (till 2035)
21.3.4. Digital Biomarker Solutions Market in Middle East and North Africa (MENA): Historical Trends (since 2018) and Future Estimates (till 2035)
21.3.5. Digital Biomarker Solutions Market in Rest of the World: Historical Trends (since 2018) and Future Estimates (till 2035)
21.4. Data Triangulation and Validation
22. CONCLUDING REMARKS
23. EXECUTIVE INSIGHTS
23.1. Chapter Overview
23.2. Acculi Labs
23.2.1. Company Snapshot
23.2.2. Interview Transcript: Company A, Chief Executive Officer
23.3. IXICO
23.3.1. Company Snapshot
23.3.2. Interview Transcript: Company B, Business Development Manager
23.4. Tilak Healthcare
23.4.1. Company Snapshot
23.4.2. Interview Transcript: Company C, Co-Founder and Chief Executive Officer
23.5. Vocalis Health
23.5.1. Company Snapshot
23.5.2. Interview Transcript: , Company D, Former Chief Commercial Officer
24. APPENDIX 1: TABULATED DATA
25. APPENDIX 2: LIST OF COMPANIES AND ORGANIZATIONS