


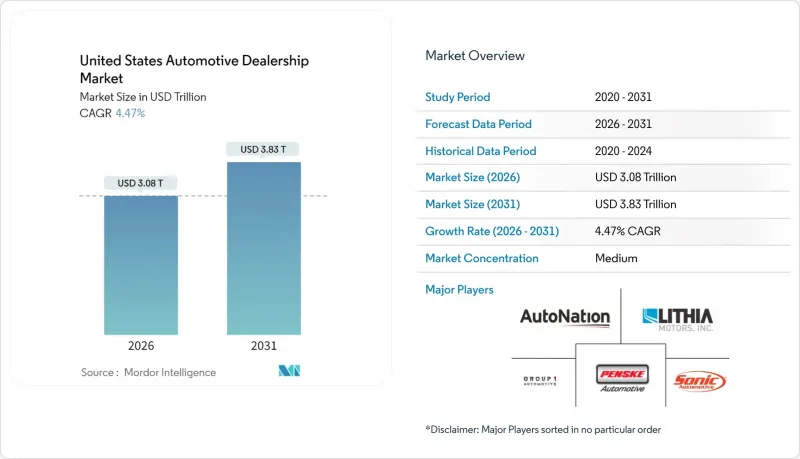
미국의 자동차 대리점 시장은 2025년 2조 9,500억 달러에서 2026년에는 3조 800억 달러로 성장하고, 2026-2031년 CAGR 4.47%로 성장을 지속하여, 2031년까지 3조 8,300억 달러에 이를 것으로 예측됩니다.

적절한 재고 관리, 인증 중고차(CPO) 수요의 급증, 그리고 전기화에 대한 대규모 투자가 온라인 가격 투명화로 인한 매출 총이익률 압박에도 불구하고 안정적인 수익 증가를 뒷받침하고 있습니다. 딜러 주도의 금융 및 보험(F&I) 포트폴리오 확대가 프론트엔드 수익성에 대한 압력을 상쇄하는 한편, 주정부 차원의 유리한 법규가 디지털 소매 도입을 가속화하고 있습니다. 차량 전동화에 따른 중대형 상용차 판매 증가는 새로운 수익원이 되고 있으며, 경트럭과 SUV에 대한 소비자의 지속적인 선호로 평균 거래 가격이 지속적으로 상승하고 있습니다. 한편, EV 대응 정비소 및 무선 소프트웨어 업데이트(OTA) 기능에 대한 막대한 자본 투자가 필요하기 때문에 자금력이 있는 통합 기업과 자본이 부족한 독립 딜러와의 경쟁 격차가 확대되고 있습니다.
프랜차이즈 그룹은 EV 지원 쇼룸과 서비스 베이에 수십억 달러를 투자할 것을 약속했습니다. 거점당 자본 지출은 레벨 2 충전기에서 미화 10만 달러에서 레벨 3 직류 급속 충전 및 전력 설비 업그레이드가 필요한 경우 미화 100만 달러 이상에 달할 전망입니다. 포드의 'Model e Certified Elite' 프로그램은 교육, 공구, 충전기 설치에 대한 OEM의 요구사항을 엄격한 기한 내에 일괄적으로 충족시켜 소매업체들의 설비 투자 계획 주기를 재구성하고 있습니다. 선행 기업들은 배터리 보증 작업 및 소프트웨어 구독 지원을 통한 추가 서비스 수익을 확보하여 EV의 기계적 수리 빈도 감소를 상쇄하고 있습니다. 지역적 격차는 여전히 존재하며, 캘리포니아 및 뉴욕주 딜러들은 중서부 북부 지역의 동종업계보다 충전기 이용률이 높으며, 2024년 전국적인 전기차 등록대수 증가는 장기적인 투자의 지속가능성을 뒷받침합니다.
OEM의 생산 안정화로 2024년 11월까지 딜러 재고는 323만 대에 달하고, 팬데믹 이전 기준치인 340-350만 대에 근접했습니다. 공급 개선으로 소매업체들은 기존 인센티브 프로그램을 재개하고, 판매량 연동형 보너스를 회복했습니다. 공급 제약으로 인한 2년간의 수익률 하락 추세를 반전시켰습니다. 국내 브랜드들은 반도체 공급 정상화를 배경으로 지불 중시층을 다시 쇼룸으로 불러들이기 위해 경쟁력 있는 리스 조건을 재구성하고 있습니다. 딜러들은 2022년 공급 부족 시기보다 느린 회전율을 관리해야 하며, 과잉 재고를 피하기 위해 AI 기반 수요 예측 엔진에 대한 의존도가 높아지고 있습니다. 풍부한 재고는 대형 딜러 그룹의 협상력을 강화하고, 할당량을 대량 구매함으로써 소규모 독립 딜러에 대한 비용 우위를 확대하고 있습니다.
EV용 배터리 리프트, 단열창고, ADAS 보정장치는 매장당 56,000-65만 달러의 비용이 소요됩니다. 특히 지방 시장에서는 저렴한 전력 공급원과 전문 기술자 확보가 어려워 노후화된 시설에 대한 재융자를 포기하고 철수하는 단독점포 경영자도 나오고 있습니다. 통합 기업은 규모의 경제로 인한 비용 우위를 누릴 수 있고, 더 큰 처리량으로 공구를 상각할 수 있기 때문에 변동비 차이를 더욱 확대할 수 있습니다. OEM 상환 프로그램은 비용의 일부를 부담하지만 일반적으로 수량 약정이 필요하며 추가 통합에 대한 인센티브가 내장되어 있습니다. 그 결과, 자본집약도는 독립기업에게 가장 시급한 구조적 역풍이 될 것이며, 전체 시장 성장률을 약 0.6% 하락시킬 것으로 예측됩니다.
미국 중고차 판매 딜러 시장 규모는 2025년 52.85%의 점유율을 차지하며, 이 채널의 경제적 기반으로서의 역할을 확고히 했습니다. 리스 반납 대수 감소에 따른 높은 잔존가치는 도매가격 지수가 정상화되는 가운데서도 딜러의 매출총이익 보호에 기여했습니다. 마진은 경매 수수료를 피하고 입고 물류 비용을 절감하는 개인 간 거래 도구의 혜택을 계속 누리고 있습니다. 인증 차량 등급은 프리미엄 가격을 유지하고, 회전율이 25% 향상되어 자금 회전율을 개선하고, 평면도 금리 지출을 지원합니다.
신차 판매량은 CAGR 5.41%로 OEM의 생산 제약이 완화되는 2031년까지 중고차 시장보다 높은 성장세를 보일 것으로 예측됩니다. 2025년 초에는 거래 가격의 평균 6.8%에 달하는 인센티브가 특히 엔트리 모델에서 구매를 망설이던 고객들을 다시 쇼룸으로 불러들였습니다. 공급이 정상화됨에 따라 미국의 자동차 대리점의 신차 시장 점유율은 완만하게 상승할 것으로 예상되지만, 가격 투명성 및 대리점 시범사업으로 인해 프론트엔드 총이익의 상승폭은 억제될 것으로 예측됩니다. 딜러들은 중고차 정비 주기를 단축하고, 업계 평균 35일 대비 27일 이내에 중고 재고를 회전시키는 것을 목표로 두 차종 모두에서 종합적인 매출 총이익 성과를 유지하고 있습니다.
2025년 기준 프랜차이즈 그룹은 미국의 자동차 대리점 시장의 57.60%를 점유하고 있으며, 소비자 직접 판매 디지털 플랫폼은 2031년까지 6.02%의 예측 CAGR로 가장 높은 성장률을 기록할 전망입니다. 이는 독점적 OEM 할당, 보증 권한, 금융 자회사와의 협력 등 높은 진입장벽을 구축하는 요소에 의해 뒷받침되고 있습니다. 시장통합기업은 리시아의 조달 및 마케팅의 규모의 경제 등 인수 시너지를 활용하여 점포당 EBITDA를 확대하고자 합니다. 디지털 전문 기업들은 자산 경량화 모델을 활용하여 기여이익률은 낮지만 두 자릿수 증가율을 기록하고 있습니다. 한편, 옴니채널 하이브리드 모델도 부상하고 있으며, 아마존 오토스는 딜러의 주문 처리 기능을 통합하여 소비자의 편의성을 유지하면서 라스트마일 물류의 비용 효율화를 실현하고 있습니다.
독립 대리점은 가격에 민감한 고객이 협상의 유연성과 비 OEM 보증 패키지를 중요시하는 분야에서 존재의 의미를 유지하고 있습니다. 그러나 프랜차이즈 사업자에게 의무적으로 부여된 EV 전용 툴과 OTA 소프트웨어에 대한 권리는 향후 전동화가 진행될수록 구조적 우위를 점할 수 있을 것으로 보입니다. 시간이 지남에 따라 미국의 자동차 대리점 시장 규모는 후계자 계획과 높은 자본집약도로 인해 단일 매장 소유주들이 사업 매각을 강요받는 가운데, 고수익 다주(多州)에 진출한 그룹에 편중될 것으로 예측됩니다. 클릭 투 바이 플랫폼이나 당일 서비스 레인에 투자하는 가맹점은 기존 방문 고객에만 의존하는 경쟁사보다 더 높은 성과를 거둘 수 있습니다.
The United States automotive dealership market is expected to grow from USD 2.95 trillion in 2025 to USD 3.08 trillion in 2026 and is forecast to reach USD 3.83 trillion by 2031 at 4.47% CAGR over 2026-2031.
Well-balanced inventories, surging certified pre-owned (CPO) demand, and heavy electrification investments are underpinning steady revenue gains even as online price transparency squeezes gross margins. Dealer-led expansion of finance and insurance (F&I) portfolios is offsetting pressure on front-end profitability, while favorable state legislation is accelerating digital retail adoption. Rising medium and heavy-commercial-vehicle sales tied to fleet electrification offer an incremental profit pool, and sustained consumer preference for light trucks and SUVs continues to lift average transaction values. At the same time, substantial capital requirements for EV-ready service bays and over-the-air (OTA) software capability are widening the competitive gap between well-funded consolidators and under-capitalized independents.
Franchise groups have pledged billions for EV-ready showrooms and service bays . Capital outlays per location range from USD 100,000 for Level 2 chargers to more than USD 1 million, where Level 3 DC fast-charging plus utility upgrades are required. Ford's Model e Certified Elite program illustrates OEM mandates that bundle training, tooling, and charger installation under strict timelines, reshaping cap-ex planning cycles for retailers. Early movers capture incremental service profits from battery warranty work and software-subscription enablement, offsetting EVs' lower mechanical-repair frequency. Geographic disparity persists; dealers in California and New York see higher charger utilization than peers in the Upper Midwest, yet nationwide EV registration growth in 2024 supports long-run investment viability.
OEM production stability lifted dealer stock to 3.23 million units by November 2024, close to the 3.4 - 3.5 million pre-pandemic norm. Improved supply lets retailers restore traditional incentive programs and recoup volume-based bonuses, reversing two years of margin erosion caused by constrained pipelines. Domestic brands, supported by normalized chip supply, re-establish competitive lease offers that draw payment-sensitive buyers back to showrooms. Dealers must manage slower turn-rates than in 2022's shortage era, prompting heavier reliance on AI-driven demand-forecasting engines to avoid over-stocking. Robust inventory also strengthens the negotiating power of large dealer groups, who can bulk-purchase allocations, widening their cost advantage over smaller independents.
EV battery hoists, insulated storage, and ADAS calibration rigs cost USD 56,000-650,000 per rooftop . Access to affordable power feeds and specialized technicians is especially constrained in rural markets, forcing some single-point operators to exit instead of refinancing aging facilities. Consolidators enjoy scale cost leverage and can amortize tooling over larger throughput, widening their variable-cost gap. OEM reimbursement programs partially defray expenses but usually require volume commitments, embedding further consolidation incentives. Consequently, capital intensity is the most immediate structural headwind for independents, lowering market-wide growth by an estimated 0.6 percentage points.
Other drivers and restraints analyzed in the detailed report include:
For complete list of drivers and restraints, kindly check the Table Of Contents.
The United States automotive dealership market size for used vehicles held a 52.85% share in 2025, cementing its role as the channel's economic backbone. Elevated residual values, bolstered by curtailed lease returns, helped dealers protect grosses even as wholesale indices normalized. Margins continue to benefit from private-party acquisition tools that circumvent auction fees and reduce inbound logistics costs. Certified tiers maintain premium pricing and 25% faster turn-rates, improving cash velocity that supports floorplan interest outlays.
New vehicles are projected to log a 5.41% CAGR, outpacing used growth through 2031 as OEM production constraints fade. Incentives averaging 6.8% of transaction price in early 2025 have pulled sidelined buyers back into showrooms, especially on entry-level trims. As supply normalizes, the United States automotive dealership market share for new vehicles is expected to climb modestly, though pricing transparency and agency pilots will cap front-end gross upside. Dealers tighten reconditioning cycles on trade-ins, aiming to flip used inventory within 27 days versus the 35-day industry median, sustaining blended gross performance across both vehicle streams.
Franchised groups controlled 57.60% of the United States automotive dealership market in 2025, and direct-to-consumer digital platforms record the highest forecast CAGR at 6.02% to 2031, underpinned by exclusive OEM allocations, warranty authority, and financing captive ties that erect high entry barriers. Market consolidators leverage acquisition synergies such as Lithia's economies in procurement and marketing to expand EBITDA per rooftop. Digital pure-plays leverage asset-light models, booking double-digit unit gains despite narrow contribution margins. Still, omnichannel hybrids are emerging, with Amazon Autos integrating dealer fulfillment to keep last-mile logistics cost-effective while preserving consumer convenience.
Independent lots retain relevance where price-sensitive shoppers value negotiation flexibility and non-OEM warranty bundles. Yet franchise operators' mandated EV tooling and OTA software rights grant them a structural advantage in an electrified future. Over time, the United States automotive dealership market size is expected to skew toward high-performing multi-state groups as succession planning and capital intensity prompt single-store owners to divest. Franchisees that invest in click-to-buy platforms and same-day service lanes will outperform peers relying solely on legacy walk-in traffic.
The United States Automotive Dealership Market Report is Segmented by Type (New-Vehicle Sales and Used-Vehicle Sales), Retailer (Franchised Dealers, Independent Dealers, and More), Vehicle Type (Passenger Cars, Light Trucks and SUVs, and More), Sales Channel (Brick and Mortar, Online/Omnichannel), Customer Segment, and Region. The Market Forecasts are Provided in Terms of Value (USD).