


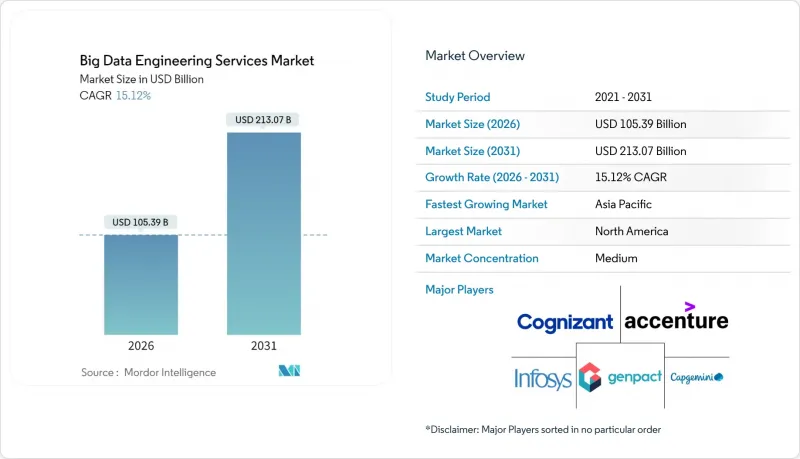
빅데이터 엔지니어링 서비스 시장 규모는 2026년에는 1,053억 9,000만 달러로 추정되며, 2025년 915억 4,000만 달러에서 성장이 전망됩니다.
2031년까지 2,130억 7,000만 달러에 달할 것으로 예상되며, 2026년부터 2031년까지 CAGR 15.12%로 확대될 것으로 전망됩니다.

AI 기반 의사결정의 지속적인 채택, IoT 엔드포인트의 확대, 그리고 원시 데이터와 비정형 정보를 신뢰할 수 있는 인사이트로 전환해야 하는 필요성이 수요를 촉진하고 있습니다. 기업들은 처리 지연을 크게 줄인 탄력적인 플랫폼으로 워크로드를 이전하고, 성과 기반 서비스 계약을 통해 가치 실현 시간을 단축하고 있습니다. 동시에 위험 회피 지향적인 조직이 벤더 종속을 피하고 강화되는 데이터 주권 규제를 준수하기 위해 하이브리드 아키텍처가 주목받고 있습니다. 한편, 자동화된 데이터 파이프라인 툴은 수동 코딩 및 유지보수 오버헤드를 줄여 인력 부족을 완화하고 있습니다.
산업용 센서, 소셜 플랫폼, 엣지 디바이스는 페타바이트 규모의 원시 데이터를 생성하는데, 기존 데이터 웨어하우스에서는 지연이 급증하지 않고서는 이를 흡수할 수 없습니다. 중장비 산업 조직은 진동, 압력, 환경 측정값을 밀리초 단위로 스트리밍하지만, 스키마의 유연성 부족으로 인해 약 70%의 데이터가 활용되지 못하고 있습니다. 현재 서비스 제공업체들은 반구조화된 페이로드를 수용하고, 인라인 분석을 수행하며, 실시간 분석 엔진과 호환되는 컬럼 형식으로 데이터를 저장하는 '스키마 온 리드(Schema on Read)' 방식의 레이크하우스를 도입하고 있습니다. MQTT, OPC-UA, 주요 소셜 API를 위한 사전 구축된 커넥터는 도입 기간을 단축하고, 엣지 게이트웨이는 이벤트를 로컬로 처리하여 백홀 비용을 절감합니다. 이러한 기능들이 결합되어 통제할 수 없는 데이터 증가를 예측 보존, 고객 감정 추적, 공급망 예측을 강화하는 활용 가능한 인사이트로 전환합니다.
조달 책임자들은 시간당 청구 계약을 거부하고, 100밀리초 미만의 쿼리 지연이나 99.9%의 파이프라인 가동률과 같은 성능 목표를 중요하게 여기는 경향이 있습니다. 성과 연동 계약에서는 KPI 미달 시 페널티 조항이 발동되고, 기준을 초과하는 서비스 수준에는 보상금이 지급됩니다. 이를 통해 공급자는 테스트 자동화, 자가 복구 작업 구현, SLA 위반 발생 전 이상 징후를 감지하는 모니터링 대시보드 도입 등을 추진하고 있습니다. CFO는 지출 변동에 대한 상한선 설정으로 이 모델을 지지하고, 벤더는 전략적 협력 강화와 지속적인 최적화 워크스트림의 업셀링을 위해 이 모델을 채택하고 있습니다. 초기 도입 기업들은 시간 및 자재 계약 대비 20-30%의 운영비 절감과 재무적 성과가 데이터 플랫폼의 성과와 직결되어 경영진의 빠른 공감대 형성을 이뤘다고 보고하고 있습니다.
스트리밍 아키텍처, 레이크하우스 최적화, 머신러닝 기반 오케스트레이션에 정통한 전문가들의 구인난은 여전히 높은 수준입니다. 선임 엔지니어의 급여는 기존 DBA에 비해 40-60% 더 높으며, 이는 공급자와 고객 모두의 운영 비용을 증가시키고 있습니다. 이러한 격차를 해소하기 위해 벤더들은 부트캠프 운영, 오프쇼어 팀 인증, 수작업 부하를 줄여주는 자동화를 도입하는 등 다양한 노력을 기울이고 있습니다. 그러나 금융 서비스나 의료 분야와 같이 규제가 까다롭고 복잡한 도입 환경에서는 자동화로 완전히 대체할 수 없는 실무 전문 지식이 여전히 필요하며, 이는 프로젝트 일정을 지연시키고 동시 대응 능력을 제한하는 요인으로 작용하고 있습니다.
2025년 기준, 데이터 통합 및 ETL 서비스는 빅데이터 엔지니어링 서비스 시장의 31.21%를 차지하고 있으며, 이 지위는 20개 이상의 데이터 소스를 관리하고 엄격한 통합을 필요로 하는 기업들에 의해 확보되고 있습니다. 이 부문의 우위는 트랜잭션, 센서, 클릭스트림 이벤트를 레이크하우스 리포지토리에 동기화하는 실시간 스트리밍 아키텍처에 크게 의존하고 있습니다. 벤더는 분 단위의 업데이트 주기를 유지하는 CDCU(Change Data Capture) 파이프라인과 스키마 진화 정책을 배포하고, 재고 회전율과 불량 시그널을 추적하는 대시보드의 요구 사항을 충족하고 있습니다. 거버넌스 요구사항이 강화됨에 따라, 수집 작업에 직접 통합된 확장된 데이터 시스템 추적, 검증 및 이상 복구 루틴에 대한 요구가 증가하고 있습니다.
고급 분석 및 시각화는 15.61%의 CAGR로 가장 빠르게 성장하는 구성요소입니다. 서비스 제공업체는 사전 설정된 노트북, 도메인별 특징 저장소, 반응형 대시보드를 번들로 제공하고, 원시 데이터를 며칠 내에 예측 또는 처방 지침으로 변환합니다. 자연어 쿼리 계층은 인사이트 생성을 민주화하고, SQL 전문 지식 없이도 사업부 직원이 가설을 반복적으로 검증할 수 있도록 지원합니다. 분석 결과가 성과 연동형 계약의 기반이 되기 때문에 공급자는 수천 명의 동시 사용자에 대해 1초 미만의 렌더링 속도를 보장하는 배포 플레이북을 적극적으로 개선하고 있습니다. 통합과 분석은 서로를 보완합니다: 깨끗하고 통합된 데이터는 고급 모델을 구동하고, 그 모델은 성능 향상을 가져와 지속적인 플랫폼 투자에 대한 정당성을 뒷받침합니다.
재무 부문은 2025년 지출의 29.14%를 차지하며 규제 보고, 유동성 위험 계산, 수익 예측에 대한 깊은 관여를 반영하고 있습니다. 업무 부하에는 다중 통화 집계, 일일 손익 계산, 감사 대응이 필수인 스트레스 테스트 엔진이 포함됩니다. 따라서 공급자는 확정적 계산, 불변의 원장, 외부 청산기관과의 자동 대조 등을 중요시하고 있습니다. 그럼에도 불구하고 재무 부문의 영역은 계속 확장되고 있으며, 수익률 곡선의 변동과 자기자본 비율의 임계치를 재무 부서에 알려주는 지속적인 인텔리전스 대시보드로 확장되고 있습니다.
마케팅 및 영업 파이프라인은 15.49%의 CAGR로 성장하고, 행동 신호를 활용하여 거의 실시간으로 초개인화된 캠페인을 전개할 수 있습니다. 고객 360 아키텍처는 웹 브라우징, POS, 고객 서비스 기록을 통합하고, 차선책으로 제안 엔진을 조언합니다. 지능형 라우팅 모델은 최적의 채널, 크리에이티브, 타이밍을 선택하고 전환율을 두 자릿수 퍼센트로 향상시킵니다. 서비스 기업에서는 알고리즘 조정의 A/B 테스트를 실시하고, 효과 개선 지표를 자동 예산 배분에 반영하는 실험 프레임워크를 도입하고 있습니다. 프라이버시 규제로 인해 제3자 쿠키가 제한되면서 퍼스트 파티 데이터 플랫폼이 전략적 자산으로 부상하고 있으며, 시장 출시 기능에 대한 엔지니어링 수요가 더욱 증폭되고 있습니다.
2025년에는 북미가 39.18%의 매출로 1위를 차지했으며, 이는 탄탄한 클라우드 인프라, AI의 조기 도입, 높은 수준의 거버넌스를 요구하는 엄격한 법규가 이를 뒷받침하고 있습니다. 금융 서비스 기업은 실시간으로 자금세탁방지 모델을 정교화하고, 의료 네트워크는 HIPAA 준수 클러스터에서 정밀 의료 워크플로우를 구축합니다. 벤처 자금이 데이터 플랫폼 계열 스타트업에 안정적으로 유입되고 있으며, 이는 아키텍처 강화 및 시장 출시 확대를 위한 서비스 계약을 촉진하고 있습니다.
아시아태평양은 2031년까지 CAGR 15.74%로 다른 지역보다 높은 성장률을 보일 것으로 예상됩니다. 정부가 지원하는 스마트 제조 구역, 5G 구축, 디지털 뱅킹 라이선스 승인으로 인해 고도의 엔지니어링을 필요로 하는 데이터 양이 급증하고 있습니다. 중국과 인도의 E-Commerce 대기업은 매일 수십억 건의 클릭스트림 이벤트를 처리하며 엑사바이트 규모의 레이크하우스 구축에 있어 지역 표준을 촉진하고 있습니다. 제조업 거점에서는 IIoT 센서를 통한 조립 라인의 혁신이 진행되고 있으며, 지연을 압축하고 새로운 데이터 지역화 규제에 대응할 수 있는 엣지 클라우드 파이프라인이 요구되고 있습니다.
유럽에서는 GDPR과 향후 AI 거버넌스 법으로 인해 조직이 프라이버시 바이 디자인 제어를 도입해야 할 필요성이 높아져 꾸준히 도입이 이뤄지고 있습니다. 자동차 및 산업 복합 기업들은 디지털 트윈을 시범 도입하여 원격 측정, 유지보수 기록, 공급업체 데이터를 통합하여 처리량을 늘리고 다운타임을 줄이는 데 활용하고 있습니다. 중동 및 아프리카는 신흥 시장이지만 석유 및 가스 현대화 예산과 스마트 시티 컨소시엄을 기반 데이터 계층에 투입하고 있습니다. 고 대역폭 해저케이블과 지역별 클라우드 존은 진입장벽을 낮춰 선택적이긴 하지만 지속적인 성장 가능성을 보여주고 있습니다.
big data engineering services market size in 2026 is estimated at USD 105.39 billion, growing from 2025 value of USD 91.54 billion with 2031 projections showing USD 213.07 billion, growing at 15.12% CAGR over 2026-2031.
Continued adoption of AI-driven decision making, expansion of IoT endpoints, and the need to convert raw, unstructured information into reliable intelligence all fuel demand. Enterprises migrate workloads to elastic platforms that slash processing latency, while outcome-based service contracts accelerate time-to-value. At the same time, hybrid architectures gain traction as risk-averse organizations hedge against vendor lock-in and comply with tightening data-sovereignty rules. Meanwhile, automated data-pipeline tools temper talent shortages by reducing manual coding and maintenance overhead.
Industrial sensors, social platforms, and edge devices generate petabytes of raw records that traditional warehouses cannot absorb without latency spikes. Organizations in heavy-asset industries stream vibration, pressure, and environmental readings at millisecond intervals, yet limited schema flexibility keeps roughly 70% of those records dark. Service providers now deploy schema-on-read lakehouses that accept semi-structured payloads, perform inline parsing, and store data in columnar formats compatible with real-time analytics engines. Pre-built connectors for MQTT, OPC-UA, and common social APIs compress rollout times, while edge gateways process events locally to cut backhaul costs. These capabilities collectively transform uncontrolled data growth into exploitable insights that sharpen predictive maintenance, customer sentiment tracking, and supply-chain forecasting.
Procurement leaders increasingly reject billable-hour engagements in favor of performance milestones such as sub-100 ms query latency or 99.9% pipeline uptime. Under outcome agreements, penalty clauses kick in if KPIs slip, and bonus pools reward above-baseline service levels. Providers therefore automate testing, implement self-healing jobs, and deploy observability dashboards that flag anomalies before SLA breaches occur. CFOs endorse the model because it caps spend volatility, while vendors embrace it to deepen strategic ties and upsell continuous optimization workstreams. Early adopters report 20-30% operating-expense reduction versus time-and-materials contracts and faster executive buy-in when financial results tie directly to data-platform performance.
Vacancy rates remain high for specialists versed in streaming architectures, lakehouse optimization, and ML-driven orchestration. Senior engineers command 40-60% premium salaries versus traditional DBAs, driving operating costs higher for both providers and clients. To bridge gaps, vendors roll out bootcamps, certify offshore teams, and embed automation that shrinks manual workload. Yet complex, regulated deployments, especially in financial services and healthcare, still require hands-on expertise that automation cannot fully replace, slowing project timelines and limiting concurrent engagement capacity.
Other drivers and restraints analyzed in the detailed report include:
For complete list of drivers and restraints, kindly check the Table Of Contents.
In 2025, data integration and ETL services held 31.21% share of the big data engineering services market, a position secured by enterprises that manage upward of 20 data sources and require rigorous consolidation. The segment's dominance owes much to real-time streaming architectures that synchronize transactional, sensor, and clickstream events into lakehouse repositories. Vendors deploy change-data-capture pipelines and schema evolution policies that sustain minute-level refresh cycles, satisfying dashboards that track inventory turns and fraud signals. As governance mandates tighten, demand rises for extended lineage, validation, and anomaly-repair routines embedded directly in ingestion jobs.
Advanced analytics and visualization is the fastest-expanding component at a 15.61% CAGR. Here, service providers bundle pre-configured notebooks, domain-specific feature stores, and responsive dashboards that convert raw observations into predictive or prescriptive guidance within days. Natural-language query layers democratize insight generation, empowering line-of-business staff to iterate hypotheses without SQL proficiency. Because analytics outcomes anchor outcome-based contracts, providers iterate aggressively on deployment playbooks to ensure sub-second rendering speeds for thousands of concurrent users. Together, integration and analytics remain symbiotic: clean, unified data feeds advanced models that, in turn, surface performance gains justifying continual platform investment.
Finance offices accounted for 29.14% of 2025 spending, reflecting deep roots in regulatory reporting, liquidity risk computation, and revenue forecasting. Workloads include multi-currency aggregation, intraday P&L, and stress-testing engines that must remain audit-ready. Providers therefore emphasize deterministic calculations, immutable ledgers, and automated reconciliation against external clearinghouses. Even so, finance footprints increasingly extend to continuous intelligence dashboards that alert treasuries on shifting yield curves or capital-ratio thresholds.
Marketing and sales pipelines, growing at a 15.49% CAGR, tap behavioral signals to craft hyper-personalized campaigns delivered in near real time. Customer 360 architectures fuse web browsing, point-of-sale, and customer-service transcripts to advise next-best-offer engines. Intelligent routing models select optimal channels, creative, and timing, improving conversion by double-digit percentages. Service firms embed experimentation frameworks that A/B test algorithmic tweaks and feed uplift metrics into automated budget allocation. As privacy regulations restrict third-party cookies, first-party data platforms emerge as strategic assets, further amplifying engineering demand in go-to-market functions.
The Big Data Engineering Services Market Report is Segmented by Service Type (Data Modelling and Architecture, Data Integration and ETL, and More), Business Function (Marketing and Sales, Finance, and More), Organization Size (Small and Medium Enterprises and Large Enterprises), Deployment Mode (Cloud, On-Premises, and Hybrid), and Geography. The Market Forecasts are Provided in Terms of Value (USD).
North America led with 39.18% revenue in 2025, underpinned by established cloud infrastructure, early AI adoption, and stringent legislation that necessitates sophisticated governance. Financial-services firms refine anti-money-laundering models in real time, while healthcare networks orchestrate precision-medicine workflows on HIPAA-compliant clusters. Venture funding channels steady capital into data-platform startups, which in turn spur service engagements for architecture hardening and go-to-market scaling.
Asia Pacific is projected to outpace other regions at a 15.74% CAGR through 2031. Governments sponsor smart-manufacturing zones, 5G rollouts, and digital-banking licenses that spawn data volumes demanding advanced engineering. Chinese and Indian e-commerce giants ingest billions of clickstream events daily, catalyzing regional benchmarks for exabyte-scale lakehouses. Manufacturing hubs retrofit assembly lines with IIoT sensors, necessitating edge-cloud pipelines that compress latency while meeting nascent data-localization statutes.
Europe shows steady uptake as GDPR and forthcoming AI-governance acts compel organizations to embed privacy-by-design controls. Automotive and industrial conglomerates pilot digital-twin initiatives, integrating telemetry, maintenance logs, and supplier data to sharpen throughput and cut downtime. Middle East and Africa, while still emerging, channel oil-and-gas modernization budgets and smart-city consortiums into foundational data layers. High-bandwidth subsea cables and regional cloud zones lower entry barriers, signaling potential for sustained, if selective, growth.