


해상 화물 운송 시장은 2025년에 3,583억 1,000만 달러로 평가되었으며, 2026년 3,773억 7,000만 달러에서 2031년까지 4,889억 7,000만 달러에 달할 것으로 예측됩니다.
예측 기간(2026-2031년) 동안 CAGR은 5.30%로 예상됩니다.

컨테이너 선사의 견조한 수익, 디지털 예약 기준으로의 전환, 그리고 적시성에서 적시성으로의 재고 전략 전환이 이러한 전망을 뒷받침하고 있습니다. 상선대의 증가, 새로운 항만 투자, E-Commerce에 따른 화물의 세분화는 공간, 속도, 가시성을 보장할 수 있는 서비스 제공업체에게 더 많은 기회를 제공하고 있습니다. 컨테이너 수송능력의 80%를 점유하고 있는 얼라이언스는 2025년부터 시행되는 새로운 운영체제를 발표하며 스케줄 조정과 슬롯 이용률을 더욱 강화할 계획입니다. 그러나 2024년 478척의 신조 컨테이너선 취항이 수요를 초과하여 현물 운임에 압력을 가하고 화주 측에 협상 우위를 가져다주고 있습니다.
중국 8개 주요 항만의 2024년 처리량은 전년 대비 7% 증가한 2억 2,400만 TEU에 달할 것으로 예상되며, 상하이항은 5,000만 TEU를 돌파하며 세계 1위 컨테이너 처리 항만의 지위를 확고히 했습니다. 미국 주요 허브 항만도 처리량 기록을 갱신하고 있으며, 로스앤젤레스항은 1,030만 TEU를 달성하고, 무공해 야드 장비에 대한 투자를 진행하고 있습니다. 난샤, 창카이, 투아스의 새로운 메가 프로젝트는 항로 패턴의 재구축을 약속하며, 물동량 확보를 위한 포워더들 간의 경쟁을 심화시킬 것입니다. 병행되는 선대 확장(2024년에만 478척 인도)은 화주의 선복 선택 폭을 넓히고, 포워더는 운임 협상에서 보다 강경한 태도를 취할 수 있게 됩니다.
전 세계 소매 E-Commerce 매출은 2027년까지 8조 달러에 달할 것으로 예상되며, 소포 사이즈의 해상 화물 운송이 급증하고 있습니다. 월마트의 '포트 투 도어(Port to Door)' 서비스는 이미 마켓플레이스 판매자를 위해 1,988TEU를 처리하고 있으며, 대형 유통업체의 물류 내재화 사례를 보여주고 있습니다. 애플리케이션 프로그래밍 인터페이스(API) 연결을 채택한 포워더는 서로 다른 판매자의 주문을 일괄적으로 처리하고 통합된 소량화물(LCL) 솔루션으로 통합할 수 있습니다. 이를 통해 체류 시간과 통관상의 마찰을 줄일 수 있습니다.
2024년 초저유황 연료유(VLSF)의 평균 가격은 톤당 608달러였습니다. 유럽 해역을 경유하는 항로의 경우, 2025년부터 배출권거래제(ETS) 과징금이 톤당 170-210달러가 추가됩니다. 아시아-미국 서안(USWC) 계약의 연료조정계수(BAF)는 FEU당 623달러로 상승하여 전체 운임의 37%를 차지합니다. 포워더는 추가 요금을 헤지하거나 전가해야 하며, 경쟁 입찰 주기에서 미묘한 균형 조정이 요구됩니다.
2025년, FCL(Full Container Loaded) 화물은 해상 화물 운송 시장의 60.35%를 차지하며, 팬데믹으로 인한 병목 현상으로 재고를 앞당긴 제조업의 주요 운송 수단으로서의 지위를 유지했습니다. FCL의 해상 화물 운송 시장 규모는 항만 용량 확장 프로젝트와 얼라이언스 네트워크 재편에 따라 확대될 것으로 예상됩니다. 반면, 소량화물(LCL)은 규모가 작지만 EC 판매자가 SKU 재고 유지를 위해 LCL 혼적에 의존하는 경향으로 인해 4.63%의 CAGR로 성장하고 있습니다. API 연동 예약 플랫폼이 화물 혼재 및 통관 사전 절차를 간소화함에 따라 LCL의 해상 화물 운송 시장 점유율은 점차 상승할 것입니다.
디지털 견적 툴은 FCL과 LCL을 비교하여 최적의 FCL과 LCL을 단 몇 초 만에 판단하여 중간 규모 화주를 각 항해에서 가장 비용 효율적인 운송 모드로 안내합니다. 48시간 이내 컨테이너 포장 보증과 전자 화주증권을 제공하는 복합운송업체는 소비자에게 직접 배송하는 B2C 플랫폼의 주목을 받고 있습니다. 현물 지수의 변동성이 남아있는 가운데, 연료유 가격 변동 조항과 탄소 강도 조정을 특징으로 하는 FCL 계약 메커니즘은 2025년 입찰의 운임 상한선을 형성하고, 대형 사업자와 소규모 브로커 간의 가격 책정 고도화 격차를 확대할 것입니다.
아시아태평양은 2025년 매출의 40.55%를 차지할 것으로 예상되며, 중국의 수출, 동남아시아의 니어소싱, 활발한 역내 무역에 힘입어 2031년까지 지역 CAGR 5.02%로 성장할 것으로 예상됩니다. 상하이항의 5,000만 TEU 달성 기록과 남중국 난샤항의 확장으로 포워더는 풍부한 운송 서비스를 확보할 수 있습니다.
북미 주요 항만의 총 수입량은 2024년 13% 증가한 2,820만 TEU를 기록했으며, 내구소비재 재고 보충이 기여했습니다. 미국 - 멕시코 간 니어쇼어링 회랑과 관련된 해상 화물 운송 시장 규모는 특히 자동차, 전자제품, 배터리 공급망에서 확대되는 추세입니다.
유럽에서는 수에즈 운하 우회 항로로 인해 아시아 항로에 10-14일 지연이 발생하고 있으며, 통행료 면제 조치에도 불구하고 수송량은 피크 대비 57% 감소했습니다. EU 배출권거래제(EU-ETS) 및 FuelEU Maritime 규정에 따라 의무화된 탄소발자국 감사가 서비스 차별화 요소로 부상하고 있습니다.
중동 및 아프리카는 걸프 지역의 거대 프로젝트와 아프리카의 코너 회랑의 개선으로 혜택을 받고 있습니다. 벌크 화물 및 프로젝트 화물 운송업체들은 풍력 터빈과 정유소 모듈이 수출 차터를 주도할 것으로 예측하고 있습니다.
남미는 중립성을 활용하여 다각화된 무역 유치에 주력하고 있습니다. 파나마 운하는 2025년 1월부터 5월까지 1,200척의 선박이 통과하는 기록을 달성하며 관문으로서의 역할을 확고히 하고 있습니다.
The Sea Freight Forwarding Market was valued at USD 358.31 billion in 2025 and estimated to grow from USD 377.37 billion in 2026 to reach USD 488.97 billion by 2031, at a CAGR of 5.30% during the forecast period (2026-2031).
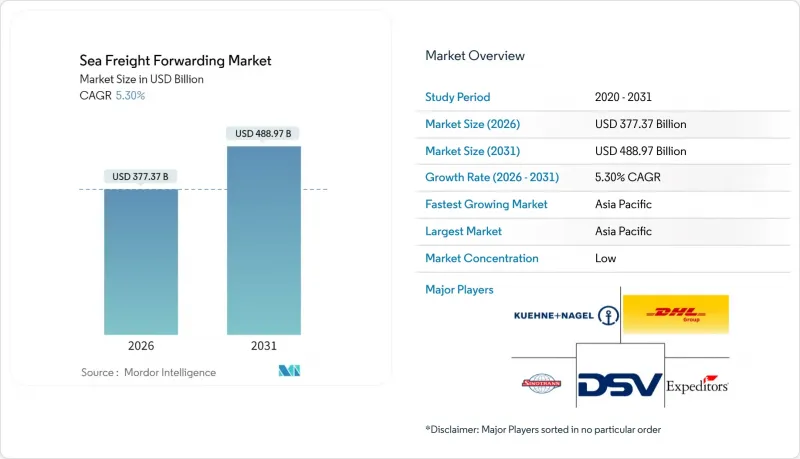
Robust earnings at container lines, the march toward digital booking standards, and a global pivot from just-in-time to just-in-case inventory strategies underpin this outlook. Merchant-fleet capacity additions, fresh port investments, and e-commerce-linked shipment fragmentation are widening the opportunity set for service providers that can guarantee space, speed, and visibility. Alliances controlling 80% of container capacity have announced new operating structures that take effect in 2025, further tightening schedule coordination and slot utilization. Yet the arrival of 478 new boxships in 2024 outpaced demand, pressuring spot rates and handing shippers negotiating leverage.
China's top eight gateways lifted 224 million TEU in 2024, up 7%, while Shanghai crossed 50 million TEU, cementing its rank as the world's busiest container port. Major U.S. hubs also broke throughput records; the Port of Los Angeles hit 10.3 million units and is investing in zero-emission yard gear. New megaprojects at Nansha, Chancay, and Tuas promise to reset sailing patterns, intensifying competition among freight forwarders for volume commitments. Parallel fleet growth-478 deliveries in 2024 alone hands shippers more slot choice, enabling forwarders to bargain harder for rates.
Global retail e-commerce sales are tracking toward USD 8 trillion by 2027, producing a wave of parcel-sized ocean consignments. Walmart's "port-to-door" service has already cleared 1,988 TEU for marketplace sellers, exemplifying how major retailers are internalizing logistics. Forwarders embracing application-program-interface connectivity can batch disparate seller orders into cohesive Less-than-Container-Load solutions, trimming dwell time and customs friction.
Very-Low-Sulfur Fuel Oil averaged USD 608 per ton in 2024; ETS levies will add USD 170-210 per ton for voyages touching European waters from 2025. Bunker Adjustment Factors jumped to USD 623 per FEU on Asia-USWC contracts, consuming 37% of all-in rates. Forwarders must hedge or pass through surcharges, a delicate balancing act in competitive bid cycles.
Other drivers and restraints analyzed in the detailed report include:
For complete list of drivers and restraints, kindly check the Table Of Contents.
Full-Container-Load shipments secured 60.35% of the sea freight forwarding market in 2025, upholding their status as the workhorse for manufacturers that frontloaded inventory during pandemic bottlenecks. The sea freight forwarding market size for FCL is forecast to climb alongside port-capacity projects and alliance network revamps. Conversely, Less-than-Container-Load, though smaller, benefits from a 4.63% CAGR as e-commerce sellers lean on LCL consolidations to maintain SKU availability. The sea freight forwarding market share of LCL will inch higher as API-linked booking platforms simplify cargo co-loading and customs pre-clearance steps.
Digital quoting tools now surface optimal FCL vs. LCL decisions in seconds, nudging mid-volume shippers toward the most cost-efficient mode per sailing. Consolidators that guarantee 48-hour container stuffing windows and electronic House Bills are attracting B2C platforms that ship direct to consumer. As volatility lingers in spot indexes, FCL contract mechanisms featuring bunker float clauses and carbon-intensity adjustments will shape rate ceilings for 2025 tenders, reinforcing the pricing sophistication gap between scale players and smaller brokers.
The Sea Freight Forwarding Market Report is Segmented by Service Type (Full-Container-Load, Less-Than-Container-Load), Cargo Type (Dry, Reefer), End-User Industry (Electronics & Semiconductors, Chemicals & Petrochemicals, Food & Beverage, Pharmaceuticals & Healthcare, and More), and Geography (North America, South America, Asia-Pacific, Europe, Middle East and Africa). The Market Forecasts are Provided in Terms of Value (USD).
Asia-Pacific generated 40.55% of 2025 revenue and posts a regional 5.02% CAGR to 2031, buoyed by Chinese exports, Southeast-Asian near-sourcing, and intense intra-Asian trade. Shanghai's record 50 million TEU milestone and South-China's Nansha expansion give forwarders abundant sailings to fill.
North America saw combined import volumes at its top ports jump 13% to 28.2 million TEU in 2024, aided by restocking in consumer durables AJOT. The sea freight forwarding market size tied to U.S.-Mexico near-shoring corridors is swelling, especially for automotive, electronics, and battery supply chains.
Europe wrestles with Suez detours that add 10-14 days to Asia rotations; traffic is still 57% below peak despite toll breaks. Carbon-footprint auditing, mandated by the EU-ETS and FuelEU Maritime rules, emerges as a service differentiator.
Middle East & Africa benefits from giga-projects across the Gulf and Horn of Africa corridor upgrades. Breakbulk and project forwarders anticipate wind-turbine and refinery modules to dominate outbound charters.
South America leverages its neutrality to court diversification trade; Panama Canal set a 1,200-transit record in the January-May 2025 window, cementing its gateway role.