


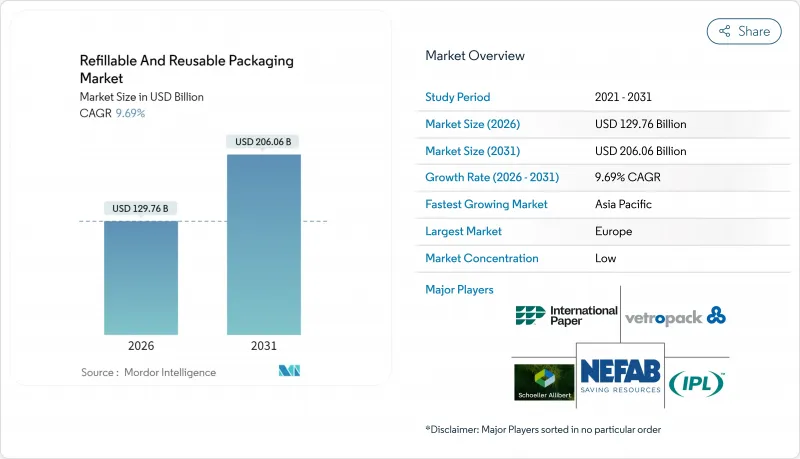
리필 및 재사용 가능 포장 시장은 2025년 1,183억 달러로 평가되었고, 2026년에는 1,297억 6,000만 달러, 2031년까지 2,060억 달러로 성장할 것으로 예상됩니다. 2026년에서 2031년에 걸쳐 CAGR은 9.69%를 나타낼 전망입니다.

순환형 경제에 대한 규제, 공급망 비용 압력, 소비자의 지속가능성에 대한 선호도가 선진국과 신흥국 모두에서 일치하고 있기 때문에 리필 및 재사용 가능 포장재 시장은 가속화되고 있습니다. 유럽의 법 정비 확실성, 중국의 녹색 소포 의무화, 세척 및 추적 솔루션의 기술적 혁신은 인프라 부족이 여전히 남아있는 가운데 채택을 가속화하고 있습니다. 기업은 재활용 자산을 물류총 비용 절감, 원재료 가격 변동 억제, 브랜드 가치 강화 수단으로 자리매김하고 있으며 투자자는 측정 가능한 폐기물 감소에 대한 저비용 자본을 제공합니다. 경쟁 활동은 자산 활용률과 컴플라이언스 보고를 극대화하기 위해 IoT 센서의 통합, 예측 분석, 턴키 세척 서비스 제공에 중점을 둡니다.
확대 생산자 책임 제도에 따라 기업은 제품 수명 종료 시 비용을 내부화해야 합니다. 유럽연합(EU)은 2025년까지 65%의 재료 재활용률, 2030년까지 운송용 포장재의 90% 재이용을 의무화하고 있습니다. 중국의 택배 규제에서는 물류 사업자가 시내 배송 소포의 95%에서 재사용 가능한 포장을 달성해야 하며, 이로 인해 회수 가능한 컨테이너의 잠재 시장 규모는 120억 달러로 확대됩니다. 폐기 비용과 탄소 가격이 상승함에 따라 이러한 규정은 총 소유 비용 모델을 재사용 가능한 형식으로 이끌고 있습니다.
운영 데이터는 재사용 가능한 자산이 운임, 근무 시간 및 상각비를 줄이는 것으로 확인되었습니다. CHEP의 자동차 프로그램은 트럭 가동률을 95%로 높이고, 적재 시간을 75% 줄이고, 1차 공급업체의 연간 비용을 230만 달러 절감했습니다. CEVA 물류사는 IoT 추적 가능한 컨테이너가 일회용 카톤을 대체하여 배출량을 60% 줄이고 단기간에 투자 회수를 실현했다고 보고하고 있습니다. 고속 순환 시스템에서 투자는 일반적으로 18개월 이내에 회수됩니다.
반품 네트워크는 특히 루트 밀도가 낮은 지역에서 운송 흐름에 비해 취급 비용을 3배로 늘릴 수 있습니다. 콜드체인 반품은 추가 비용을 밀어 올리고 일부 브랜드는 재사용 프로그램을 대도시 지역의 주요 경로로 제한해야 할 상황입니다.
2025년 현재 플라스틱은 재충전 가능 및 재사용 가능 포장 시장의 48.85%를 차지했습니다. 이는 자동화 시스템과의 호환성을 유지하면서 높은 사이클 수를 견디는 폴리프로필렌 및 폴리에틸렌 용기 때문입니다. 경량 설계는 화물 배출량과 총 비용을 절감합니다. 유리는 중량이 있는 것, 고급 음료나 스킨 케어 제품이 순도와 고급감을 중시하기 위해, 12.18%의 연평균 복합 성장률(CAGR)을 기록하고 있습니다. Vetropack의 경량 플린트 기술은 브랜드 미관을 보호하면서 운송 비용의 차이를 줄이고 있습니다. 금속 드럼과 토트는 내구성이 무게를 뛰어넘는 화학제품 분야에서 주력하고 있으며, 종이 골판지는 자동차 부품 운송에 특별한 역할을 담당하고 있습니다.
식품접촉재생플라스틱에 대한 지속가능성의 검증으로 일부 브랜드가 유리나 금속으로 이행할 가능성은 있지만, IoT 태그를 포함한 첨단 폴리머는 고속순환시스템에서 플라스틱의 역할을 확고하게 합니다. 결과적으로 리필 및 재사용 가능한 포장 시장은 재료 과학의 발전과 함께 비용 효율성, 브랜딩 필요성 및 규제 준수의 균형을 맞추고 있습니다.
유럽은 2025년 시점에서 리필 및 재사용 가능 포장 시장의 34.08%를 차지하고 있으며, 이는 수십년에 걸친 정책의 적층과 인프라 투자를 반영하고 있습니다. EU가 2030년까지 운송용 포장재의 90% 재이용을 의무화할 방침은 기업의 장기 예산 편성의 기반이 됩니다. 독일에서는 공동이용연합에 의해 크레이트의 회전기간이 2.4일로 단축되고, 프랑스에서는 고급 브랜드와 제휴해 고급 유리제 리필 시스템의 시험 운용이 진행되고 있습니다. 영국은 연질 플라스틱의 재활용 능력 강화에 5,000만 달러를 투입하여 국내 순환형 경제를 강화하고 있습니다.
아시아태평양은 2031년까지 연평균 복합 성장률(CAGR) 10.55%로 성장을 견인합니다. 중국의 도시내 소포 95% 재사용 규제로 라스트마일 배송용 자전거에 적합한 접이식 토트백 시장이 120억 달러 규모로 확대됩니다. 일본에서는 생산자 책임제도의 대상을 전자기기로 확대하여 재이용 가능한 수송용 포장재 수요를 촉진. 인도에서는 제조업의 확대에 따라 리터너블 자동차 랙 수요가 증가. 한국에서는 클린룸용 컨테이너 풀에 IoT 태그와 블록체인 추적 시스템을 도입. 동남아시아에서는 지역 세정 거점에 대한 해외 투자가 유입.
북미에서는 기업의 기후 변화 대책 공약과 주 수준의 확대 생산자 책임법에 의해 꾸준한 진전을 볼 수 있습니다. 디스패치 상품은 레스토랑용 컨테이너 공유 서비스를 통해 3,350억 달러 규모의 포장 폐기물 문제 해결을 위한 벤처 자금을 조달했습니다. 캐나다에서는 자원 산업에서 리필 시험 사업이 추진되고, 멕시코에서는 100년 이상의 역사를 가진 유리병 순환 시스템이 앱 기반의 회수 시스템으로 확대. 브라질과 멕시코에서는 음료용 나무 상자의 전통과 도시 지역의 환경 의식이 높아짐을 배경으로 라틴아메리카에서 새로운 전개가 시작되었습니다. 중동 및 아프리카은 아직 발전도상이면서, 소매업체가 폐쇄 루프 방식의 워터 저그프리트를 시험 도입하는 움직임에 주목이 모여 있습니다.
The refillable and reusable packaging market is expected to grow from USD 118.3 billion in 2025 to USD 129.76 billion in 2026 and is forecast to reach USD 206.06 billion by 2031 at 9.69% CAGR over 2026-2031.
The refillable and reusable packaging market is gaining speed because circular-economy regulations, supply-chain cost pressures, and consumer sustainability preferences now converge across advanced and emerging economies. Legislative certainty in Europe, green-parcel mandates in China, and technology breakthroughs in cleaning and tracing solutions accelerate adoption despite lingering infrastructure gaps. Companies treat returnable assets as levers for lower total logistics spend, reduced raw-material volatility, and stronger brand equity, while investors reward measurable waste reduction with cheaper capital. Competitive activity focuses on embedding IoT sensors, predictive analytics, and turnkey washing services to maximize asset utilization and compliance reporting.
Extended producer responsibility policies now require companies to internalize end-of-life costs. The European Union mandates 65% material recycling by 2025 and 90% reuse for transport packaging by 2030. China's express-delivery regulation requires logistics providers to achieve a 95% reusable-packaging rate for intra-city parcels, unlocking a USD 12 billion addressable market for returnable containers. These rules tilt total-cost-of-ownership models toward reusable formats as disposal fees and carbon pricing rise.
Operational data confirm that reusable assets lower freight bills, labor time, and write-offs. A CHEP automotive program increased truck utilization to 95% while cutting loading time by 75%, saving tier-one suppliers USD 2.3 million each year. CEVA Logistics reports 60% emission cuts and rapid payback when IoT-tracked boxes replace single-use cartons. In high-velocity loops, investments are typically recovered within 18 months.
Return networks can triple handling expenses relative to outbound flows, especially where route density is low. Cold-chain returns further elevate costs, pushing some brands to restrict reuse programs to high-volume urban corridors.
Other drivers and restraints analyzed in the detailed report include:
For complete list of drivers and restraints, kindly check the Table Of Contents.
Plastic held 48.85% of the refillable and reusable packaging market share in 2025, thanks to polypropylene and polyethylene containers that survive high cycle counts while aligning with automation systems. Lightweight designs reduce freight emissions and total cost. Glass, though heavier, records a 12.18% CAGR because luxury beverages and skincare prioritize purity and premium feel. Vetropack's lightweight flint technology narrows freight gaps while protecting brand aesthetics.Metal drums and totes remain staples in chemicals where durability outranks weight, and paper-based corrugates secure specialized roles in automotive part shuttles.
Sustainability scrutiny of food-contact recycled plastics may gradually shift some brands toward glass and metal, yet advanced polymers embedded with IoT tags cement plastics' role in high-velocity loops. Consequently, the refillable and reusable packaging market balances cost efficiency, branding needs, and regulatory compliance as material science progresses.
The Refillable and Reusable Packaging Market Report is Segmented by Material (Plastic, Paper and Paperboard, and More), Product (Bottles and Containers, Pallets and Crates, Ibcs, Drums and Barrels, and More), End-User Industry (Food and Beverage, Cosmetics and Personal Care, Household Care, Chemicals and Petrochemicals, Building and Construction, and More), and Geography. The Market Forecasts are Provided in Terms of Value (USD).
Europe captured 34.08% of the refillable and reusable packaging market share in 2025, reflecting decades of policy layering and infrastructure investment. The EU's 90% transport-packaging reuse mandate for 2030 anchors long-term corporate budgets. Germany's pooling alliances lower crate turnaround times to 2.4 days, while France partners with luxury houses to pilot high-end glass refill systems. The United Kingdom channels USD 50 million into flexible-plastic recycling capacity, reinforcing domestic circularity.
Asia-Pacific leads growth at a 10.55% CAGR to 2031. China's 95% intra-city parcel-reuse rule yields a USD 12 billion market for foldable totes that fit last-mile bikes. Japan extends producer-responsibility fees to electronics, stimulating reusable transport packaging, while India's manufacturing expansion boosts demand for returnable automotive racks. South Korea integrates IoT tags and blockchain tracing into clean-room container pools, and Southeast Asia receives foreign investment for regional wash depots.
North America shows steady progress driven by corporate climate pledges and state-level Extended Producer Responsibility laws. Dispatch Goods raised venture funding to tackle part of the USD 335 billion packaging-waste problem through restaurant container sharing. Canada promotes refill pilots in resource industries, and Mexico scales century-old glass-bottle loops into app-based return systems. Latin America's emerging rollouts in Brazil and Mexico draw on beverage-crate heritage and rising urban eco-awareness. The Middle East and Africa, still nascent, attract interest as retailers test closed-loop water-jug fleets.