재사용 가능 포장 시장 : 기회, 성장 요인, 산업 동향 분석 및 예측(2026-2035년)
Reusable Packaging Market Opportunity, Growth Drivers, Industry Trend Analysis, and Forecast 2026 - 2035
상품코드:1913407
리서치사:Global Market Insights Inc.
발행일:2025년 12월
페이지 정보:영문 180 Pages
라이선스 & 가격 (부가세 별도)
ㅁ Add-on 가능: 고객의 요청에 따라 일정한 범위 내에서 Customization이 가능합니다. 자세한 사항은 문의해 주시기 바랍니다.
한글목차
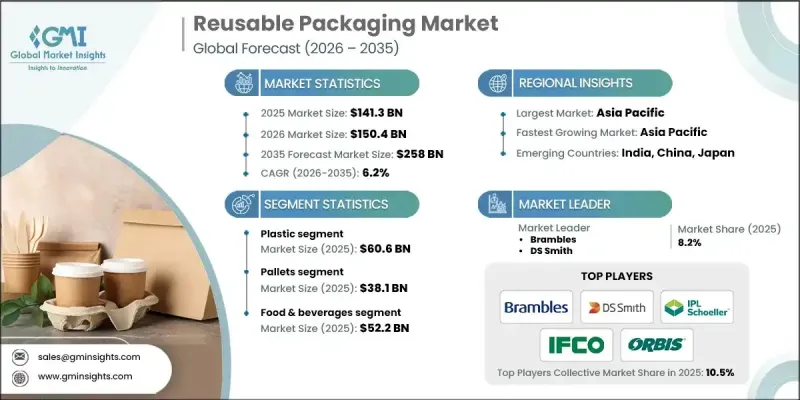
세계의 재사용 가능 포장 시장은 2025년에 1,413억 달러로 평가되었으며, 2035년까지 연평균 복합 성장률(CAGR) 6.2%로 성장하여 2,580억 달러에 이를 것으로 예측됩니다.
이 시장 성장은 지속 가능한 노력에 대한 규제 지원 강화, 친환경 제품에 대한 소비자 선호도 증가, 재사용 솔루션을 통한 장기적인 비용 절감, 전자상거래 확대, 포장 디자인의 지속적인 혁신에 의해 추진되고 있습니다. 재사용 가능한 포장의 채용을 촉구하는 규제는 주요 성장 요인이며, 기업은 플라스틱, 폐기물 및 탄소 배출에 관한 규제 준수를 점점 더 요구하고 있습니다. 업계 리더는 규제 준수가 환경 부하 감소뿐만 아니라 업무 효율성 향상, 브랜드 평가 향상, 업계 횡단 재사용 가능 포장의 보급 촉진으로 이어질 것이라고 인식하고 있습니다. 전자상거래의 대두는 수요를 더욱 가속화하고 있으며, 소비자와 규제당국이 온라인 소매 및 배송업무에서 지속가능한 포장 솔루션을 점점 요구하고 있는 가운데, 친환경 포장은 기업의 경쟁력에 있어서 중요한 요소가 되고 있습니다.
시장 범위
시작 연도
2025년
예측 연도
2026-2035년
시작 규모
1,413억 달러
예측 금액
2,580억 달러
CAGR
6.2%
플라스틱 부문은 범용성, 비용 효율성, 식품, 음료 및 소비재와 같은 업계의 적응성으로 인해 2025년 606억 달러에 달했습니다. 제조업체는 지속 가능한 포장 솔루션에 대한 수요 증가에 대응하기 위해 재활용 가능한 친환경 플라스틱 대체품 개발 및 생산 공정 최적화에 주력하고 있습니다.
팔레트 부문은 세계 무역 확대, 내구성 있는 재사용 가능 솔루션에 대한 수요, 물류, 소매 및 제조 분야의 지속가능성에 대한 노력 강화를 배경으로 2025년 381억 달러 시장 규모를 기록했습니다. 스마트 추적 기술과 비용 효율적인 설계와 같은 혁신은 확장되는 재사용 가능한 팔레트 수요를 충족시키는 데 중요한 요소입니다.
미국의 재사용 가능 포장 시장은 2025년 315억 달러 규모에 이르렀습니다. 미국 시장의 성장은 높은 환경 의식, 폐기물에 대한 규제 의무, 지속가능한 제품에 대한 소비자 수요, 업계를 통한 재사용가능한 솔루션의 광범위한 채용에 의해 견인되고 있습니다. 각 회사는 소비자의 기대에 부응하는 견고하고 환경 친화적인 포장재를 제공하면서 혁신적인 설계, 효율적인 생산 및 환경 규제 준수에 주력하고 있습니다.
목차
제1장 조사 방법과 범위
제2장 주요 요약
제3장 업계 인사이트
생태계 분석
공급자의 상황
이익률
비용 구조
각 단계에서의 부가가치
밸류체인에 영향을 주는 요인
혁신
업계에 미치는 영향요인
성장 요인
지속가능한 실천에 대한 규제 지원 강화
친환경 솔루션에 대한 소비자 수요 증가
재사용 가능한 선택에 의한 장기적인 비용 절감 효과
혁신적이고 재사용 가능한 포장 디자인 개발
전자상거래 및 온라인 소매 성장
업계의 잠재적 위험 및 과제
전환 기업에 대한 높은 초기 투자액
재사용 가능 포장에 대한 소비자의 저항감
시장 기회
소비자의 환경 의식 고조
재활용 기술의 진보
성장 가능성 분석
규제 상황
북미
유럽
아시아태평양
라틴아메리카
중동 및 아프리카
Porter's Five Forces 분석
PESTEL 분석
기술과 혁신 동향
현재의 기술 동향
신흥기술
신흥 비즈니스 모델
컴플라이언스 요건
지속가능성 대책
소비자 심리 분석
지정학적 및 무역 동향
제4장 경쟁 구도
소개
기업의 시장 점유율 분석
지역별
시장 집중도 분석
주요 기업의 경쟁 벤치마킹
재무실적 비교
수익
이익률
연구개발
제품 포트폴리오 비교
제품 라인의 폭
기술
혁신
지역별 사업 전개 비교
세계 전개 분석
서비스 네트워크 커버리지
지역별 시장 침투율
경쟁 포지셔닝 매트릭스
리더 기업
챌린저
팔로워
틈새 기업
전략적 전망 매트릭스
주요 발전, 2021-2024년
인수합병
제휴 및 협력 관계
기술적 진보
확대 및 투자 전략
지속가능성에 대한 노력
디지털 전환의 대처
신흥/스타트업 경쟁의 동향
제5장 시장 추계 및 예측 : 재료별, 2022-2035년
플라스틱
HDPE
PP
PET
LDPE
기타
금속
강철
알루미늄
유리
목재
제6장 시장 추계 및 예측 : 제품별, 2022-2035년
컨테이너
중간 벌크 컨테이너(IBC)
접이식 컨테이너
벌크 박스
크레이트
적재식 크레이트
접이식 크레이트
중첩식 크레이트
병
팔레트
플라스틱 팔레트
목제 팔레트
금속 팔레트
드럼 및 배럴
플라스틱 드럼캔
금속 드럼
기타
제7장 시장 추계 및 예측 : 최종 이용 산업별, 2022-2035년
식품 및 음료
신선식품
유제품
육류 및 수산물
음료
제빵 및 제과
기타
자동차
헬스케어
의약품
의료기기
병원용 공급망
물류 및 운송
기타
제8장 시장 추계 및 예측 : 지역별, 2022-2035년
북미
미국
캐나다
유럽
독일
영국
프랑스
스페인
이탈리아
네덜란드
아시아태평양
중국
인도
일본
호주
한국
라틴아메리카
브라질
멕시코
아르헨티나
중동 및 아프리카
사우디아라비아
남아프리카
아랍에미리트(UAE)
제9장 기업 프로파일
세계 주요 기업
Brambles
DS Smith
IFCO SYSTEMS
Greif
지역별 주요 기업
북미
Buckhorn Inc
IPL, Inc.
Menasha Corporation
Rehrig Pacific Company
유럽
GWP Group
Schoeller Allibert
Schutz GmbH & Co. KGaA
SSI SCHAEFER
아시아태평양
Nefab Group
Plasmix Private Ltd
디스럽터/틈새 기업
Kuehne Nagel
Packoorang AS
noissue
RePack
RPP Containers
Tri-Wall Limited
Myers Industries
JHS
영문 목차
영문목차
The Global Reusable Packaging Market was valued at USD 141.3 billion in 2025 and is estimated to grow at a CAGR of 6.2% to reach USD 258 billion by 2035.
The market growth is fueled by rising regulatory support for sustainable practices, increasing consumer preference for eco-friendly products, long-term cost savings from reusable solutions, the expansion of e-commerce, and continuous innovation in packaging designs. Regulations encouraging the adoption of reusable packaging are a key growth driver, with companies increasingly required to comply with restrictions on plastics, waste, and carbon emissions. Industry leaders recognize that compliance not only reduces environmental impact but also boosts operational efficiency, enhances brand reputation, and encourages wider adoption of reusable packaging across sectors. The rise of e-commerce is further accelerating demand, as consumers and regulators increasingly expect sustainable packaging solutions in online retail and delivery operations, making eco-conscious packaging a critical factor for business competitiveness.
Market Scope
Start Year
2025
Forecast Year
2026-2035
Start Value
$141.3 Billion
Forecast Value
$258 Billion
CAGR
6.2%
The plastic segment reached USD 60.6 billion in 2025, owing to its versatility, cost-effectiveness, and adaptability across industries such as food, beverage, and consumer goods. Manufacturers are focusing on developing recyclable, eco-friendly plastic alternatives and optimizing production processes to meet the growing need for sustainable packaging solutions.
The pallets segment generated USD 38.1 billion in 2025, driven by rising global trade, demand for durable reusable solutions, and increased sustainability initiatives in logistics, retail, and manufacturing. Innovations such as smart tracking technology and cost-efficient designs are key to meeting the expanding requirements for reusable pallets.
U.S. Reusable Packaging Market captured USD 31.5 billion in 2025. Growth in the U.S. is driven by strong environmental awareness, regulatory mandates on waste, consumer demand for sustainable products, and broad adoption of reusable solutions across industries. Companies are focusing on innovative designs, efficient production, and compliance with environmental regulations while delivering sturdy, eco-friendly packaging to meet consumer expectations.
Prominent companies operating in the Global Reusable Packaging Market include IFCO SYSTEMS, DS Smith, Tri-Wall Limited, RePack, Buckhorn Inc, Nefab Group, Greif, Brambles, Schutz GmbH & Co. KGaA, Packoorang AS, SSI SCHAEFER, RPP Containers, Plasmix Private Ltd, Rehrig Pacific Company, Myers Industries, GWP Group, Kuehne + Nagel, Menasha Corporation, noissue, and Schoeller Allibert. To strengthen their foothold, companies in the Reusable Packaging Market are adopting strategies such as continuous product innovation to enhance durability, eco-friendliness, and efficiency. Firms are integrating smart technologies like RFID and IoT tracking to optimize supply chain visibility and sustainability. Strategic partnerships with retailers, logistics providers, and e-commerce platforms expand market reach, while cost optimization and modular designs reduce operational expenses.
Table of Contents
Chapter 1 Methodology and scope
1.1 Market scope and definition
1.2 Research design
1.2.1 Research approach
1.2.2 Data collection methods
1.3 Data mining sources
1.3.1 Global
1.3.2 Regional/Country
1.4 Base estimates and calculations
1.4.1 Base year calculation
1.4.2 Key trends for market estimation
1.5 Primary research and validation
1.5.1 Primary sources
1.6 Forecast model
1.7 Research assumptions and limitations
Chapter 2 Executive Summary
2.1 Industry snapshot
2.2 Key market trends
2.2.1 Material trends
2.2.2 Product trends
2.2.3 End use industry trends
2.2.4 Regional trends
2.3 TAM analysis, 2025-2034 (USD Billion)
2.4 CXO perspectives: Strategic imperatives
2.4.1 Executive decision points
2.4.2 Critical success factors
2.5 Future outlook and strategic recommendations
Chapter 3 Industry Insights
3.1 Industry ecosystem analysis
3.1.1 Supplier landscape
3.1.2 Profit margin
3.1.3 Cost structure
3.1.4 Value addition at each stage
3.1.5 Factor affecting the value chain
3.1.6 Disruptions
3.2 Industry impact forces
3.2.1 Growth drivers
3.2.1.1 Increasing regulatory support for sustainable practices
3.2.1.2 Rising consumer demand for eco-friendly solutions
3.2.1.3 Long-term cost savings from reusable options
3.2.1.4 Development of innovative reusable packaging designs
3.2.1.5 Growth of E-commerce & online retail
3.2.2 Industry pitfalls & challenges
3.2.2.1 High initial investment for transitioning businesses
3.2.2.2 Consumer behavior resistance to reusable packaging
3.2.3 Market Opportunities
3.2.3.1 Rise in consumer environmental awareness
3.2.3.2 Advancements in recycling technologies
3.3 Growth potential analysis
3.4 Regulatory landscape
3.4.1 North America
3.4.2 Europe
3.4.3 Asia Pacific
3.4.4 Latin America
3.4.5 Middle East & Africa
3.5 Porter's analysis
3.6 PESTEL analysis
3.7 Technology and innovation landscape
3.7.1 Current technological trends
3.7.2 Emerging technologies
3.8 Emerging business models
3.9 Compliance requirements
3.10 Sustainability measures
3.11 Consumer sentiment analysis
3.12 Geopolitical and trade dynamics
Chapter 4 Competitive Landscape, 2024
4.1 Introduction
4.2 Company market share analysis
4.2.1 By region
4.2.1.1 North America
4.2.1.2 Europe
4.2.1.3 Asia Pacific
4.2.1.4 Latin America
4.2.1.5 MEA
4.2.2 Market Concentration Analysis
4.3 Competitive Benchmarking of key Players
4.3.1 Financial Performance Comparison
4.3.1.1 Revenue
4.3.1.2 Profit Margin
4.3.1.3 R&D
4.3.2 Product Portfolio Comparison
4.3.2.1 Product Range Breadth
4.3.2.2 Technology
4.3.2.3 Innovation
4.3.3 Geographic Presence Comparison
4.3.3.1 Global Footprint Analysis
4.3.3.2 Service Network Coverage
4.3.3.3 Market Penetration by Region
4.3.4 Competitive Positioning Matrix
4.3.4.1 Leaders
4.3.4.2 Challengers
4.3.4.3 Followers
4.3.4.4 Niche Players
4.3.5 Strategic outlook matrix
4.4 Key developments, 2021-2024
4.4.1 Mergers and Acquisitions
4.4.2 Partnerships and Collaborations
4.4.3 Technological Advancements
4.4.4 Expansion and Investment Strategies
4.4.5 Sustainability Initiatives
4.4.6 Digital Transformation Initiatives
4.5 Emerging/ Startup Competitors Landscape
Chapter 5 Market Estimates and Forecast, By Material, 2022 - 2035 (USD Billion)
5.1 Key trends
5.2 Plastic
5.2.1 HDPE
5.2.2 PP
5.2.3 PET
5.2.4 LDPE
5.2.5 Others
5.3 Metal
5.3.1 Steel
5.3.2 Aluminum
5.4 Glass
5.5 Wood
Chapter 6 Market Estimates and Forecast, By Product, 2022 - 2035 (USD Billion)
6.1 Key trends
6.2 Containers
6.2.1 Intermediate bulk containers (IBCs)
6.2.2 Foldable/collapsible containers
6.2.3 Bulk boxes
6.3 Crates
6.3.1 Stackable crates
6.3.2 Foldable crates
6.3.3 Nestable crates
6.4 Bottles
6.5 Pallets
6.5.1 Plastic pallets
6.5.2 Wooden pallets
6.5.3 Metal pallets
6.6 Drums & barrels
6.6.1 Plastic drums
6.6.2 Metal drums
6.7 Others
Chapter 7 Market Estimates and Forecast, By End Use Industry, 2022 - 2035 (USD Billion)
7.1 Key trends
7.2 Food & beverages
7.2.1 Fresh produce
7.2.2 Dairy
7.2.3 Meat & seafood
7.2.4 Beverages
7.2.5 Bakery & confectionery
7.2.6 Others
7.3 Automotive
7.4 Healthcare
7.4.1 Pharmaceuticals
7.4.2 Medical devices
7.4.3 Hospital supply chains
7.5 Logistics & transportation
7.6 Others
Chapter 8 Market Estimates and Forecast, By Region, 2022 - 2035 (USD Billion)