


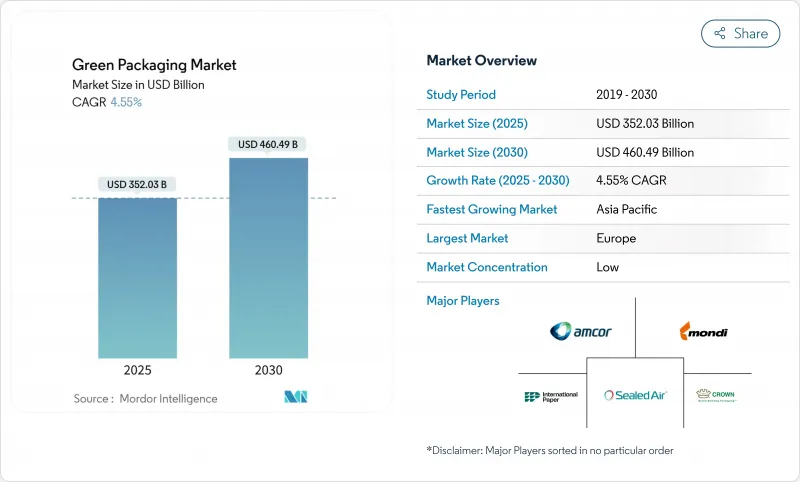
그린 포장 시장 규모는 2025년에 3,520억 3,000만 달러로, 2030년에는 4,604억 9,000만 달러에 이르고, CAGR 4.55%를 나타낼 것으로 예측되고 있습니다.
이 꾸준한 성장은 유럽 연합의 PPWR과 같은 구속력있는 규제, 기업의 넷 제로 포장 목표, 재활용 원료에 의한 비용 절감 등의 힘이 수렴한 결과입니다.

유럽은 2030년까지 완전한 재활용 의무화, 디지털 추적성 의무화, 단계적 재활용 비율 할당 등 정책의 엄격함을 이끌고 있습니다. 아시아태평양은 인도, 한국, 일본이 소비 확대와 일회용 플라스틱 금지를 가속화하고 있기 때문에 수요 증가가 가장 빠릅니다. 기업 수준에서는 Smurfit Kappa와 WestRock의 합병과 Novolex와 Pactiv Evergreen의 합병 등 세계 규모가 컴플라이언스, 연구 개발, 멀티 머티리얼의 능력을 지원하고 있습니다. 기술의 획기적인 진보, 특히 디지털 전자 워터마크와 첨단 고분자 화학은 폐쇄 루프 재활용에서 이전의 품질과 속도 제약을 제거합니다.
유럽 연합(EU), 인도, 칠레에서 가속화된 정책 개발은 기존의 고분자를 크게 제한하여 퇴비화 가능한 필름과 재활용률이 높은 PET로의 즉각적인 전환을 촉진합니다. 러시아에서는 2025년 9월에 특정 품목의 PET가 금지되었으며 EU에서는 식품접촉포장에 있어서 비스페놀A가 전면적으로 금지되었습니다. 인도의 규칙에서는 2025년에 음료용 병에 소비자 사용 후의 재생재를 30% 사용하게 되고, 칠레에서는 2060년까지 70% 사용하게 되므로, 기술 혁신의 사이클이 단축되어, CAPEX가 해초 베이스나 PHA 블렌드에 돌이켜지게 됩니다. 한국의 마린 혁신은 이러한 규칙이 해양 바이오매스 기재의 특허를 보유한 신흥기업을 육성하고 시장 투입 가능성을 증명하고 있음을 보여줍니다. 캘리포니아의 확장 생산자 책임 제도는 재사용의 의무를 거듭하고 재료 대체를 브랜딩이 아닌 경쟁적 필요로 바꾸고 있습니다.
브랜드 소유자는 현재 지속가능성의 미사구를 규제 하한을 초과하는 주문으로 대체하고 있습니다. 볼사는 2030년까지 재활용률 85%를 달성했으며, 세계의 알루미늄 사이클률 90%를 목표로 하고 있습니다. 유니레버는 2025년까지 100% 재활용 가능, 재사용 가능 또는 퇴비화 가능한 형태를 달성한다는 2024년 5월 서약은 설계 변경과 절대적인 재료 감소 목표를 결합하여 공급업체에 대한 압력을 증폭시켰습니다. 로레알은 7,200만 유로의 펀드를 설립하고 재활용 가능한 신흥 기업을 지원하고 있지만, 회사는 지금까지 49%의 재활용률만 달성했습니다. 세븐앤아이홀딩스의 'GREEN CHALLENGE 2050'은 2030년까지 지속 가능한 원료를 50% 사용하는 것을 목표로 하고 있으며, PHA와 바이오 PE의 전용 생산 라인을 정당화하기 위해 여러 국가와의 오프테이크 계약을 맺고 있습니다. 이러한 다국적 기업이 기준선 사양을 정한 경우, Tier 2 공급업체는 승인 벤더 목록에 남아 있기 때문에 이를 준수해야 합니다.
PLA, PHA, 전분 유도체는 음식과 바이오연료 수요와 경쟁하는 농업 투입물에 의존합니다. SK케미칼스와 네이처웍스는 수지의 가격 설정을 좌우하는 옥수수와 설탕의 가격 변동에 직면하고 있으며, 상품 상승 시 바이오폴리머의 경쟁력이 저하됩니다. 북미와 유럽의 한정된 발효·정제 설비가 병목이 되어, 스폿적인 공급 부족을 초래해, 컨버터는 이중 공급이나 재생 PET에의 전환을 강요받게 됩니다. 대규모 생산 능력 증대에는 감가상각이 10년에 이르는 수억 달러의 플랜트가 필요하며, 수요 급증에 대한 신속한 대응을 방해합니다. 수확주기가 연간 처리량을 형성하기 때문에 계절성이 위험을 높이고 재고와 현금 흐름 관리를 복잡하게 만듭니다.
재활용 컨텐츠 솔루션은 종이, 금속, 유리, PET의 성숙한 회수 시스템에 의해 지원되며 2024년 그린 포장 시장의 60.35%를 차지했습니다. 분해 가능한 포장 형태는 현재 소규모이지만 CAGR 7.94%를 나타내, 있어 일회용 플라스틱의 금지가 가까이 다가오고 있기 때문에 혜택을 받고 있습니다. 현재의 그린 포장 시장은 재활용이 즉각적인 비용 이점을 제공하는 반면, 분해 가능한 것은 미래에 사용 된 플라스틱의 사용 규제가 엄격해지더라도 대응할 수 있기 때문에 두 흐름에 대한 투자를 지원합니다. FMCG의 주요 채용 기업은 병에서 병까지의 루프로 재생 PET를 선택하고 QSR 체인은 해양 환경에서 분해하는 해초 기반 빨대를 시험적으로 사용합니다. 산업계에서는 재사용 가능한 드럼통과 나무 상자를 활용함으로써 장수명과 소재의 순환성이 하나의 그린 포장 시장 아키텍처 안에서 공존할 수 있음을 실증하고 있습니다.
리필 로지스틱스의 신흥 기업은 IoT 태그가 달린 컨테이너를 도입하고 30회 사용을 거친 후 재사용함으로써 고밀도 도시 회랑의 총 비용을 낮추고 있습니다. 재사용 가능한 시스템의 그린 포장 시장 규모는 독일의 PFAND 방식과 같은 대량 소매 노력과 함께 상승할 것으로 예측됩니다. 이와 병행하여 Loop사와 Pa(fyll)사는 예금 및 리턴 모델을 미용 분야와 가정 분야로 확대하여 소비자의 편의성이 순환 의무에 부합하는 것을 증명하고 있습니다. 재활용 가능, 분해 가능, 재사용 가능한 디자인의 상호작용은 수익 풀의 다양화와 동시에 원료 충격에 대한 위험 회피를 생성합니다.
재활용 가능한 PET, HDPE, PP가 2024년 수익의 68.24%를 차지한 것은 폭넓은 커브사이드 적용 범위와 음료 선수들의 병급 rPET 수요 덕분입니다. 인도라마와 이스트만이 발표한 기계적 재활용 및 화학적 재활용의 확대는 EU의 재활용 함유 기준치를 달성하는데 필요한 원료를 공급합니다. 그러나 PLA와 PHA는 정책 금지, 기업 조종사 및 냉동고 등급의 장벽 특성을 실현하는 새로운 혼합으로 CAGR 8.45%를 나타낼 전망입니다. 종이 및 판지는 유지 및 물을 비롯한 나노셀룰로오스 코팅으로 점유율을 회복하고 퀵서비스 레스토랑에 불소계 화학물질을 대체하는 옵션을 제공합니다. 첨단 섬유 기재의 그린 포장 시장 규모는 치수 품질이 선반에 진열할 때 시각적 어필을 능가하는 전자상거래 채널에서 가장 빠르게 확대될 것으로 예측됩니다.
유리와 금속의 무한한 재활용 가능성은 브랜드 주식이 무게 페널티를 상쇄하는 프리미엄 음료와 화장품에서 틈새 포지션을 확보하고 있습니다. 알루미늄은 Ball Corporation의 재활용 함량 85%라는 목표가 계약 수요를 보장하기 때문에 동향이 상승합니다. 반대로, 다층 라미네이트는 해체 비용이 재활용 가치를 초과하기 때문에 점유율을 잃고 브랜드 소유자는 단일 소재 PE 및 PP 솔루션으로 전환합니다. 따라서 재료 대체를 결정하려면 그린 포장 시장의 각 응용 분야에서 기능성, 비용 및 규정 준수의 균형을 맞추어야합니다.
그린 포장 시장 보고서는 포장 유형(재활용 컨텐츠 포장, 재사용 가능 포장, 분해 가능한 포장), 소재(종이 및 판지, 유리 등), 포장 기능(1차, 2차, 기타), 최종 사용자 산업(식품, 음료 및 기타), 지역(북미, 유럽, 아시아태평양, 남미, 중동 및 아프리카)으로 구분됩니다.
유럽은 2030년까지 완전 재활용 가능성과 재활용 플라스틱 함량 30%를 의무화하는 PPWR 의무에 힘입어 2024년에는 36.54%의 점유율을 유지했습니다. 독일의 보증금 반환율은 98%를 넘어 병에서 병으로의 루프를 위한 고품질 PET를 확보하고 프랑스의 2025년 재이용법은 리필 인프라를 가속화합니다. 북유럽의 혁신적인 기업은 섬유 기반 장벽과 전자 워터마크를 도입하고 이 지역의 정교한 소매 네트워크의 기능적 벤치마크를 설정합니다. 하지만 국경을 넘어선 복잡한 컴플라이언스는 27개의 사법 관할구에 걸쳐 라벨 표시, 재활용 함량, 보고 기준을 정합시켜야 하는 중소기업의 부담이 되고 있습니다.
아시아태평양은 인구 밀도와 도시 지역의 소비가 급증함에 따라 2030년까지 연평균 복합 성장률(CAGR)이 가장 빠른 8.32%를 나타낼 전망입니다. 인도의 포장 부문은 2025년까지 2,048억 1,000만 달러를 목표로, QR 코드에 의한 추적성을 강화하여 비공식 재활용을 억제합니다. 일본의 고급 브랜드는 화장품 병에 바이오 PET를 채용하고, 한국은 식품 폐기물의 분별율 90% 초과를 기록해, 퇴비화 가능한 포장의 사용한 처리를 가능하게 하고 있습니다. 중국의 수출 지향 컨버터는 시장 접근을 유지하기 위해 EU에 대한 적합성을 추진하고 있으며 지역 공급 기지를 통해 더 엄격한 사양을 체인화하고 있습니다. 그러나 급속히 보급이 진행되면 바이오 수지 공급이 가까워지고 태국과 인도네시아에서는 PLA의 생산 능력을 현지화하기 위한 합작 사업이 육성되고 있습니다.
북미의 기세는 거리입니다. 캘리포니아의 EPR 규칙은 2030년까지 50%의 재활용 가능 또는 재사용 가능한 설계를 의무화하고 대형 소매점에서 리필 조종사를 장려합니다. 캐나다의 플라스틱 협정(Plastics Pact)은 50% 재활용 설계를 달성했지만 하류 선별 인프라에는 여전히 고전하고 있습니다. 한편, 노볼렉스와 Pactiv Evergreen과 같은 합병은 다른 주법에 대응하는 규모의 이점을 제공합니다. 멕시코가 미국공급망에 통합됨에 따라 재활용 종이 공장에 대한 투자가 활발해지고 비용과 지속가능성의 양립이 요구되고 있습니다. 이러한 역학을 통해 멕시코 대륙은 규제, 소비자 심리, 인프라가 교차하는 장소에 리더적 존재가 모여 선택적으로 전진할 수 있습니다.
The green packaging market size stood at USD 352.03 billion in 2025 and is forecast to reach USD 460.49 billion by 2030, expanding at a 4.55% CAGR.This steady growth results from converging forces: binding regulations such as the European Union's PPWR, corporate net-zero packaging targets, and cost reduction from recycled feedstocks.
Europe leads in policy stringency, mandating full recyclability by 2030, compulsory digital traceability, and step-wise recycled-content quotas. Asia-Pacific delivers the fastest incremental demand as India, South Korea, and Japan combine expanding consumption with escalating bans on single-use plastics. At the company level, megamergers such as Smurfit Kappa-WestRock and Novolex-Pactiv Evergreen signal that global scale now underpins compliance, R&D, and multi-material capabilities. Technology breakthroughs-particularly digital watermarking and advanced polymer chemistry-remove earlier quality and speed constraints in closed-loop recycling.
Accelerated policy roll-outs across the European Union, India, and Chile sharply limit legacy polymers and stimulate immediate switches to compostable films and high-recycled-content PET. Russia's September 2025 prohibition on specific PET items and the EU's blanket ban on Bisphenol A in food contact packaging wipe out entire material categories, forcing converters to fast-track biopolymer commercialisation. Indian rules introduce 30% post-consumer recycled content for beverage bottles in 2025, while Chile pushes the requirement to 70% by 2060, compressing innovation cycles and redirecting CAPEX toward seaweed-based and PHA blends. South Korea's Marine Innovation illustrates how these rules nurture startups that hold patents for ocean-biomass substrates, proving market-ready viability. California's extended producer responsibility regime layers on reuse mandates, turning material substitution into a competitive necessity rather than a branding exercise.
Brand owners now translate sustainability rhetoric into purchase orders that exceed regulatory floors. Ball Corporation is moving to 85% recycled content by 2030 and targets a 90% global aluminum recycling rate, effectively guaranteeing demand for secondary smelter output. Unilever's May 2024 pledge to achieve 100% recyclable, reusable, or compostable formats by 2025 combines design changes with absolute material reduction targets, amplifying pressure on suppliers. L'Oreal's EUR 72 million fund backs recycling start-ups despite the company only hitting 49% recyclability so far, indicating that capital is migrating toward scalable solutions rather than incremental tweaks. Seven & i Holdings' GREEN CHALLENGE 2050 specifies 50% sustainable inputs by 2030, anchoring multi-country offtake agreements that justify dedicated production lines for PHA or bio-PE. Once these multinationals set baseline specifications, tier-2 suppliers must comply to remain on approved vendor lists.
PLA, PHA, and starch derivatives hinge on agricultural inputs that compete with food and biofuel demand. SK Chemicals and NatureWorks face corn and sugar price volatility that dictates resin pricing, making biopolymers less competitive during commodity spikes. Limited fermentation and purification assets in North America and Europe create bottlenecks that lead to spot shortages, forcing converters to dual-source or revert to recycled PET. Large-scale capacity additions require multi-hundred-million-dollar plants with decade-long depreciation, dampening rapid response to demand surges. Seasonality compounds risk as harvest cycles shape annual throughput, complicating inventory and cash-flow management.
Other drivers and restraints analyzed in the detailed report include:
For complete list of drivers and restraints, kindly check the Table Of Contents.
Recycled-content solutions retained 60.35% of the green packaging market in 2024, supported by mature collection systems for paper, metal, glass, and PET. Degradable formats, while smaller now, are pacing a 7.94% CAGR and benefit from imminent bans on single-use plastics. The current green packaging market supports investment in both streams because recycling delivers immediate cost advantages whereas degradables future-proof against stricter end-of-life rules. Primary adopters in FMCG select recycled PET for bottle-to-bottle loops, while QSR chains pilot seaweed-based straws that degrade in marine settings. Industrial players leverage reusable drums and crates, demonstrating that longevity and material circularity can coexist within a single green packaging market architecture.
Start-ups in refill logistics deploy IoT-tagged containers that cycle through 30 uses before refurbishment, driving total cost downward across high-density urban corridors. The green packaging market size for reusable systems is projected to climb alongside mass-retail initiatives such as Germany's PFAND scheme. In parallel, Loop and Pa(fyll) extend deposit-and-return models into beauty and household segments, evidence that consumer convenience can align with circularity mandates. Collectively, the interplay of recycled, degradable, and reusable designs diversifies revenue pools while creating hedges against raw-material shocks.
Recyclable PET, HDPE, and PP combine for 68.24% of 2024 revenue thanks to wide curbside coverage and bottle-grade rPET demand from beverage majors. Mechanical and chemical recycling expansions announced by Indorama and Eastman supply the feedstock required to reach EU recycled-content thresholds. However, PLA and PHA post an 8.45% CAGR, leveraged by policy bans, corporate pilots, and new blends that achieve freezer-grade barrier properties. Paper and paperboard regain share via nano-cellulose coatings that repel grease and water, giving quick-service restaurants an alternative to fluorinated chemistries. The green packaging market size for advanced fibre substrates is projected to expand fastest in e-commerce channels where dimensional quality outranks visual shelf appeal.
Glass and metal's infinite recyclability secures niche positions in premium beverages and cosmetics where brand equity offsets weight penalties. Aluminum trends up as Ball Corporation's 85% recycled-content target guarantees contracted demand. Conversely, multilayer laminates lose share because disassembly costs outweigh recycling value, propelling brand owners to mono-material PE or PP solutions. Material substitution decisions thus hinge on balancing functionality, cost, and compliance within each green packaging market application.
The Green Packaging Market Report is Segmented by Packaging Type (Recycled Content Packaging, Reusable Packaging, Degradable Packaging), Material (Paper and Paperboard, Glass and More), Packaging Function (Primary, Secondary, and More), End User Industry (Food, Beverage, and More), and Geography (North America, Europe, Asia-Pacific, South America, Middle East and Africa).
Europe maintained a 36.54% share in 2024, propelled by the PPWR mandate that compels full recyclability by 2030 and 30% recycled plastic content. Germany's deposit return rate surpasses 98%, ensuring high-quality PET for bottle-to-bottle loops, while France's 2025 reuse legislation accelerates refill infrastructure. Nordic innovators deploy fibre-based barriers and digital watermarks, setting functional benchmarks for the region's sophisticated retail networks. Complex cross-border compliance, however, burdens SMEs that must align labelling, recycled-content, and reporting standards across 27 jurisdictions.
Asia-Pacific delivers the fastest 8.32% CAGR through 2030 as population density and urban consumption surge. India's packaging sector aims for USD 204.81 billion by 2025 and enforces QR-code traceability to curb informal recycling practices. Japan's premium brands adopt bio-PET in cosmetic bottles, while South Korea records over 90% food-waste separation, enabling compostable packaging end-of-life processing. China's export-oriented converters move to meet EU compliance so they can retain market access, cascading stricter specifications through regional supply bases. Rapid uptake, though, strains bio-resin supply, fostering joint ventures in Thailand and Indonesia to localise PLA capacity.
North America shows mixed momentum. California's EPR rules mandate 50% recyclable or reusable design by 2030 and incentivise refill pilots from big-box retailers. Canada's Plastics Pact reaches 50% design-for-recycling but still struggles with downstream sorting infrastructure. Meanwhile, mergers such as Novolex-Pactiv Evergreen embed scale advantages in navigating disparate state laws. Mexico's integration into US supply chains draws investment in recycled-paper mills, aligning cost and sustainability imperatives. These dynamics position the continent to advance selectively, with leadership pockets clustered where regulation, consumer sentiment, and infrastructure intersect.