


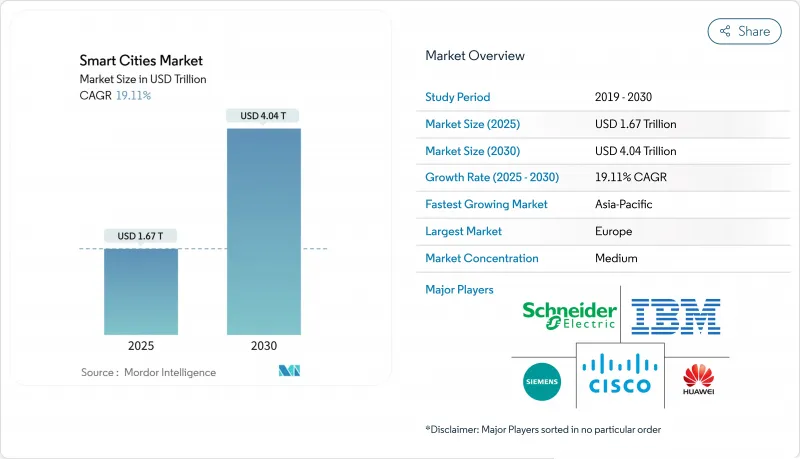
스마트 시티 시장은 2025년에는 1조 6,700억 달러에 달하고, 2030년에는 4조 400억 달러에 이를 전망입니다.

정부의 강력한 자극책, 특히 미국의 인프라 투자·고용법과 아시아태평양의 도시 디지털화에 대한 연간 1,580억 달러의 할당이 모빌리티, 유틸리티, 안전, 시민 서비스 영역을 통합하는 통합 플랫폼에 대한 수요를 지지하고 있습니다. 사물인터넷(IoT) 네트워크에 내장된 인공지능엔진은 지자체의 구매주기를 최단 8개월로 단축하고, 시험적 프로그램의 가치 실현까지의 시간을 단축함과 동시에 건설 전에 성과를 검증하는 디지털 트윈을 통해 단계적인 확대를 가능하게 하고 있습니다. 2025년 1월에 발표된 5,000억 달러의 Stargate AI 인프라에 이어, 지멘스와 같은 인프라 선두는 마이크로소프트와 Oracle과 같은 클라우드 하이퍼스케일러에 직면해 경쟁 역학이 치열해지고 있습니다. 하드웨어가 가장 큰 비용 블록을 차지하는 것은 아니지만 도시 리더가 단편적인 장비 구매보다 턴키 통합 및 관리 보안 계약을 선호하기 때문에 서비스가 급속히 확대되고 있습니다.
인프라 관련 법안은 공급업체에 안정적인 수입원을 제공합니다. 인프라 투자·고용 촉진법(Infrastructure Investment and Jobs Act)에서는 스마트 커뮤니티 기술에 2026년까지 매년 1억 달러의 예산을 계상하고 있으며, 최초의 모집에서는 392개의 지자체로부터 평균 154만 달러의 응모가 있었습니다. 최신 디지털 시스템은 자산의 수명을 30%까지 연장할 수 있으며, 스마트 플랫폼은 비용이 많이 드는 콘크리트 재건축을 대체할 수 있게 된다고 국가 엔지니어링 기관은 추정하고 있습니다. 라스베가스와 같은 도시에서는 IoT 네트워크에서 작동하는 적응형 교통 신호로 연간 100만 달러를 절약할 수 있습니다. 미국 에너지부의 2024년도 예산은 519억 9,000만 달러로 송전망의 근대화와 청정에너지 노동력 프로그램에 중점을 두어 도시 수준의 투자 능력을 강화했습니다. 다방면에 걸친 자금 제공은 이동성, 에너지, 안전성 등 인접 프로젝트에 대한 선행 장벽을 줄이고 민간 자본을 불러옵니다.
국가 IoT 전략은 단편화를 없애고 분야 횡단 채택을 가속화하기 위해 통일 표준을 권장합니다. 싱가포르의 고도 도로 교통 시스템(ITS)은 실시간 분석을 기반으로 적응 신호 제어를 통해 이미 정체를 35% 줄였습니다. 엣지 컴퓨팅 노드는 센서 데이터를 로컬로 처리하고 스마트 엔드포인트 설치 기반이 2030년까지 5,000억 대로 향하는 동안 백홀 제한을 완화하고 있습니다. 5G-Advanced 커넥티비티와 AIoT 용도를 결합하면 자율 주행 셔틀과 예지 보전에 필수적인 밀리초 이하의 응답 시간이 가능합니다. 이러한 기능은 하나의 데이터 패브릭을 통해 교통, 유틸리티 및 긴급 서비스를 상호 연결하는 종합적인 도시 플랫폼을 홍보합니다.
레거시 빌딩을 스마트 대응으로 하는 경우, 특히 집합 주택에 차량 충전 인프라를 추가하는 경우, 자본 지출은 신축에 비해 15-25% 팽창합니다. 학술 연구는 "5R" 복고풍의 틀에 대해 논의합니다. 즉 재거주, 재건축, 재운송, 재자본화, 재녹화 등으로 여러 자산 클래스에 비용을 분산시키지만 지자체의 예산 편성을 복잡하게 합니다. 반도체 부족으로 인해 2024년 이후 IoT 부품 가격이 약 30% 상승했습니다. 이러한 추세는 지정학적 위험과 기후 변화 위험을 강조하는 연방 정부공급망 검토에 의해 확인되었습니다. 메인 주의 제지 공장 철거지와 같은 브라운필드를 첨단 재료 공장에 재사용하는 것은 비용 절감 가능성을 보여주지만 통합 작업에는 많은 도시의 IT 팀이 부족한 고급 전문 지식이 여전히 필요합니다. 단편적인 조달을 시도한 프로젝트에서는 예기치 않은 상호 운용성 문제로 인해 40-60%의 오버런이 보고되었습니다.
스마트 이동성 관리는 2024년 매출의 18.2%를 차지했으며, 스마트 시티 시장에서 가장 큰 단일 솔루션 분야가 되었습니다. 예를 들어, 싱가포르의 적응형 신호 네트워크는 이동 시간을 단축하고 데이터 중심 혼잡 관리의 수출 가능한 모범 사례를 지원합니다. 유틸리티와 관련된 스마트 시티 시장 규모는 유럽의 에너지 긍정적인 지구 구상과 북미의 마이크로그리드 시험 운용의 대두에 의해 CAGR 19.2%로 가장 급성장할 것으로 예측됩니다. 스마트 세이프티, 빌딩 자동화, 건강 관리는 당국이 AI 비디오, HVAC 최적화 및 원격 의료를 통합 명령 플랫폼에 통합하여 안정적인 배포를 획득했습니다.
모빌리티 데이터는 에너지 수요 예측에 활용되며 공공 안전 센서는 환경 모니터로도 작동합니다. 블록체인에서 검증된 ID를 실험적으로 도입한 도시는 부처 간 협업 대기 시간을 단축하고 통합 데이터 패브릭 채택을 강화하고 있습니다. 환경 모니터링과 폐기물 수집 툴의 성장은 완만하지만, 폐기물 제로의 의무화와 순환형 경제 정책에 의해 10년 후까지 다시 관심이 높아질 것으로 예측됩니다.
하드웨어는 2024년 지출액의 42.5%를 차지하며 센서, 게이트웨이, 엣지 컴퓨팅 등 도시형 IoT의 기반을 반영했습니다. 그러나 복잡한 배포의 위험을 줄이기 위해 시장이 턴키 통합을 요구하기 때문에 서비스는 CAGR 19.7%를 나타낼 전망입니다. 사이버 평가, 데이터 거버넌스, 관리된 클라우드 운영이 양보할 수 없는 항목이 됨에 따라 서비스에 기울어지는 스마트 시티 시장 점유율이 확대될 것으로 보입니다.
공급망의 변동은 부품 비용을 계속 증가시키고 공급업체가 다양한 계약에서 하드웨어를 상각하는 구독 모델을 강화합니다. 예측 분석과 디지털 트윈을 실행하는 소프트웨어 플랫폼은 안정적인 수요를 유지하지만 차별화는 범용 대시보드가 아니라 수직 전문 지식과 개방형 API 툴킷으로 이동합니다. 조명, 이동성, 그리드 프로토콜의 상호 운용성을 증명할 수 있는 벤더는 프리미엄 가격을 이깁니다.
아시아태평양은 2024년 매출의 31.7%를 차지했고, 2030년까지 연평균 복합 성장률(CAGR)은 20.3%로 선두를 유지할 것으로 예상됩니다. 중국은 800 가까운 파일럿 시티를 지원하고 인도는 미국, 일본, 한국의 3개국에서 자금을 조달하고 있기 때문입니다. 일본의 Society 5.0 정책은 로봇 공학과 AI를 지역 활성화 계획에 통합하고 소매업체와 같은 간접 수혜자가 이동성 서비스 자금을 지원하는 비용 분담 계획을 사용합니다. 아시아 스마트 시티 회의에서는 경제 성장과 탈탄소화를 양립시키는 제로카본항만과 수소회랑을 향한 지역의 축족이 강조되었습니다.
북미에서는 연간 1억 달러의 연방 보조금과 적극적인 민간 5G 구축을 배경으로 프로젝트 확대가 계속되고 있습니다. 역주를 90% 줄인 라스베가스의 데이터 주도형 단속 이니셔티브는 성과 기반 조달에 관한 북미의 참고 사례가 되고 있습니다. 스타게이트 펀드는 기술 스택을 심화시키고 10만 명의 신규 고용과 AI를 많이 사용하는 지자체의 워크로드에 대한 엄청난 계산 능력을 약속합니다.
유럽에서는 지속가능성을 최전선에 위치시키고 에너지잉여목표와 엄격한 개인정보보호법을 연결시키는 EU프로그램 아래 2025년까지 100개의 긍정 에너지지구를 목표로 하고 있습니다. Syn.ikia의 파일럿 테스트는 디지털 트윈 주도 설계로 40-60%의 효율 향상을 달성할 수 있음을 확인했습니다. 패트리지아(PATRIZIA)의 140억 유로의 스마트 시티 펀드와 같은 민간 자본의 헌신은 녹색 개조와 도시 서비스 플랫폼의 장기적인 현금 흐름에 대한 투자자의 신뢰를 증명합니다. 중동에서는 자율주행 모빌리티와 전자정부를 중시한 프로그램이 진행되고 있으며, 두바이는 2030년까지 25%의 자동운전을 통한 이동을 목표로 하고 있습니다. 아프리카와 남미에는 새로운 비즈니스 기회가 있지만 재정적 제약과 기술 부족이 도입 속도를 억제하고 있습니다.
The smart cities market stood at USD 1.67 trillion in 2025 and is on course to reach USD 4.04 trillion by 2030, reflecting a 19.11% CAGR over the forecast window.
Robust government stimulus, especially the U.S. Infrastructure Investment and Jobs Act and annual Asia-Pacific allocations of USD 158 billion for urban digitization, is anchoring demand for integrated platforms that unite mobility, utilities, safety and citizen-service domains. Artificial-intelligence engines embedded in Internet-of-Things (IoT) networks have condensed municipal buying cycles to as little as eight months, accelerating time-to-value for pilot programs and enabling incremental scaling through digital twins that verify outcomes before construction. Competitive dynamics intensify as infrastructure stalwarts such as Siemens face cloud hyperscalers such as Microsoft and Oracle, following January 2025's USD 500 billion Stargate AI infrastructure announcement that signaled a multi-year race to supply compute, connectivity and applications for next-generation cities. Hardware still accounts for the largest cost block, but services are expanding faster as city leaders prefer turnkey integration and managed security contracts over piecemeal equipment purchases.
Infrastructure legislation is unlocking steady revenue streams for vendors. The Infrastructure Investment and Jobs Act budgets USD 100 million per year through 2026 for smart community technologies, with the first call attracting 392 municipal applications that averaged USD 1.54 million each. National engineering bodies estimate that modern digital systems can stretch asset life by as much as 30%, turning smart platforms into viable substitutes for costly concrete rebuilds. Cities like Las Vegas validated the model, saving USD 1 million annually via adaptive traffic signals that run on IoT networks. The U.S. Department of Energy's USD 51.99 billion FY 2024 budget earmarks grid modernization and clean-energy workforce programs, reinforcing city-level investment capacity. Collectively, multilevel funding reduces upfront barriers and crowds in private capital for adjacent projects across mobility, energy, and safety.
National IoT strategies recommend uniform standards to fight fragmentation and accelerate cross-sector adoption. Singapore's Intelligent Transport System already cuts congestion by 35% through adaptive signal control informed by real-time analytics. Edge-computing nodes process sensor data locally, alleviating backhaul limits as the installed base of smart endpoints heads toward 500 billion by 2030. Marrying 5 G-Advanced connectivity with AIoT applications permits sub-millisecond response times essential for autonomous shuttles and predictive maintenance. These capabilities encourage holistic city platforms that interlink transport, utilities, and emergency services through one data fabric.
Bringing legacy buildings up to smart readiness inflates capital outlays by 15-25% versus new construction, particularly when adding vehicle-charging infrastructure to multi-family units. Academic studies discuss a "5R" retrofit framework: re-inhabitation, rebuilding, re-transportation, re-capitalisation, and re-greening that spreads costs across multiple asset classes but complicates municipal budgeting. Semiconductor shortages have raised IoT component prices by roughly 30% since 2024, a trend confirmed by federal supply-chain reviews highlighting geopolitical and climate-related risks. Repurposing brownfield sites such as a former Maine paper mill into advanced-materials plants shows cost-saving potential, yet integration tasks still demand premium expertise that many city IT teams lack. Projects that attempted piecemeal procurement report 40-60% overruns due to unforeseen interoperability issues.
Other drivers and restraints analyzed in the detailed report include:
For complete list of drivers and restraints, kindly check the Table Of Contents.
Smart mobility management secured 18.2% of 2024 revenue, making it the largest single solution line in the smart cities market. Singapore's adaptive-signal network, for example, has cut travel times and underpinned exportable best practices for data-driven congestion management. The smart cities market size associated with utilities is projected to grow fastest at a 19.2% CAGR due to energy-positive district ambitions in Europe and emerging microgrid pilots in North America. Smart safety, building automation and healthcare capture steady allocations as authorities integrate AI-video, HVAC optimisation and telehealth into consolidated command platforms.
Integration across solutions is rising: mobility data feeds energy demand forecasting, while public-safety sensors double as environmental monitors. Cities experimenting with blockchain-validated identities reduce latency in inter-agency collaboration, bolstering adoption of unified data fabrics. Although environmental monitoring and waste-collection tools grow more slowly, zero-waste mandates and circular-economy policies promise renewed interest by the decade's end.
Hardware retained 42.5% of 2024 spending, reflecting the sensor, gateway, and edge-compute foundation of any urban IoT installation. Yet services are advancing at a 19.7% CAGR as mayors seek turnkey integration to de-risk complex rollouts. The smart cities market share tilted toward services will widen as cyber assessments, data governance, and managed cloud operations become non-negotiable line items.
Supply-chain volatility continues to lift component costs, reinforcing subscription models where vendors amortise hardware over multi-year contracts. Software platforms that run predictive analytics and digital twins sustain steady demand, but differentiation shifts to vertical expertise and open-API toolkits rather than generic dashboards. Vendors able to certify interoperability across lighting, mobility, and grid protocols win premium pricing.
Smart City Market Report is Segmented by Solution (Smart Mobility Management, Smart Public Safety, and More), Component (Hardware, Software, and Services), Deployment Model (Cloud and On-Premises), End-User (Government and Municipal, Residential, and More), and by Geography. The Market Forecasts are Provided in Terms of Value (USD).
Asia-Pacific contributed 31.7% of 2024 revenue and will keep the lead with a 20.3% CAGR through 2030, as China supports nearly 800 pilot cities and India draws trilateral funding from the United States, Japan, and South Korea. Japan's Society 5.0 policy merges robotics and AI into regional revitalisation plans, using cost-sharing schemes where indirect beneficiaries such as retailers help fund mobility services. The Asia Smart City Conference underscores a regional pivot toward zero-carbon ports and hydrogen corridors that blend economic growth with decarbonisation goals.
North America continues to scale projects on the back of USD 100 million annual federal grants and aggressive private 5G build-outs. Las Vegas' data-driven policing initiative, which cut wrong-way driving by 90%, serves as a North American reference case for outcome-based procurement. The Stargate fund deepens the technology stack, promising 100,000 new jobs and vast compute capacity for AI-heavy municipal workloads.
Europe positions sustainability at the forefront, aiming for 100 Positive Energy Districts by 2025 under EU programs that marry energy surplus targets with stringent privacy laws. Syn.ikia pilots confirm 40-60% efficiency gains achievable through digital-twin-led design. Private-equity commitments such as PATRIZIA's EUR 14 billion smart-city fund validate investor confidence in long-run cash flows from green retrofits and urban-service platforms. Middle East programs emphasise autonomous mobility and e-government, with Dubai aiming for 25% self-driving journeys by 2030. Africa and South America present emerging opportunities, although fiscal constraints and skills shortages temper deployment speed.