Electric Bus - Market Share Analysis, Industry Trends & Statistics, Growth Forecasts (2025 - 2030)
상품코드:1693659
리서치사:Mordor Intelligence
발행일:2025년 03월
페이지 정보:영문
라이선스 & 가격 (부가세 별도)
ㅁ Add-on 가능: 고객의 요청에 따라 일정한 범위 내에서 Customization이 가능합니다. 자세한 사항은 문의해 주시기 바랍니다.
ㅁ 보고서에 따라 최신 정보로 업데이트하여 보내드립니다. 배송기일은 문의해 주시기 바랍니다.
한글목차
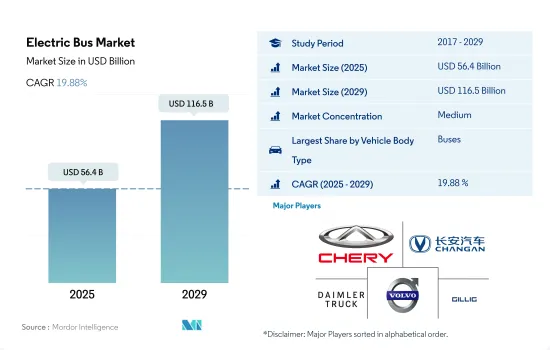
전기 버스 시장 규모는 2025년에 564억 달러로 추계되고, 2029년에는 1,165억 달러에 이를 것으로 예측되며, 예측기간 중(2025-2029년) CAGR은 19.88%를 나타낼 것으로 예측됩니다.
환경 문제, 연료비 상승, 엄격한 친환경 차량 규제로 인해 전 세계적으로 전기 버스에 대한 수요가 크게 증가하고 있습니다.
전기 버스에 대한 전 세계 수요는 최근 몇 년 동안 크게 급증했습니다. 이러한 증가세는 탄소 배출, 연료비 상승, 높은 운영비 부담, 전 세계 정부의 엄격한 친환경 차량 규제 시행으로 인한 환경 문제 증가에 기인한 것으로 볼 수 있습니다.
여러 국가의 대중교통 기관이 전기 버스 도입을 적극적으로 지지하고 있습니다. 예를 들어, 인도 최대 대중교통 버스 운영사인 방갈로르 메트로폴리탄 교통공사(BMTC)는 배터리 전기 버스에 대한 야심찬 계획을 발표했습니다. 향후 몇 년간 최대 1,800대의 전기 버스를 조달하기로 약속했으며, 카르나타카 주 정부는 2030년까지 BMTC의 전체 6,500대의 버스를 무공해 차량으로 전환하는 것을 목표로 하고 있습니다.
전 세계적으로 전기 버스를 도입하는 정부 기관이 점점 늘어나고 있습니다. 미국에서는 더 많은 도시와 대학이 전기 버스를 도입하면서 이러한 추세가 뚜렷해지고 있습니다. 특히 캘리포니아는 이러한 변화의 선두주자로 부상하여 혁신적 청정 대중교통 규칙(ICTR)을 도입했습니다. 이 규칙은 신규 버스 구매의 25%를 무공해 버스로 의무화하고 있으며, 이후 2029년까지 캘리포니아 교통 기관에서 100% 무공해 버스를 주문하는 것을 목표로 하고 있습니다.
세계의 전기 버스 시장 동향
세계적인 수요 증가와 정부의 지원으로 전기자동차 시장 성장 촉진
전기자동차(EV)는 에너지 효율성을 높이고 온실가스 및 공해 배출을 줄일 수 있는 잠재력에 힘입어 자동차 산업에서 필수 불가결한 존재가 되었습니다. 이러한 급증은 주로 환경에 대한 관심이 높아지고 정부의 지원 이니셔티브에 기인합니다. 특히 전 세계 전기차 판매량은 2021년에 비해 2022년에 10.82%의 견고한 성장세를 보였습니다.
런던 경찰청 및 소방청과 같은 선도적인 제조업체와 기관들은 전기 모빌리티 전략을 적극적으로 추진하고 있습니다. 예를 들어, 이들은 2025년까지 무공해 차량 목표를 설정하고 2030년까지 밴의 40%를 전기화하고 2040년까지 완전 전기화를 달성한다는 목표를 세웠습니다.
아시이평양과 유럽은 배터리 기술 및 차량 전기화의 발전에 힘입어 전기차 생산을 주도할 것으로 보입니다. 2020년 5월, 기아자동차 유럽은 전기화로의 전략적 전환을 알리는 '플랜 S'를 발표했습니다. 이 결정은 유럽에서 기아자동차의 전기차 판매량이 기록적으로 증가한 이후 내려진 것입니다. 기아는 2025년까지 승용차, SUV, MPV 등 다양한 부문에 걸쳐 11개의 전기차 모델을 전 세계에 출시한다는 야심찬 계획을 세우고 있습니다.
전기 버스 산업 개요
전기 버스 시장은 적당히 통합되어 있으며 상위 5개 회사가 48.55%를 점유하고 있습니다. 이 시장의 주요 업체는 Chery Automobile Co. Ltd., Chongqing Changan Automobile Company Limited, Daimler Truck Holding AG, Volvo Group 및 Zhejiang Geely Holding Group Co. Ltd(알파벳 순 정렬)입니다.
기타 혜택
엑셀 형식 시장 예측(ME) 시트
3개월간의 애널리스트 지원
목차
제1장 주요 요약과 주요 조사 결과
제2장 보고서 제안
제3장 소개
조사의 전제조건과 시장 정의
조사 범위
조사 방법
제4장 주요 산업 동향
인구
아프리카
아시이평양
유럽
중동
북미
남미
1인당 GDP
아프리카
아시이평양
유럽
중동
북미
남미
자동차 구입을 위한 소비 지출(CVP)
아프리카
아시이평양
유럽
중동
북미
남미
인플레이션율
아프리카
아시이평양
유럽
중동
북미
남미
자동차 대출 금리
공유 차량 서비스
전기화의 영향
EV 충전소
배터리 팩 가격
아프리카
아시이평양
유럽
중동
북미
남미
Xev 신모델 발표
연료 가격
OEM 생산 통계
규제 프레임워크
밸류체인과 유통채널 분석
제5장 시장 세분화
연료 카테고리
BEV
FCEV
HEV
PHEV
지역
아프리카
남아프리카
아시이평양
중국
인도
일본
한국
유럽
프랑스
독일
이탈리아
스페인
영국
기타 유럽
중동
아랍에미리트(UAE)
기타 중동
북미
캐나다
멕시코
미국
남미
아르헨티나
브라질
기타 남미
제6장 경쟁 구도
주요 전략 동향
시장 점유율 분석
기업 상황
기업 프로파일
Anhui Ankai Automobile Co. Ltd.
Ashok Leyland Limited
Byd Auto Industry Company Limited
Chery Automobile Co. Ltd.
Chongqing Changan Automobile Company Limited
CRRC Electric Vehicle Co. Ltd.
Daimler Truck Holding AG
King Long United Automotive Industry Co. Ltd.
NFI Group Inc.
Proterra INC.
Tata Motors Limited
Volvo Group
Zhejiang Geely Holding Group Co. Ltd
Zhengzhou Yutong Bus Co. Ltd.
Zhongtong Bus Holding Co. Ltd.
제7장 CEO에 대한 주요 전략적 질문
제8장 부록
세계 개요
개요
Five Forces 분석 프레임워크
세계의 밸류체인 분석
시장 역학(DROs)
출처 및 참고문헌
도표 일람
주요 인사이트
데이터 팩
용어집
HBR
영문 목차
영문목차
The Electric Bus Market size is estimated at 56.4 billion USD in 2025, and is expected to reach 116.5 billion USD by 2029, growing at a CAGR of 19.88% during the forecast period (2025-2029).
The global demand for electric buses is experiencing significant growth due to environmental concerns, rising fuel costs, and stringent green vehicle regulations
The global demand for electric buses has surged significantly in recent years. This uptick can be attributed to mounting environmental concerns stemming from carbon emissions, escalating fuel costs, the burden of high operational expenses, and the imposition of stringent green vehicle regulations by governments worldwide. Consequently, the global demand for electric buses saw a notable increase in 2022 compared to 2021.
Public transit agencies in several nations are actively championing the adoption of electric buses. For instance, the Bangalore Metropolitan Transport Corporation (BMTC), India's largest public transit bus operator, has unveiled ambitious plans for battery electric buses. It has committed to procuring up to 1,800 electric buses in the coming years, while the Karnataka state government aims to transition BMTC's entire fleet of 6,500 buses to zero-emission vehicles by 2030. Such initiatives are poised to bolster the global demand and sales of electric buses.
Government bodies worldwide are increasingly embracing electric buses. In the United States, the trend is evident as more cities and universities are incorporating electric bus fleets. Notably, California emerged as a frontrunner in this transition, introducing the Innovative Clean Transit Rule (ICTR). This rule mandates that 25% of new bus purchases be zero-emission buses, with a subsequent target of 100% zero-emission orders from California transport agencies by 2029. California aims to electrify its entire fleet of 12,000 city buses by 2040. Similar endeavors in other nations are poised to fuel the demand for electric buses from 2024 to 2030.
Global Electric Bus Market Trends
The rising global demand and government support propel electric vehicle market growth
Electric vehicles (EVs) have become indispensable in the automotive industry, driven by their potential to enhance energy efficiency and reduce greenhouse gas and pollution emissions. This surge is primarily attributed to growing environmental concerns and supportive government initiatives. Notably, global EV sales witnessed a robust 10.82% growth in 2022 compared to 2021. Projections indicate that annual sales of electric passenger cars will surpass 5 million by the end of 2025, accounting for approximately 15% of total vehicle sales.
Leading manufacturers and organizations, like the London Metropolitan Police & Fire Service, have been actively pursuing their electric mobility strategies. For instance, they have set a target of a zero-emission fleet by 2025, with a goal of electrifying 40% of their vans by 2030 and achieving full electrification by 2040. Similar trends are expected globally, with the period from 2024 to 2030 witnessing a surge in demand and sales of electric vehicles.
Asia-Pacific and Europe are poised to dominate electric vehicle production, driven by their advancements in battery technology and vehicle electrification. In May 2020, Kia Motors Europe unveiled its "Plan S," signaling a strategic shift toward electrification. This decision came on the heels of record-breaking sales of Kia's EVs in Europe. Kia has ambitious plans to introduce 11 EV models globally by 2025, spanning various segments like passenger vehicles, SUVs, and MPVs. The company aims to achieve annual global EV sales of 500,000 by 2026.
Electric Bus Industry Overview
The Electric Bus Market is moderately consolidated, with the top five companies occupying 48.55%. The major players in this market are Chery Automobile Co. Ltd., Chongqing Changan Automobile Company Limited, Daimler Truck Holding AG, Volvo Group and Zhejiang Geely Holding Group Co. Ltd (sorted alphabetically).
Additional Benefits:
The market estimate (ME) sheet in Excel format
3 months of analyst support
TABLE OF CONTENTS
1 EXECUTIVE SUMMARY & KEY FINDINGS
2 REPORT OFFERS
3 INTRODUCTION
3.1 Study Assumptions & Market Definition
3.2 Scope of the Study
3.3 Research Methodology
4 KEY INDUSTRY TRENDS
4.1 Population
4.1.1 Africa
4.1.2 Asia-Pacific
4.1.3 Europe
4.1.4 Middle East
4.1.5 North America
4.1.6 South America
4.2 GDP Per Capita
4.2.1 Africa
4.2.2 Asia-Pacific
4.2.3 Europe
4.2.4 Middle East
4.2.5 North America
4.2.6 South America
4.3 Consumer Spending For Vehicle Purchase (cvp)
4.3.1 Africa
4.3.2 Asia-Pacific
4.3.3 Europe
4.3.4 Middle East
4.3.5 North America
4.3.6 South America
4.4 Inflation
4.4.1 Africa
4.4.2 Asia-Pacific
4.4.3 Europe
4.4.4 Middle East
4.4.5 North America
4.4.6 South America
4.5 Interest Rate For Auto Loans
4.6 Shared Rides
4.7 Shared Rides
4.8 Impact Of Electrification
4.9 EV Charging Station
4.10 Battery Pack Price
4.10.1 Africa
4.10.2 Asia-Pacific
4.10.3 Europe
4.10.4 Middle East
4.10.5 North America
4.10.6 South America
4.11 New Xev Models Announced
4.12 Fuel Price
4.13 Oem-wise Production Statistics
4.14 Regulatory Framework
4.15 Value Chain & Distribution Channel Analysis
5 MARKET SEGMENTATION (includes market size in Value in USD and Volume, Forecasts up to 2029 and analysis of growth prospects)
5.1 Fuel Category
5.1.1 BEV
5.1.2 FCEV
5.1.3 HEV
5.1.4 PHEV
5.2 Region
5.2.1 Africa
5.2.1.1 South Africa
5.2.2 Asia-Pacific
5.2.2.1 China
5.2.2.2 India
5.2.2.3 Japan
5.2.2.4 South Korea
5.2.3 Europe
5.2.3.1 France
5.2.3.2 Germany
5.2.3.3 Italy
5.2.3.4 Spain
5.2.3.5 UK
5.2.3.6 Rest-of-Europe
5.2.4 Middle East
5.2.4.1 UAE
5.2.4.2 Rest-of-Middle East
5.2.5 North America
5.2.5.1 Canada
5.2.5.2 Mexico
5.2.5.3 US
5.2.6 South America
5.2.6.1 Argentina
5.2.6.2 Brazil
5.2.6.3 Rest-of-South America
6 COMPETITIVE LANDSCAPE
6.1 Key Strategic Moves
6.2 Market Share Analysis
6.3 Company Landscape
6.4 Company Profiles
6.4.1 Anhui Ankai Automobile Co. Ltd.
6.4.2 Ashok Leyland Limited
6.4.3 Byd Auto Industry Company Limited
6.4.4 Chery Automobile Co. Ltd.
6.4.5 Chongqing Changan Automobile Company Limited
6.4.6 CRRC Electric Vehicle Co. Ltd.
6.4.7 Daimler Truck Holding AG
6.4.8 King Long United Automotive Industry Co. Ltd.