ㅁ Add-on 가능: 고객의 요청에 따라 일정한 범위 내에서 Customization이 가능합니다. 자세한 사항은 문의해 주시기 바랍니다.
ㅁ 보고서에 따라 최신 정보로 업데이트하여 보내드립니다. 배송기일은 문의해 주시기 바랍니다.
한글목차
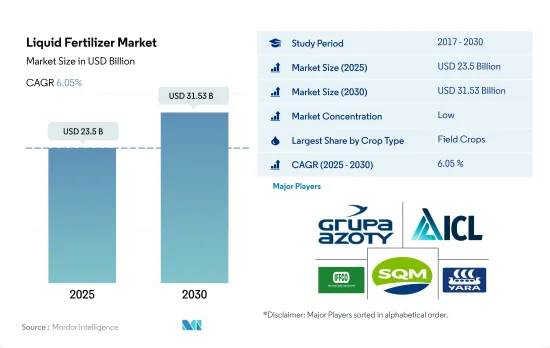
액체 비료 시장 규모는 2025년에 235억 달러, 2030년에는 315억 3,000만 달러에 달할 것으로 예상되며, 예측 기간 중(2025-2030년) CAGR은 6.05%를 나타낼 전망입니다.
농작물의 액체 비료 소비가 증가
농작물이 세계의 액체 비료 시장을 독점하고, 액체 비료 소비량 전체의 약 77.4%를 차지했습니다. 밭작물에 의한 액체 비료의 소비량이 많은 것은 밭작물의 재배 면적이 넓기 때문입니다.
원예 작물은 액체 비료를 소비하는 제2위의 작물이며, 2022년 세계의 액체 비료 소비량의 약 19.2%를 차지합니다.
COVID-19의 대유행 후 건강과 영양에 대한 관심이 높아짐에 따라 과일 및 채소와 같은 고가치 작물에 대한 수요가 세계적으로 높아지고 있습니다. 수요가 큰 야채 작물은 다량의 비료를 소비하고, 연간 재배됩니다.
잔디 및 관상용 작물은 세계의 액체 비료 시장 전체의 약 3.4%를 차지해, 2022년에는 8억 6,390만 달러가 되어, 소비량은 90만 7,200톤이 되었습니다.
잔디 및 관상용 작물의 재배 면적은 공해에 대한 우려, 정원에서의 미적 경관의 중요성이 높아지고, 세계의 에코 투어리즘에 의해 증가하고 있습니다.
미국이 이 지역의 액체 비료 소비로 높은 시장 점유율을 차지
2022년 아시아태평양의 액체비료시장은 세계의 액체비료시장의 총액 점유율의 약 49.9%를 차지했습니다.
액체 비료는 2022년에 북미의 특수 비료 시장의 21.8%를 차지했습니다.
유럽은 세계 제3위의 액체 비료 시장으로, 액체 비료 시장 전체의 약 15.6%를 차지하고 있습니다. 이것은 이 지역의 관개 시스템이 우수하기 때문입니다.
이 지역의 각국 정부는 가격 보조금을 통해 마이크로 관개 시스템의 도입을 지속적으로 추진하고 있습니다.
그러므로, 시비의 용이함, 균일한 분배, 시비 코스트의 삭감에 의해 액체 비료의 채택 경향이 강해지고 있습니다. 이러한 요인은 2023-2030년에 걸쳐 액체 비료 시장을 견인할 가능성이 있습니다.
세계 액체 비료 시장 동향
식량 수요 증가에 대응하기 위한 농업에 대한 압력 증가는 농작물의 재배 면적을 증가시킬 것으로 예측됩니다.
세계의 농업 섹터는 현재 많은 과제에 직면하고 있습니다. 유엔에 따르면 세계 인구는 2050년까지 90억 명을 넘을 가능성이 높습니다. 유엔식량농업기관에 따르면 2050년까지 세계인구의 70%가 도시에 살게 될 것으로 예상되고 있습니다.
아시아태평양은 세계에서 가장 큰 농산물 생산지입니다. 농작물 재배가 총작물 재배 면적의 95% 이상을 차지하고 있습니다.
북미는 세계의 총 농지 면적 중 2번째로 큰 경작 가능 지역입니다. 연구 기간 중 미국이 작물 재배 면적의 46.2%를 차지하고 시장을 독점하고 있습니다.
농작물에서 1차 양분의 질소, 칼륨, 인의 세계 평균 시용량은 164.31 kg/ha
옥수수, 유채, 면화, 수수, 벼, 밀, 콩은 세계 주요 1 차 영양분을 소비하는 작물입니다. kg/ha, 135.35 kg/ha, 120.97 kg/ha입니다. 1차 양분은 식물의 대사 과정에 필수적인 역할을 하며, 세포, 세포막, 엽록소 등의 조직 형성을 돕기 위해 작물에 있어서 매우 중요합니다.
농작물에서 질소, 칼륨, 인의 세계 평균 시용량은 164.31kg/ha입니다. kg/헥타르로 3번째로 소비량이 많은 비료입니다.
2022년의 질소 시용량은 유채가 가장 많고 347.4kg/헥타르였습니다. 세계 농작물의 재배 면적은 특히 남미와 아시아태평양에서 증가하고 있습니다. 이들은 비료의 잠재적 성장 시장입니다. 특수 비료는 효율성 때문에 유럽, 북미 및 기타 영양 결핍이 심한 선진 지역에서 널리 사용됩니다.
액체 비료 산업 개요
액체 비료 시장은 세분화되어 있으며 상위 5개 기업에서 15.48%를 차지하고 있습니다.
기타 혜택
엑셀 형식 시장 예측(ME) 시트
3개월의 애널리스트 서포트
목차
제1장 주요 요약과 주요 조사 결과
제2장 보고서 제안
제3장 소개
조사의 전제조건과 시장 정의
조사 범위
조사 방법
제4장 주요 산업 동향
주요 작물의 작부 면적
밭작물
원예작물
평균 양분 시용률
미량영양소
밭작물
원예작물
1차 영양소
밭작물
원예작물
2차 다량 영양소
밭작물
원예작물
관개 농지
규제 프레임워크
밸류체인과 유통채널 분석
제5장 시장 세분화
유형
복합형
스트레이트
영양소별
미량영양소
질소
인산
칼륨
2차 다량 영양소
적용 모드
시비
잎면 살포
작물 유형
밭작물
원예작물
잔디 및 관상용
지역
아시아태평양
호주
방글라데시
중국
인도
인도네시아
일본
파키스탄
필리핀
태국
베트남
기타 아시아태평양
유럽
프랑스
독일
이탈리아
네덜란드
러시아
스페인
우크라이나
영국
기타 유럽
중동 및 아프리카
나이지리아
사우디아라비아
남아프리카
튀르키예
기타 중동 및 아프리카
북미
캐나다
멕시코
미국
기타 북미
남미
아르헨티나
브라질
기타 남미
제6장 경쟁 구도
주요 전략 동향
시장 점유율 분석
기업 상황
기업 프로파일
BMS Micro-Nutrients NV
Grupa Azoty SA(Compo Expert)
ICL Group Ltd
Indian Farmers Fertiliser Cooperative Limited
Nortox
Safsulphur
Sociedad Quimica y Minera de Chile SA
Yara International ASA
제7장 CEO에 대한 주요 전략적 질문
제8장 부록
세계 개요
개요
Five Forces 분석 프레임워크
세계의 밸류체인 분석
시장 역학(DROs)
정보원과 참고문헌
도표 일람
주요 인사이트
데이터 팩
용어집
SHW
영문 목차
영문목차
The Liquid Fertilizer Market size is estimated at 23.5 billion USD in 2025, and is expected to reach 31.53 billion USD by 2030, growing at a CAGR of 6.05% during the forecast period (2025-2030).
Field crop consumption of liquid fertilizers is increasing
Field crops dominated the global liquid fertilizer market, accounting for about 77.4% of the total liquid fertilizer consumption. Their volume consumption of liquid fertilizers was 20.6 million metric tons, worth USD 20.6 billion in 2022. The large consumption of liquid fertilizers by field crops is due to the large area under cultivation of these crops. More than 85.0% of the global agricultural land is dedicated to the cultivation of field crops.
Horticultural crops are the second-largest crop type that consumes liquid fertilizers, accounting for about 19.2% of the global liquid fertilizer consumption in 2022.
With increasing concerns for health and nutrition after the COVID-19 pandemic, the demand for high-value crops like fruits and vegetables is increasing worldwide. Vegetable crops with major demand, such as tomatoes, potatoes, onions, cabbage, and cauliflower, consume high amounts of fertilizer and are grown throughout the year. Foliar liquid fertilizers play an important role in fruit crops, as foliar spraying is known to improve the quality of fruits.
Turf and ornamental crops accounted for a share of about 3.4% of the total global liquid fertilizer market and were valued at USD 863.9 million in 2022, with a volume consumption of 907.2 thousand metric tons.
The area under cultivation of turf and ornamental crops is increasing with concerns over pollution, the growing importance of aesthetic landscaping in gardens, and ecotourism worldwide. Therefore, the global consumption of liquid fertilizers in respective crop types is anticipated to register a CAGR of 5.1% between 2023 and 2030.
The United States occupied the higher market share in liquid fertilizers consumption in the region
In 2022, the Asia-Pacific liquid fertilizers market accounted for approximately 49.9% of the global liquid fertilizers market's total value share. Growers in the region are increasingly aware of the advantages of liquid fertilizers, such as their ability to penetrate the soil easily and enable plants to absorb nutrients more quickly. Additionally, liquid fertilizers help reduce fertilizer wastage and can be applied either to the ground or to the leaves.
Liquid fertilizer represented 21.8% of the North American specialty market in 2022. The United States was the top consumer of liquid fertilizers in North America, with a share of 74.4% in 2022. The liquid fertilizer market in the country was valued at USD 3.1 billion in 2022, with a volume consumption of 3.3 million metric tons.
Europe is the third-largest market for liquid fertilizers in the world, accounting for about 15.6% of the total liquid fertilizer market. This is due to the dominance of better irrigation systems in the region. For instance, countries like Germany, Russia, the United Kingdom, and France have more than 55% of their irrigated land covered by sprinklers or micro-irrigation systems, thus driving the market in the region.
Governments across the region are continuously promoting the adoption of micro-irrigation systems through price subsidies. Therefore, the adoption of liquid fertilizers in the region is expected to increase in the future, with the increased adoption of advanced irrigation methods.
Hence, there is an increasing trend toward the adoption of liquid fertilizers due to the ease of application, uniform distribution, and reduction in the cost of application. These factors may drive the liquid fertilizer market between 2023 and 2030.
Global Liquid Fertilizer Market Trends
The rising pressure on the agriculture industry to meet the increasing demand for food is expected to increase the area under field crop cultivation
The global agricultural sector is currently facing many challenges. According to the UN, the world population is likely to exceed nine billion by 2050. This population growth may overburden the agricultural industry, which is already experiencing an output loss due to a lack of laborers and the shrinkage of agricultural fields caused by rising urbanization. According to the Food and Agriculture Organization, 70% of the global population is expected to live in cities by 2050. Due to the global loss of arable land, farmers now need to utilize more fertilizers to increase crop yields.
Asia-Pacific is the world's largest producer of agricultural products. Agriculture is critical to the region's economy, as it employs about 20% of the total available workforce. Field crop cultivation dominates the region, accounting for more than 95% of the total crop area in the region. Rice, wheat, and corn are the major field crops produced in the region, which accounted for about 24.3% of the total crop area in 2022.
North America is the second-largest arable region of the total agricultural land area in the world. Diverse varieties of crops are grown in North American farms, primarily field crops. As per the USDA, corn, cotton, rice, soybean, and wheat are among the region's dominant field crops. The United States dominated the market by accounting for 46.2% of the total area under crop cultivation during the study period, with field crops covering the majority of the area compared to other crop types. Crop acreage in the country fell significantly between 2017 and 2019, primarily due to unfavorable environmental conditions that resulted in heavy floods in areas such as Texas and Houston.
The global average application rate of primary nutrient nitrogen, potassium, and phosphorus in field crops is 164.31 kg/ha
Corn, rapeseed, cotton, sorghum, rice, wheat, and soybean are some of the major primary nutrient-consuming crops worldwide. The primary nutrient application rates for these field crops are 230.57 kg/ha, 255.75 kg/ha, 172.70 kg/ha, 158.46 kg/ha, 154.49 kg/ha, 135.35 kg/ha, and 120.97 kg/ha, respectively. Primary nutrient fertilizers are crucial for crops because they play an essential role in plant metabolic processes and assist in forming tissues such as cells, cell membranes, and chlorophyll. Phosphorus is essential for growing high-quality crops; potassium activates the enzymes needed for plant growth and development.
The global average application rate of nitrogen, potassium, and phosphorus in field crops is 164.31 kg/ha. Nitrogen is the most widely used primary nutrient fertilizer in field crops, accounting for an application rate of 224.6 kg/hectare, followed by potassic fertilizers with 150.3 kg/hectare, and phosphorus was the third most consumed fertilizer with an application rate of 117.9 kg/hectare in 2022.
In 2022, the nitrogen application rate was highest in rapeseed at 347.4 kg/hectare. Similarly, the phosphorus application rate was highest in corn at 156.3 kg/hectare, and the potassium application rate was highest in canola at 248.6 kg/hectare. The global field crop cultivation area is increasing, particularly in South America and Asia-Pacific. These are the potential growing markets for fertilizers. Due to their efficiency, specialty fertilizers are widely used in developed regions such as Europe, North America, and other regions with widespread nutrient deficiencies. These factors are anticipated to drive the primary nutrient fertilizers market between 2023 and 2030.
Liquid Fertilizer Industry Overview
The Liquid Fertilizer Market is fragmented, with the top five companies occupying 15.48%. The major players in this market are Grupa Azoty S.A. (Compo Expert), ICL Group Ltd, Indian Farmers Fertiliser Cooperative Limited, Sociedad Quimica y Minera de Chile SA and Yara International ASA (sorted alphabetically).
Additional Benefits:
The market estimate (ME) sheet in Excel format
3 months of analyst support
TABLE OF CONTENTS
1 EXECUTIVE SUMMARY & KEY FINDINGS
2 REPORT OFFERS
3 INTRODUCTION
3.1 Study Assumptions & Market Definition
3.2 Scope of the Study
3.3 Research Methodology
4 KEY INDUSTRY TRENDS
4.1 Acreage Of Major Crop Types
4.1.1 Field Crops
4.1.2 Horticultural Crops
4.2 Average Nutrient Application Rates
4.2.1 Micronutrients
4.2.1.1 Field Crops
4.2.1.2 Horticultural Crops
4.2.2 Primary Nutrients
4.2.2.1 Field Crops
4.2.2.2 Horticultural Crops
4.2.3 Secondary Macronutrients
4.2.3.1 Field Crops
4.2.3.2 Horticultural Crops
4.3 Agricultural Land Equipped For Irrigation
4.4 Regulatory Framework
4.5 Value Chain & Distribution Channel Analysis
5 MARKET SEGMENTATION (includes market size in Value in USD and Volume, Forecasts up to 2030 and analysis of growth prospects)
5.1 Type
5.1.1 Complex
5.1.2 Straight
5.1.2.1 By Nutrient
5.1.2.1.1 Micronutrients
5.1.2.1.2 Nitrogenous
5.1.2.1.3 Phosphatic
5.1.2.1.4 Potassic
5.1.2.1.5 Secondary Macronutrients
5.2 Application Mode
5.2.1 Fertigation
5.2.2 Foliar
5.3 Crop Type
5.3.1 Field Crops
5.3.2 Horticultural Crops
5.3.3 Turf & Ornamental
5.4 Region
5.4.1 Asia-Pacific
5.4.1.1 Australia
5.4.1.2 Bangladesh
5.4.1.3 China
5.4.1.4 India
5.4.1.5 Indonesia
5.4.1.6 Japan
5.4.1.7 Pakistan
5.4.1.8 Philippines
5.4.1.9 Thailand
5.4.1.10 Vietnam
5.4.1.11 Rest of Asia-Pacific
5.4.2 Europe
5.4.2.1 France
5.4.2.2 Germany
5.4.2.3 Italy
5.4.2.4 Netherlands
5.4.2.5 Russia
5.4.2.6 Spain
5.4.2.7 Ukraine
5.4.2.8 United Kingdom
5.4.2.9 Rest of Europe
5.4.3 Middle East & Africa
5.4.3.1 Nigeria
5.4.3.2 Saudi Arabia
5.4.3.3 South Africa
5.4.3.4 Turkey
5.4.3.5 Rest of Middle East & Africa
5.4.4 North America
5.4.4.1 Canada
5.4.4.2 Mexico
5.4.4.3 United States
5.4.4.4 Rest of North America
5.4.5 South America
5.4.5.1 Argentina
5.4.5.2 Brazil
5.4.5.3 Rest of South America
6 COMPETITIVE LANDSCAPE
6.1 Key Strategic Moves
6.2 Market Share Analysis
6.3 Company Landscape
6.4 Company Profiles
6.4.1 BMS Micro-Nutrients NV
6.4.2 Grupa Azoty S.A. (Compo Expert)
6.4.3 ICL Group Ltd
6.4.4 Indian Farmers Fertiliser Cooperative Limited