ㅁ Add-on 가능: 고객의 요청에 따라 일정한 범위 내에서 Customization이 가능합니다. 자세한 사항은 문의해 주시기 바랍니다.
ㅁ 보고서에 따라 최신 정보로 업데이트하여 보내드립니다. 배송기일은 문의해 주시기 바랍니다.
한글목차
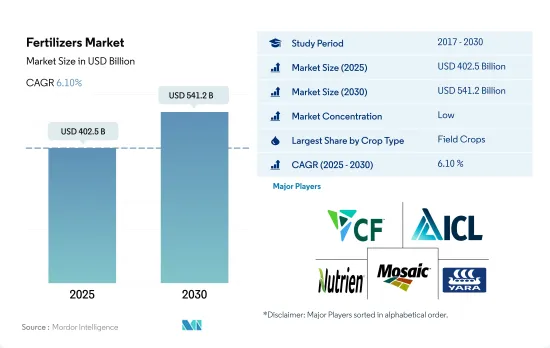
비료 시장 규모는 2025년에 4,025억 달러로 추정되고, 2030년에는 5,412억 달러에 이를 전망이며, 예측 기간인 2025-2030년 CAGR 6.10%로 성장할 것으로 예측됩니다.
농업 면적 감소가 비료 수요를 늘리고 비료 시장을 견인할 것으로 예상됩니다.
2022년에는 농작물이 세계 비료 시장의 약 82.1%를 차지했으며, 약 3,539억 달러에 달했습니다. 농작물의 생산은 세계적으로 지배적이며, 세계 농지의 95.0% 이상이 농작물 재배 하에 있습니다. 쌀, 밀, 옥수수가 세계적으로 생산되고 있는 주요 농작물이며, 이들 3개 작물로 세계 농지의 약 38.0%를 차지하고 있습니다.
원예 작물은 세계의 비료 시장 전체의 약 15.0%를 차지하고 있습니다. 원예 작물의 생산은 개발도상국, 특히 아시아태평양 국가가 지배적입니다. 세계의 원예용 비료 시장에서 아시아태평양 지역의 우위성은 주로 세계 원예 재배 면적의 약 73.0%(약 1억 3,766만 헥타르)를 차지하고 있는 것에 기인합니다.
잔디 및 관상용 식물 분야는 가장 작은 비료 시장이며, 다음으로 원예 작물입니다. 2022년에는 잔디 및 관상용 분야가 세계 비료 시장의 약 2.4%를 차지했으며, 약 104억 2,000만 달러로 평가되었습니다. 잔디 및 관상용 비료 시장은 세분화된 시장입니다. 그러나 북미와 유럽 같은 신흥국 시장은 아시아태평양과 남미에 비해 큰 점유율을 차지하고 있습니다.
아시아태평양은 농작물과 원예 작물의 재배로 세계적으로 우위를 차지하고 있습니다. 아시아태평양의 비료 시장은 급성장하고 있습니다. 유럽은 제2위의 비료 시장이며 아시아태평양이 그 뒤를 잇습니다. 많은 지역에서 도시화가 진행되고 농업 면적 전체가 감소하고 있는 것이 비료 수요를 증대시키고 있으며, 2023-2030년 비료 시장을 견인할 것으로 예상되고 있습니다.
아시아태평양이 세계 비료 시장을 독점
세계의 비료 시장은 조사 기간 중 안정된 성장률을 보였으며 2022년에는 4,290억 달러를 기록했습니다.
아시아태평양은 2022년에 44.8%의 최대 점유율을 차지했으며, 유럽과 남미가 그 뒤를 이었습니다. USDA에 따르면 중국은 이 지역 및 세계 최대 비료 생산 및 수출국으로 세계 비료 생산량의 25%를 차지했습니다. 중국의 비료 시장은 2022년에 703억 달러, 소비량은 9,420만 톤으로 평가되었습니다.
북미는 2022년 세계 비료 시장의 17.8%를 차지했습니다. 북미에서는 미국과 캐나다가 비료 시장의 금액과 수량의 90.0% 이상을 차지했습니다. 북미에는 인산과 칼리 자원이 있는데, 질소 비료의 절반 이상과 칼리의 85.0% 이상을 해외에서 수입하고 있습니다.
2022년 세계 비료 시장의 15.1%는 유럽이 차지했습니다. 프랑스는 유럽 최대의 비료 소비국의 하나이며, 2022년 말에는 전체의 20.1%의 점유율이 전망되고 있습니다. 시장 규모는 2022년 말까지 90억 달러에 이를 것으로 예상되며 전년 대비 성장률은 5.8%입니다. 선진적인 재배 방법의 채택으로 특수 비료의 사용량도 증가합니다.
2022년 시장 점유율은 남미가 11.2%를 차지했습니다. 농작물이 남미의 비료 시장을 독점하면서 2022년 시장 점유율의 95%를 차지했습니다. 남미에서 재배되고 있는 상위 3개 작물은 콩, 옥수수, 사탕수수입니다.
농작물의 재배가 증가하고, 그에 따라 비료 수요도 증가하고 있기 때문에 시장은 2023-2030년 성장할 것으로 예측되고 있습니다.
세계의 비료 시장 동향
증가하는 식량 수요를 충족시키기 위한 농업에 대한 압력 증가로 농작물 재배 면적이 증가할 전망
세계 농업 부문은 많은 과제에 직면해 있습니다. 유엔에 따르면 세계 인구는 2050년까지 90억 명을 넘을 수 있습니다. 이 인구 증가는 이미 노동력 부족과 도시화 진전에 따른 농지 축소로 생산고가 감소하고 있는 농업에 과중한 부담을 줄 수 있습니다. 유엔 식량농업기구에 따르면 2050년까지 세계 인구의 70%가 도시에 살게 될 것으로 예상되고 있습니다. 세계적으로 경지가 감소하고 있기 때문에 농가는 작물 수확량을 늘리기 위해 더 많은 비료를 이용해야 합니다.
아시아태평양은 세계 최대의 농산물 생산지입니다. 농업은 이 지역의 경제에 필수적이며, 전체 노동 인구의 약 20%를 고용하고 있습니다. 농작물 재배가 이 지역을 지배하고 있으며, 지역 전체 작물 재배면적의 약 95% 이상을 차지하고 있습니다. 쌀, 밀, 옥수수가 이 지역에서 생산되는 주요 농작물로 2022년 총 재배 면적의 약 24.3%를 차지했습니다.
북미는 세계 제2위의 경작 가능 지역입니다. 그 농장에서는 농작물을 중심으로 다양한 작물이 재배되고 있습니다. 특히 옥수수, 면화, 쌀, 콩, 밀은 미국 농무부가 강조하고 있듯이 저명한 농작물입니다. 2022년 미국은 북미 작물 재배 면적의 46.2%를 차지했습니다. 그러나 이 나라는 2017-2019년 작물 재배 면적의 대폭적인 감소를 목격했는데, 이는 주로 텍사스나 휴스턴 같은 지역에서 대홍수를 일으킨 악환경 때문입니다.
농작물에서 1차 양분의 질소, 칼륨, 인의 세계 평균 시용량은 164.31 kg/ha
옥수수, 유채, 면화, 수수, 쌀, 밀, 콩은 세계적으로 주요 양분 집약형 작물 중 하나입니다. 2022년 이 작물의 평균 시용량은 옥수수 : 230.57kg/ha, 유채 : 255.75kg/ha, 면화 : 172.70kg/ha, 수수 : 158.46kg/ha, 쌀 : 154.49kg/ha, 밀 : 135.35kg/ha, 콩 : 120.97kg/ha였습니다. 1차 영양소는 식물의 필수 대사 과정을 지원하고 세포, 세포막, 엽록소 등 주요 조직 형성에 기여하기 때문에 작물에 필수적입니다. 특히 인은 고품질 작물의 재배에 필수적이며 칼륨은 식물의 성장에 필요한 효소의 활성화에 매우 중요한 역할을 하고 있습니다.
세계 규모에서는 농작물의 질소, 칼륨, 인의 평균 시용량은 164.31kg/ha입니다. 질소는 가장 널리 사용되는 원료로서 두드러지며, 2022년 시용량은 224.6kg/ha였습니다. 칼리비료는 150.3kg/ha로 뒤를 이었고 인은 117.9kg/ha로 3위입니다.
2022년의 질소 시용량은 유채가 347.4 kg/ha로 가장 많고, 인 시용량은 옥수수가 156.3 kg/ha로 1위였습니다. 칼륨 시용에서는 카놀라가 248.6kg/ha로 1위를 차지했습니다.
농작물의 재배는 세계적으로 증가 경향에 있으며, 특히 남미와 아시아태평양에서 두드러집니다. 이 지역들은 비료의 주요 시장으로 대두되고 있습니다. 유럽이나 북미와 같은 선진 지역은, 영양 부족으로 고민하는 지역과 함께, 그 효능으로부터 특수 비료의 채용을 늘리고 있습니다. 이러한 동향은 2023-2030년 1차 영양 비료 시장을 촉진할 것으로 보입니다.
비료 산업 개요
비료 시장은 세분화되어 있으며 상위 5개사에서 14.27%를 차지하고 있습니다. 이 시장 주요 기업은 다음과 같습니다. CF Industries Holdings, Inc., ICL Group Ltd, Nutrien Ltd., The Mosaic Company and Yara International ASA.(알파벳순 정렬)
기타 혜택
엑셀 형식 시장 예측(ME) 시트
3개월의 애널리스트 서포트
목차
제1장 주요 요약 및 주요 조사 결과
제2장 보고서 제안
제3장 서문
조사의 전제조건 및 시장 정의
조사 범위
조사 방법
제4장 주요 산업 동향
주요 작물의 작부 면적
농작물
원예작물
평균 양분 시용률
미량영양소
농작물
원예작물
1차 영양소
농작물
원예작물
2차 다량 영양소
농작물
원예작물
관개 농지
규제 프레임워크
밸류체인 및 유통 채널 분석
제5장 시장 세분화
유형별
복합형
스트레이트
미량 영양소
붕소
구리
철
망간
몰리브덴
아연
기타
질소
질산암모늄
무수 암모니아
우레아
기타
인산
DAP
MAP
SSP
TSP
기타
칼륨
MoP
SoP
기타
2차 영양소
칼슘
마그네슘
유황
형태별
기존
특수
CRF
액체 비료
SRF
수용성
시비 모드별
시비
잎면 살포
토양
작물 유형별
농작물
원예작물
잔디 및 관상용
지역별
아시아태평양
호주
방글라데시
중국
인도
인도네시아
일본
파키스탄
필리핀
태국
베트남
기타 아시아태평양
유럽
프랑스
독일
이탈리아
네덜란드
러시아
스페인
우크라이나
영국
기타 유럽
중동 및 아프리카
나이지리아
사우디아라비아
남아프리카
튀르키예
기타 중동 및 아프리카
북미
캐나다
멕시코
미국
기타 북미
남미
아르헨티나
브라질
기타 남미
제6장 경쟁 구도
주요 전략 동향
시장 점유율 분석
기업 상황
기업 프로파일
CF Industries Holdings, Inc.
Coromandel International Ltd.
Grupa Azoty SA(Compo Expert)
Haifa Group
ICL Group Ltd
Indian Farmers Fertiliser Cooperative Limited
Nutrien Ltd.
Sociedad Quimica y Minera de Chile SA
The Mosaic Company
Yara International ASA
제7장 CEO에 대한 주요 전략적 질문
제8장 부록
세계 개요
개요
Porter's Five Forces 분석 프레임워크
세계의 밸류체인 분석
시장 역학(DROs)
정보원 및 참고문헌
도표 일람
주요 인사이트
데이터 팩
용어집
AJY
영문 목차
영문목차
The Fertilizers Market size is estimated at 402.5 billion USD in 2025, and is expected to reach 541.2 billion USD by 2030, growing at a CAGR of 6.10% during the forecast period (2025-2030).
Decreasing agricultural area is increasing the demand for fertilizers and is expected to drive the fertilizer market
In 2022, field crops dominated the global fertilizers market, accounting for about 82.1% of the market value of the global fertilizer market, at about USD 353.9 billion. Field crop production is dominant worldwide, and more than 95.0% of the agricultural land in the world is under field crop cultivation. Rice, wheat, and corn are the major field crops produced globally, and these three crops account for about 38.0% of the global agricultural land.
Horticultural crops account for about 15.0% of the total fertilizer market value worldwide. Horticultural crop production is dominant in developing countries, particularly in Asia-Pacific. Asia-Pacific's dominance in the global horticultural fertilizer market is primarily due to the presence of about 73.0% of the global horticultural cultivation area, which is about 137.66 million hectares of land under horticulture cultivation.
The turf and ornamentals segment is the smallest fertilizer market, followed by horticultural crops. In 2022, the turf and ornamentals segment accounted for about 2.4% of the market value of the global fertilizer market, at about USD 10.42 billion. The turf and ornamental fertilizer market is a fragmented market. However, developed regions like North America and Europe occupy a major market share compared to Asia-Pacific and South America.
Asia-Pacific dominates in growing both field and horticultural crops worldwide. The Asia-Pacific fertilizer market is growing at a fast rate. Europe is the second-largest fertilizer market, followed by Asia-Pacific. The increasing urbanization in many regions and the decreasing overall agricultural area are increasing the demand for fertilizers and are expected to drive the fertilizer market between 2023 and 2030.
Asia Pacific is dominating the global fertilizer market
The global fertilizer market grew at a stable rate during the study period, registering a value of USD 429.0 billion in 2022.
Asia-Pacific occupied the largest share of 44.8% in 2022, followed by Europe and South America. China is the largest producer and exporter of fertilizers in the region and the world, contributing 25% to global fertilizer production, according to the USDA. The Chinese fertilizer market is estimated to be valued at USD 70.3 billion in 2022, with a volume consumption of 94.2 million metric tons.
North America accounted for 17.8% of the global fertilizer market in 2022. In North America, the United States and Canada constitute more than 90.0% of the fertilizer market's value and volume. Although North America has phosphate and potash resources, the region is a net importer of more than half of its nitrogenous fertilizers and over 85.0% of its potash from international sources.
Europe accounted for 15.1% of the global fertilizer market in 2022. France is one of the largest fertilizer-consuming countries in Europe, with an expected overall share of 20.1% by the end of 2022. The market value is expected to reach USD 9 billion by the end of 2022, with a 5.8% y-o-y growth rate. The adoption of advanced cultivation methods will also increase the usage of specialty fertilizers.
South America accounted for 11.2% of the market share in 2022. Field crops dominated the South American fertilizer market and accounted for 95% of the market share in 2022. The top three crops grown in South America are soybean, corn, and sugarcane.
With the increasing cultivation of field crops, along with a subsequently increased demand for fertilizers, the market is anticipated to grow between 2023 and 2030.
Global Fertilizers Market Trends
The rising pressure on the agriculture industry to meet the growing demand for food is expected to increase the area under field crop cultivation
The global agricultural sector is facing many challenges. According to the UN, the world population may exceed 9 billion by 2050. This population growth may overburden the agricultural industry, which is already experiencing an output loss due to a lack of laborers and the shrinkage of agricultural fields caused by rising urbanization. According to the Food and Agriculture Organization, 70% of the global population is expected to live in cities by 2050. Due to the global loss of arable land, farmers now need to utilize more fertilizers to increase crop yields.
Asia-Pacific is the world's largest producer of agricultural products. Agriculture is critical to the region's economy, as it employs about 20% of the total available workforce. Field crop cultivation dominates the region, accounting for about more than 95% of the total crop area in the region. Rice, wheat, and corn are the major field crops produced in the region, together accounting for about 24.3% of the total crop area in 2022.
North America ranks as the second-largest arable region globally. Its farms cultivate a diverse range of crops, with a focus on field crops. Notably, corn, cotton, rice, soybean, and wheat are the prominent field crops, as highlighted by the USDA. In 2022, the United States commanded 46.2% of North America's crop cultivation area. However, the country witnessed a significant drop in crop acreage between 2017 and 2019, primarily due to adverse environmental conditions, leading to severe flooding in regions like Texas and Houston.
The global average application rate of primary nutrient nitrogen, potassium, and phosphorus in field crops is 164.31 kg/ha
Corn, rapeseed, cotton, sorghum, rice, wheat, and soybean are among the primary nutrient-intensive crops globally. In 2022, the average application rates for these crops were as follows: corn - 230.57 kg/ha, rapeseed - 255.75 kg/ha, cotton - 172.70 kg/ha, sorghum - 158.46 kg/ha, rice - 154.49 kg/ha, wheat - 135.35 kg/ha, and soybean - 120.97 kg/ha. Primary nutrients are vital for crops as they support essential plant metabolic processes and contribute to the formation of key tissues like cells, cell membranes, and chlorophyll. Notably, phosphorus is crucial for cultivating high-quality crops, while potassium plays a pivotal role in activating enzymes necessary for plant growth.
On a global scale, field crops have an average application rate of 164.31 kg/ha for nitrogen, potassium, and phosphorus. Nitrogen stands out as the most widely used primary nutrient fertilizer, with an application rate of 224.6 kg/ha in 2022. Potassic fertilizers follow, with an application rate of 150.3 kg/ha, and phosphorus ranks third, with an application rate of 117.9 kg/ha.
In 2022, rapeseed had the highest nitrogen application rate at 347.4 kg/ha, while corn led in phosphorus application at 156.3 kg/ha. Canola took the lead in potassium application, with a rate of 248.6 kg/ha.
Field crop cultivation is on the rise globally, particularly in South America and Asia-Pacific. These regions are emerging as key markets for fertilizers. Developed regions like Europe and North America, along with areas grappling with nutrient deficiencies, are increasingly adopting specialty fertilizers for their efficacy. These trends are poised to propel the primary nutrient fertilizers market during 2023-2030.
Fertilizers Industry Overview
The Fertilizers Market is fragmented, with the top five companies occupying 14.27%. The major players in this market are CF Industries Holdings, Inc., ICL Group Ltd, Nutrien Ltd., The Mosaic Company and Yara International ASA (sorted alphabetically).
Additional Benefits:
The market estimate (ME) sheet in Excel format
3 months of analyst support
TABLE OF CONTENTS
1 EXECUTIVE SUMMARY & KEY FINDINGS
2 REPORT OFFERS
3 INTRODUCTION
3.1 Study Assumptions & Market Definition
3.2 Scope of the Study
3.3 Research Methodology
4 KEY INDUSTRY TRENDS
4.1 Acreage Of Major Crop Types
4.1.1 Field Crops
4.1.2 Horticultural Crops
4.2 Average Nutrient Application Rates
4.2.1 Micronutrients
4.2.1.1 Field Crops
4.2.1.2 Horticultural Crops
4.2.2 Primary Nutrients
4.2.2.1 Field Crops
4.2.2.2 Horticultural Crops
4.2.3 Secondary Macronutrients
4.2.3.1 Field Crops
4.2.3.2 Horticultural Crops
4.3 Agricultural Land Equipped For Irrigation
4.4 Regulatory Framework
4.5 Value Chain & Distribution Channel Analysis
5 MARKET SEGMENTATION (includes market size in Value in USD and Volume, Forecasts up to 2030 and analysis of growth prospects)
5.1 Type
5.1.1 Complex
5.1.2 Straight
5.1.2.1 Micronutrients
5.1.2.1.1 Boron
5.1.2.1.2 Copper
5.1.2.1.3 Iron
5.1.2.1.4 Manganese
5.1.2.1.5 Molybdenum
5.1.2.1.6 Zinc
5.1.2.1.7 Others
5.1.2.2 Nitrogenous
5.1.2.2.1 Ammonium Nitrate
5.1.2.2.2 Anhydrous Ammonia
5.1.2.2.3 Urea
5.1.2.2.4 Others
5.1.2.3 Phosphatic
5.1.2.3.1 DAP
5.1.2.3.2 MAP
5.1.2.3.3 SSP
5.1.2.3.4 TSP
5.1.2.3.5 Others
5.1.2.4 Potassic
5.1.2.4.1 MoP
5.1.2.4.2 SoP
5.1.2.4.3 Others
5.1.2.5 Secondary Macronutrients
5.1.2.5.1 Calcium
5.1.2.5.2 Magnesium
5.1.2.5.3 Sulfur
5.2 Form
5.2.1 Conventional
5.2.2 Speciality
5.2.2.1 CRF
5.2.2.2 Liquid Fertilizer
5.2.2.3 SRF
5.2.2.4 Water Soluble
5.3 Application Mode
5.3.1 Fertigation
5.3.2 Foliar
5.3.3 Soil
5.4 Crop Type
5.4.1 Field Crops
5.4.2 Horticultural Crops
5.4.3 Turf & Ornamental
5.5 Region
5.5.1 Asia-Pacific
5.5.1.1 Australia
5.5.1.2 Bangladesh
5.5.1.3 China
5.5.1.4 India
5.5.1.5 Indonesia
5.5.1.6 Japan
5.5.1.7 Pakistan
5.5.1.8 Philippines
5.5.1.9 Thailand
5.5.1.10 Vietnam
5.5.1.11 Rest of Asia-Pacific
5.5.2 Europe
5.5.2.1 France
5.5.2.2 Germany
5.5.2.3 Italy
5.5.2.4 Netherlands
5.5.2.5 Russia
5.5.2.6 Spain
5.5.2.7 Ukraine
5.5.2.8 United Kingdom
5.5.2.9 Rest of Europe
5.5.3 Middle East & Africa
5.5.3.1 Nigeria
5.5.3.2 Saudi Arabia
5.5.3.3 South Africa
5.5.3.4 Turkey
5.5.3.5 Rest of Middle East & Africa
5.5.4 North America
5.5.4.1 Canada
5.5.4.2 Mexico
5.5.4.3 United States
5.5.4.4 Rest of North America
5.5.5 South America
5.5.5.1 Argentina
5.5.5.2 Brazil
5.5.5.3 Rest of South America
6 COMPETITIVE LANDSCAPE
6.1 Key Strategic Moves
6.2 Market Share Analysis
6.3 Company Landscape
6.4 Company Profiles
6.4.1 CF Industries Holdings, Inc.
6.4.2 Coromandel International Ltd.
6.4.3 Grupa Azoty S.A. (Compo Expert)
6.4.4 Haifa Group
6.4.5 ICL Group Ltd
6.4.6 Indian Farmers Fertiliser Cooperative Limited