

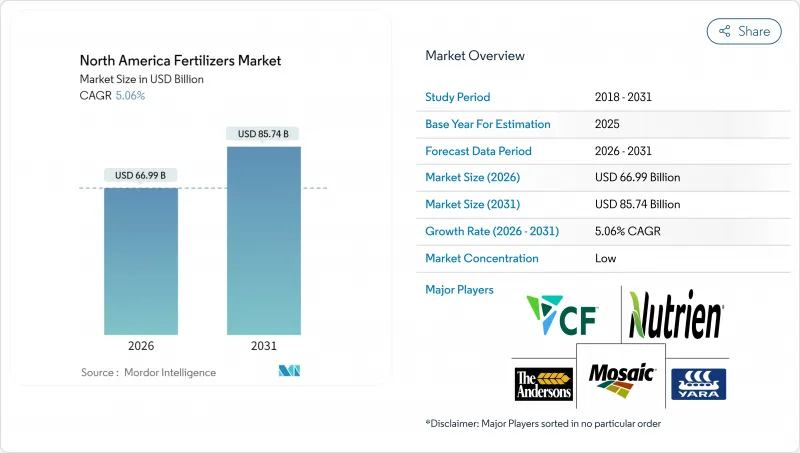
북미의 비료 시장은 2025년 637억 6,000만 달러로 평가되었고, 2026년에는 669억 9,000만 달러로 성장할 전망이며, 2026-2031년 CAGR 5.06%로 성장을 지속하여, 2031년까지 857억 4,000만 달러에 달할 전망입니다.
현재의 성장세는 옥수수와 대두의 경작 면적 확대, 수입 리스크를 저감하는 국내 생산 능력 증강, 약 2억 7,000만 에이커의 경작지에서의 양분 이용 효율을 향상시키는 정밀 농업 툴에 의해 견인되고 있습니다. 생산자는 또한 코팅 비료와 서방형 제품을 우대하는 환경 규제 강화에 직면하고 있는 반면, 녹색 암모니아에 대한 정부의 우대 조치는 저탄소 생산 설비에 대한 새로운 자본 투자를 촉진하고 있습니다. 2021-2022년 운송 혼란 이후 공급 회복력이 향상되었습니다. 그러나 물류 개선 및 운임 비용 저하는 제품 표준화를 지속적으로 지원하고 수입 칼륨염 및 인산염 비용 경쟁력을 유지하고 있습니다. 지역별 토양 특성 및 작물의 다양성이 제품의 표준화를 제한하기 때문에 경쟁의 격렬함은 여전히 분산된 상태입니다. 이를 통해 특수 블렌딩 업체, 농학 서비스 기업, 플랫폼 기반 과제들이 현장 수준에서 솔루션을 사용자 정의할 수 있는 여지가 생깁니다.
옥수수 및 대두의 경작 면적은 2026년까지 9,620만 에이커에 달할 것으로 예측됩니다. 경작 면적이 100만 에이커 증가할 때마다 약 18만 미터톤의 질소 비료가 필요합니다. 이 성장은 신재생 연료 기준과 안정적인 수출 판매에 의해 지원됩니다. 신품종 하이브리드는 질소를 보다 효율적으로 이용하지만, 경작 면적 확대에 의해 총소비량은 증가 경향을 유지하고 있습니다. 신규 제작 면적의 대부분은 아이오와주, 일리노이주, 네브라스카주에 집중되어 있으며, 이들 지역에서는 파이프라인망에 의해 저비용의 암모니아가 공급되고 있습니다. 옥수수 연작에서는 보다 다량의 질소 시비가 필요하기 때문에 향후 10년간 수요가 확보될 전망입니다.
캘리포니아 주 센트럴 밸리의 과수, 견과류, 야채 생산자는 이미 약 280만 에이커의 농지에서 특수 제품을 도입하고 있습니다. 서방형 입제는 노동력을 삭감하고, 과일의 사이즈, 색 및 보존성을 보호하는 안정된 영양 공급을 실현합니다. 수용성 제품 라인은 아보카도 및 감귤류의 과수원에서 시비 관리를 미세 조정하는 비료 관개 시스템과 연계합니다. 유기 비료의 프리미엄 가격은 표준품보다 40-60% 높은 이러한 투입 자재의 비용을 상쇄하는 데 도움이 됩니다. 플로리다의 감귤류 생산자는 집중적인 미량 영양소 프로그램으로 병해압과 싸우기 위해 비슷한 전략을 채택합니다.
암모니아 생산에는 1톤 당 약 28-30백만 BTU의 천연 가스를 소비하기 때문에 비료 비용은 헨리 허브 선물 가격의 변동에 연동합니다. 2024년 동계 난방 시즌에는 이 선물이 1백만 BTU당 9.50달러로 피크를 기록했습니다. 계절적 수요 급증 및 파이프라인 제약이 가격 변동을 조장하고 있습니다. 제조업체는 가능한 한 연료 비용을 헤지하고 있지만, 사용량이 급증하는 초봄에는 농가에서도 가격 상승을 실감하고 있습니다.
2025년 시점에서 단일 성분 비료는 북미 비료 시장 점유율의 79.90%를 차지했습니다. 이 수치는 대규모 곡물 생산자가 안정적이고 저비용의 단일 영양소 제품에 대한 의존을 계속하고 있음을 나타냅니다. 그레이트 플레인즈 및 중서부에 있어서의 옥수수나 밀의 작부 면적이 안정된 수요를 견인하고 있기 때문에 질소 등급이 이 카테고리를 지배하고 있습니다. 여러 영양소를 하나의 미립자 비료로 배합한 복합 비료는 2031년까지 연평균 복합 성장률(CAGR) 6.72%로 가장 높은 성장을 보였습니다. 이것은 특수 작물의 생산자가 시비 횟수 삭감 및 인건비의 저감으로 이어지는 균형 잡힌 배합을 선호하기 때문입니다.
칼리 비료도 6.72%의 성장률을 유지합니다. 캐나다의 칼리 광산 외에도 가뭄 대책과 품질 향상에서 칼륨의 역할이 널리 인식되고 있기 때문입니다. 이 세 가지 비료 모두에서 코팅 유형 수요가 빠르게 증가하고 있습니다. 폴리머와 유황층이 양분류 손실을 억제하고 농가가 수질 규제를 충족시킬 수 있도록 하기 때문입니다. 정밀한 토양 검사로 아연, 망간, 붕소 부족이 나타나기 때문에 단일 배합 비료에 미량 영양소 첨가가 보편화되고 있습니다. 가변 시비 장치가 적절한 구역에 적절한 제품을 투입하는 이 변화는 기존의 '일률' NPK 시비법보다 고수량화에 보다 정밀한 영양 관리가 요구되는 시대를 반영하고 있습니다.
2025년에는 기존 비료가 매출액의 82.60%를 차지하고 있으며, 비용 의식이 높은 곡물 생산자는 입증된 주력 제품을 계속 채용하고 있습니다. 특수 비료 분야는 수질 규제 및 노동 비용 상승으로 여러 번의 살포보다 단회 시비 프로그램이 유리한 상황을 받으며 5.55%의 연평균 복합 성장률(CAGR)로 업계를 견인하고 있습니다. 고부가가치 과일, 견과류, 야채 부문의 생산자는 서방형 코팅이 양분 이용 효율을 높이고 제품 품질을 보호할 경우 앞으로 프리미엄 가격을 지불합니다.
액체 비료도 주입 장치를 통해 유동성이 높고, 작업자가 그 자리에서 시비량을 조정할 수 있는 점에서 존재감을 늘리고 있습니다. 이러한 코팅 기술의 개발에는 많은 자본 및 전문 지식이 필요하며 기존 제조업체를 모방업자로부터 지키고 있습니다. 현재 연구개발의 초점은 보다 견고한 피막과 안정적인 방출 곡선의 개발에 놓여 있어 일 단위로 작물 수요에 영양 공급을 확실히 맞추는 것을 목표로 하고 있습니다.
북미의 비료 시장 보고서는 유형별(복합비료 및 단일비료), 형태별(기존 및 특수품), 시용 방법별(토양, 잎면 살포 등), 작물 종별(밭작물, 원예작물 등), 지역별(미국, 캐나다, 멕시코 등)로 분류되어 있습니다. 시장 예측은 금액(달러) 및 수량(메트릭톤)으로 제공됩니다.
The North America fertilizers market is expected to grow from USD 63.76 billion in 2025 to USD 66.99 billion in 2026 and is forecast to reach USD 85.74 billion by 2031 at 5.06% CAGR over 2026-2031.

Current momentum is driven by expanding corn and soybean acreage, domestic capacity additions that reduce import risk, and precision agriculture tools that push nutrient use efficiency across roughly 270 million cultivated acres. Producers also face tightening environmental rules that reward coated and controlled-release products, while government incentives for green ammonia encourage fresh capital investment in low-carbon production assets. Supply resilience has improved after the 2021-2022 transport disruptions. However, logistics upgrades and freight cost declines continue to support the standardization of products, keeping imported potash and phosphates cost-competitive. Competitive intensity remains fragmented because regional soil variability and crop diversity limit product standardization. This opens space for specialty blenders, agronomy service firms, and platform-based challengers that tailor solutions at the field level.
Corn and soybean plantings are anticipated to reach 96.2 million acres by 2026. Each extra million acres calls for about 180,000 metric tons of nitrogen fertilizer. Growth is tied to renewable fuel standards and steady export sales. Although new hybrids use nitrogen more efficiently, the larger footprint keeps total consumption on an upward path. Most new acres sit in Iowa, Illinois, and Nebraska, where pipeline networks carry low-cost ammonia. When corn follows corn, fields need heavier nitrogen programs, which secures demand for the rest of the decade.
Fruit, nut, and vegetable growers in California's Central Valley have already adopted specialty products on roughly 2.8 million acres. Controlled-release granules cut labor and deliver steady nutrition that protects fruit size, color, and shelf life. Water-soluble lines work with fertigation systems that fine-tune feeding in avocado and citrus orchards. Organic premiums help offset the higher price of these inputs, which often run 40 to 60% above standard grades. Florida citrus growers employ the same strategy to fight disease pressure with intensive micronutrient programs.
Ammonia production uses roughly 28 to 30 MMBtu of natural gas for every metric ton, so fertilizer costs rise and fall with Henry Hub futures that peaked at USD 9.50 per MMBtu during the 2024 winter heating season. Seasonal demand surges and pipeline constraints amplify the volatility. Manufacturers hedge fuel costs where possible, yet farmers still see higher prices in spring when usage spikes.
Other drivers and restraints analyzed in the detailed report include:
For complete list of drivers and restraints, kindly check the Table Of Contents.
Straight fertilizers accounted for 79.90% of North America fertilizers market share in 2025, a figure indicating that large-scale grain growers continue to rely on single nutrient products for dependable, low-cost coverage. Nitrogen grades dominate this group because the acres of corn and wheat across the Great Plains and Midwest drive steady demand. Complex blends, which combine several nutrients into one prill, post the fastest 6.72% CAGR through 2031, as specialty-crop growers favor balanced mixes that reduce application passes and lower labor costs.
Potassic grades match that 6.72% pace owing to Canada's potash mines and a wider appreciation of potassium's role in drought defense and quality gains. Coated versions of all three fertilizer types are gaining popularity rapidly because polymer and sulfur layers help curb nutrient losses and enable farms to meet water quality regulations. Precision soil tests flag growing gaps in zinc, manganese, and boron, so micronutrient add-ons within straight formulations are becoming more common. Variable rate rigs then drop the right product in the right zone, a shift that reflects an era when higher yields demand far more targeted nutrition than the old "blanket" NPK approach.
Conventional fertilizer accounted for 82.60% of revenue in 2025, as cost conscious grain producers stick with proven workhorses. The specialty fertilizer segment, is pacing the field with an 5.55% CAGR, driven by water-quality mandates and rising labor costs that favor single shot programs over multiple trips. Growers in high value fruit, nut, and vegetable sectors willingly pay premiums when slow-release coatings boost nutrient use efficiency and protect product quality.
Liquids also gain ground because they flow through injection equipment that lets operators tweak rates on the fly. Building those coatings requires significant capital and expertise, which shields established manufacturers from quick copycats. Most research now focuses on developing tougher shells and steadier release curves, ensuring that nutrient supply matches crop demand on a daily basis.
The North America Fertilizers Market Report is Segmented by Type (Complex and Straight), by Form (Conventional and Specialty), by Application Mode (Soil, Foliar, and More), by Crop Type (Field Crops, Horticultural Crops, and More), and by Geography (United States, Canada, Mexico, and More). The Market Forecasts are Provided in Terms of Value (USD) and Volume (Metric Tons).