중국의 미량영양소 비료 시장 : 점유율 분석, 산업 동향, 통계, 성장 예측(2025-2030년)
China Micronutrient Fertilizer - Market Share Analysis, Industry Trends & Statistics, Growth Forecasts (2025 - 2030)
상품코드:1693506
리서치사:Mordor Intelligence
발행일:2025년 03월
페이지 정보:영문
라이선스 & 가격 (부가세 별도)
ㅁ Add-on 가능: 고객의 요청에 따라 일정한 범위 내에서 Customization이 가능합니다. 자세한 사항은 문의해 주시기 바랍니다.
ㅁ 보고서에 따라 최신 정보로 업데이트하여 보내드립니다. 배송기일은 문의해 주시기 바랍니다.
한글목차
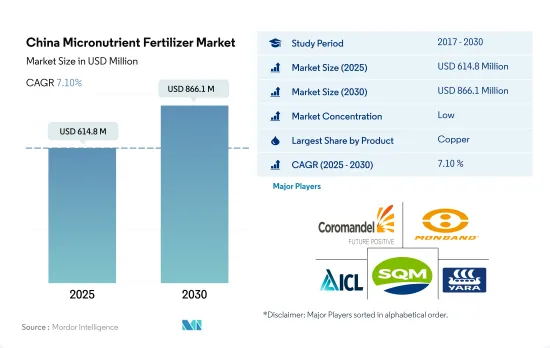
중국의 미량영양소 비료 시장 규모는 2025년에는 6억 1,480만 달러, 2030년에는 8억 6,610만 달러에 이를 것으로 예측되며, 예측 기간(2025-2030년)의 CAGR은 7.10%를 나타낼 전망입니다.
생산성 향상을 위한 미량영양소에 대한 요구가 증가함에 따라 시장 성장을 가속할 수 있습니다.
토양에서 미량영양소의 결핍은 전국적으로 널리 발견되는 문제입니다. 일부 미량영양소는 이동하기 어려운 특성으로 인해 지각에 풍부하게 존재합니다. 그들은 작물에 미량영양소 결핍을 유발합니다.
구리는 국내 작물 생산에 사용되는 일반적인 미량영양소 비료입니다. 2022년 미량영양소 비료 시장 전체의 약 27.6%를 차지하고 있습니다. 식물이 소량이라도 필요한 미량영양소 중 하나가 구리(Cu)입니다. 광합성에 필요하며 식물의 호흡에 필수적이며 식물이 단백질과 탄수화물을 대사하는 데 도움이 됩니다. 구리는 야채의 색과 꽃의 색을 돋보이게하고 단백질 형성에 중요한 역할을합니다.
중국 토양의 대부분은 충분한 양의 구리를 함유하고 있습니다. 그러나 야채 작물에서는 2022년 농작물의 평균 구리 시비율보다 평균 구리 시비율이 0.2% 높았습니다. 구리는 식물에서 부동 원소이기 때문에 구리 결핍의 증상은 먼저 식물의 어린 부분에서 먼저 나타납니다.
아연은 국내에서 가장 많이 소비되는 미량영양소로, 2022년에는 25.49%의 가치 기준 시장 점유율로 두 번째로 큰 비중을 차지했습니다. 식물에게는 매우 적은 양의 아연이 필요하며, 대부분의 식물에서 아연의 일반적인 농도는 20-100 ppm 사이입니다. 하지만 이렇게 소량의 아연도 식물에서 효소의 보조 인자이자 단백질의 구조적 구성 요소로서 핵심적인 역할을 합니다.
생산성 향상과 생산량 증가, 끊임없이 확대하는 인구에 대한 식량과 영양안전보장을 유지할 필요성 등으로 인하여 시장은 2023-2030년에 걸쳐 CAGR 6.9%로 성장할 것으로 예상되며, 고급 비료의 출현도 미량영양소 소비에 공헌할 가능성이 있습니다.
중국의 미량영양소 비료 시장 동향
재배면적 확대는 식량 수요 증가와 주식의 자급자족을 목표로 하는 국가의 목표에 따릅니다.
중국 농작물의 경작 면적은 2018년 1억 2,660만 ha에서 2022년에는 1억 2,780만 ha로 약간 확대되었으며, 경작지 전체의 70.8%를 차지합니다. 농작물의 점유율은 옥수수가 34.2%를 차지하고 쌀 23.6%, 밀 18.3%로 이어집니다.
중국의 밭작물 캘린더는 봄 여름(4월-9월)과 겨울의 2개의 계절을 중심으로 전개됩니다. 빛을 받는 것은 쌀과 옥수수로, 중국의 곡물 생산량의 1/3을 차지하고 있습니다. 세계 최대 쌀 생산국인 중국은 2022년에 벼농사를 위해 3천만 헥타르를 할애하여 2억 1천만 톤이라는 풍부한 수확량을 거두었습니다. 주요 쌀 생산지역은 흑룡강성, 후난성, 강서성, 후베이성, 강소성, 사천성, 광서 치완족 자치구, 광동성, 클라우드 남성에 걸쳐 2022-20 23년의 중국의 생산량은 2억 7,720만 톤이 되어, 전년 대비 460만 톤 급증했습니다.
중국의 작기는 봄이 중심이지만, 6월과 7월은 더위에 시달리게 됩니다.
중국에서는 유채나 카놀라는 다른 농작물에 비해 다량의 미량영양소가 시비되고 있습니다.
미량영양소는 작물의 영양과 성장에 중요한 역할을 하며, 그 결핍은 수량에 큰 영향을 미칩니다. 많은 존재하는 미량영양소임에도 불구하고 2022년의 시용량은 9.8kg/헥타르로 톱을 차지하고 있습니다. 그러나 토양 pH가 7 이상에 도달하면 화학적 및 미생물적 산화가 일어나 식물에서 이용할 수 있는 Mn2+가 고정됩니다. 이것이 식물에 있어서의 망간 결핍의 방아쇠가 됩니다.
2022년에는 망간에 이어 구리가 7.3kg/헥타르의 살포량으로 시장을 리드해, 아연이 4.1kg/헥타르, 철이 3.3kg/헥타르로 계속됩니다.
중국에서는 유채 또는 캐놀라의 미량영양소 살포율이 다른 농작물에 비해 높다는 것이 두드러집니다. 유채에는 평균 10.79kg/헥타르의 미량영양소가 시용되고 있습니다.
토양중의 미량영양소의 결핍은 과잉인산시비와 기타 자연요인에 의해 생길 가능성이 있습니다.
미량영양소 비료를 최적으로 시용하는 것으로, 식물이 토양으로부터 1차 영양소를 흡수하는 효율을 높여, 야채 작물에 있어서의 전체적인 필요 비료량을 줄일 수 있습니다.
중국의 미량영양소 비료 산업 개요
중국의 미량영양소 비료 시장은 세분화되어 있으며 상위 5개 기업에서 27.14%를 차지하고 있습니다.
기타 혜택
엑셀 형식 시장 예측(ME) 시트
3개월의 애널리스트 서포트
목차
제1장 주요 요약과 주요 조사 결과
제2장 보고서 제안
제3장 소개
조사의 전제조건과 시장 정의
조사 범위
조사 방법
제4장 주요 산업 동향
주요 작물의 작부 면적
밭작물
원예작물
평균 양분 시용률
미량영양소
밭작물
원예작물
관개 설비가 있는 농지
규제 프레임워크
밸류체인과 유통채널 분석
제5장 시장 세분화
제품
붕소
구리
철
망간
몰리브덴
아연
기타
용도 모드
시비
잎면 살포
토양
작물 유형
밭작물
원예작물
잔디 및 관상용
제6장 경쟁 구도
주요 전략 동향
시장 점유율 분석
기업 상황
기업 프로파일
Coromandel International Ltd.
Grupa Azoty SA(Compo Expert)
Haifa Group
Hebei Monband Water Soluble Fertilizer Co. Ltd
ICL Group Ltd
Sociedad Quimica y Minera de Chile SA
Yara International ASA
제7장 CEO에 대한 주요 전략적 질문
제8장 부록
세계 개요
개요
Five Forces 분석 프레임워크
세계의 밸류체인 분석
시장 역학(DROs)
정보원과 참고문헌
도표 일람
주요 인사이트
데이터 팩
용어집
SHW
영문 목차
영문목차
The China Micronutrient Fertilizer Market size is estimated at 614.8 million USD in 2025, and is expected to reach 866.1 million USD by 2030, growing at a CAGR of 7.10% during the forecast period (2025-2030).
The rising requirement of micronutrients to enhance the productivity may boost the growth of the market
Micronutrient deficiency in soils is a widespread problem across the country. Some of the micronutrients are abundant on the earth's crust due to their immobile nature. They cause micronutrient deficiencies in crops.
Copper is the common micronutrient fertilizer used in crop production in the country. It accounted for about 27.6% of the total micronutrient fertilizer market value in 2022. One of the micronutrients that plants require in small amounts is copper (Cu). It is necessary for photosynthesis, essential for plant respiration, and helps the plant metabolize proteins and carbohydrates. Copper enhances the color of vegetables as well as the color of flowers and plays a key role in protein formation.
Most of the soils in China have an adequate amount of copper. However, in vegetable crops, the average copper nutrient application rate was 0.2% higher than the average copper application rate in field crops in 2022. Because copper is an immobile element in plants, symptoms of copper deficiency appear first in the plant's younger sections.
Zinc is the most consumed micronutrient in the country, accounting for the second largest market share by the value of 25.49% in 2022. Zinc is needed in very small amounts by plants. The normal concentration of Zn in most plants is between 20 to 100 ppm. However, this small amount of Zn plays a key role in plants as an enzyme co-factor and a structural component in proteins.
Due to factors like the requirement for increased productivity and output, as well as the necessity to maintain food and nutritional security for the area's constantly expanding population, the market may expand during 2023-2030 with a CAGR of 6.9%, and the emergence of advanced fertilizers may also contribute to micronutrient consumption.
China Micronutrient Fertilizer Market Trends
The expansion of the cultivation area is driven by increasing demand for food and the country's goal to achieve self-sufficiency in staple food
China's cultivation area for field crops expanded marginally from 126.6 million ha in 2018 to 127.8 million ha in 2022, representing 70.8% of the total cultivated land. In 2022, Corn dominated the field crop landscape, commanding a 34.2% share, trailed by rice at 23.6% and wheat at 18.3%. This increase in cultivation area is poised to drive up fertilizer demand in the nation.
China's field crop calendar revolves around two seasons: spring/summer (April-September) and winter. Spring crops encompass early corn, early rice, early wheat, and cotton, while winter crops center around winter wheat and rapeseed. Yet, it's rice and corn that take the spotlight, contributing to a third of China's grain output. As the world's leading rice producer, China dedicated 30 million hectares to rice farming in 2022, yielding a bountiful 210 million tons. Key rice-growing regions span Heilongjiang, Hunan, Jiangxi, Hubei, Jiangsu, Sichuan, Guangxi, Guangdong, and Yunan. Looking at corn, China was set to produce 277.2 million tons in 2022-2023, a 4.6 million ton surge from the previous year, buoyed by a robust harvest. The Northeast provinces of Heilongjiang, Jilin, and Inner Mongolia stand out as the corn powerhouses.
While spring dominates China's cropping season, it grapples with heat spikes in June and July. Rice, a dietary staple for millions, bears the brunt. These scorching temperatures, coupled with meager rainfall, exacerbate mineral depletion in the soil, necessitating higher fertilizer application. Such arid conditions can also curtail crop yields.
In China, rapeseed or canola is applied with large amounts of micronutrients compared to other field crops
Micronutrients play a vital role in crop nutrition and growth, and their deficiency significantly impacts yields. Field crops typically receive an average application rate of 5.2 kg/hectare for micronutrient fertilizers. Among these, manganese takes the lead, with an application rate of 9.8 kg/hectare in 2022, despite being the eleventh most abundant micronutrient in the earth's crust. However, when the soil pH reaches seven or higher, chemical and microbial oxidation occur, leading to the immobilization of plant-available Mn2+. This, in turn, triggers manganese deficiency in plants.
Following manganese, copper took the market lead with an application rate of 7.3 kg/hectare, trailed by zinc at 4.1 kg/hectare, and iron at 3.3 kg/hectare in 2022.
In China, rapeseed or canola stands out for its higher micronutrient application rates compared to other field crops. It receives an average of 10.79 kg/hectare of micronutrient fertilizers, given the significant impact of micronutrient deficiency on oil yield. Notably, foliar application of manganese and molybdenum has shown a 1% increase in oil content in the seeds.
Micronutrient deficiencies in soil can arise from excessive phosphate fertilization and other natural factors. Phosphate, in particular, can limit the availability of iron, zinc, and copper to crops. In China, a strategy was adopted to enhance field crop yields by reducing phosphate fertilization while simultaneously increasing zinc fertilization.
Optimally applying micronutrient fertilizers can enhance plant efficiency in absorbing primary nutrients from the soil, thereby reducing the overall fertilizer requirement in vegetable crops.
China Micronutrient Fertilizer Industry Overview
The China Micronutrient Fertilizer Market is fragmented, with the top five companies occupying 27.14%. The major players in this market are Coromandel International Ltd., Hebei Monband Water Soluble Fertilizer Co. Ltd, ICL Group Ltd, Sociedad Quimica y Minera de Chile SA and Yara International ASA (sorted alphabetically).
Additional Benefits:
The market estimate (ME) sheet in Excel format
3 months of analyst support
TABLE OF CONTENTS
1 EXECUTIVE SUMMARY & KEY FINDINGS
2 REPORT OFFERS
3 INTRODUCTION
3.1 Study Assumptions & Market Definition
3.2 Scope of the Study
3.3 Research Methodology
4 KEY INDUSTRY TRENDS
4.1 Acreage Of Major Crop Types
4.1.1 Field Crops
4.1.2 Horticultural Crops
4.2 Average Nutrient Application Rates
4.2.1 Micronutrients
4.2.1.1 Field Crops
4.2.1.2 Horticultural Crops
4.3 Agricultural Land Equipped For Irrigation
4.4 Regulatory Framework
4.5 Value Chain & Distribution Channel Analysis
5 MARKET SEGMENTATION (includes market size in Value in USD and Volume, Forecasts up to 2030 and analysis of growth prospects)
5.1 Product
5.1.1 Boron
5.1.2 Copper
5.1.3 Iron
5.1.4 Manganese
5.1.5 Molybdenum
5.1.6 Zinc
5.1.7 Others
5.2 Application Mode
5.2.1 Fertigation
5.2.2 Foliar
5.2.3 Soil
5.3 Crop Type
5.3.1 Field Crops
5.3.2 Horticultural Crops
5.3.3 Turf & Ornamental
6 COMPETITIVE LANDSCAPE
6.1 Key Strategic Moves
6.2 Market Share Analysis
6.3 Company Landscape
6.4 Company Profiles
6.4.1 Coromandel International Ltd.
6.4.2 Grupa Azoty S.A. (Compo Expert)
6.4.3 Haifa Group
6.4.4 Hebei Monband Water Soluble Fertilizer Co. Ltd