ㅁ Add-on 가능: 고객의 요청에 따라 일정한 범위 내에서 Customization이 가능합니다. 자세한 사항은 문의해 주시기 바랍니다.
ㅁ 보고서에 따라 최신 정보로 업데이트하여 보내드립니다. 배송기일은 문의해 주시기 바랍니다.
한글목차
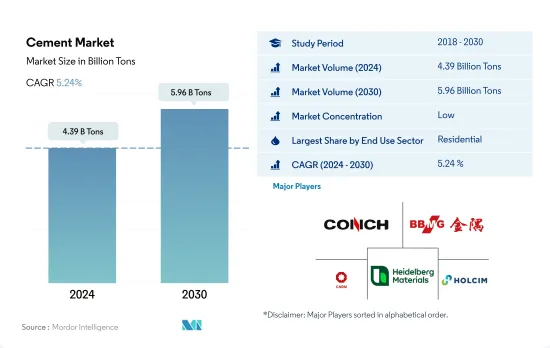
시멘트 시장 규모는 2024년에 43억 9,000만 톤으로 추정되고, 2030년에는 59억 6,000만 톤에 이를 것으로 예측되며, 예측 기간 중(2024-2030년)의 CAGR은 5.24%를 나타낼 것으로 예측됩니다.
상업 부문의 빠른 성장이 시멘트 수요 증가로 이어지고 있습니다.
매우 낮은 성장률과 건설 중인 신규 연면적의 감소로 인해 2022년 전 세계의 시멘트 수요는 2021년보다 약 3.83% 감소할 것으로 예상됩니다.
주거 부문은 전 세계에서 가장 큰 시멘트 소비처로, 대부분의 국가에서 콘크리트 주택을 보유하고 있어 이 부문에서 발생하는 대량의 시멘트 수요로 직접 전환됩니다. 시멘트 시장은 아시이평양 지역에서 가장 높은 수요를 경험하고 있습니다.
인프라는 대부분의 국가에서 시멘트 재고의 상당 부분을 사용하는 분야입니다. 시멘트는 도로, 댐, 항만 등 모든 부문의 인프라 건설에 필수적인 콘크리트의 주원료 중 하나입니다. 아시이평양 지역은 중국, 인도, 한국, 일본이 이 분야에서 가장 큰 시멘트 소비량을 차지하고 있습니다. 이들 국가는 2022년 이 지역 인프라 부문 시멘트 수요의 90%를 차지할 것으로 예상됩니다.
상업 부문의 시멘트 수요는 예측 기간 동안 6.18%의 연평균 성장률로 전 세계에서 가장 빠르게 증가할 것으로 예상되며 2030년에는 7억 6,460만 달러에 달할 것으로 전망됩니다.
건설 투자로 인한 중동 및 아프리카의 시멘트 수요 증가
2022년 전 세계의 시멘트 수요는 2021년 대비 3.83% 감소했으며, 이는 주로 아시이평양 지역의 6.37% 감소에 힘입은 결과입니다.
아시이평양 지역은 건설 프로젝트 규모에서 지속적으로 선두를 달리고 있으며, 2022년 5월 현재 2,500만 달러 이상의 인프라 프로젝트를 진행 중인 인도가 다른 국가를 제치고 압도적인 우위를 점하고 있습니다.
아시이평양에 이어 중동 및 아프리카가 시멘트의 주요 소비국으로 부상하고 있습니다. 사우디아라비아와 아랍에미리트는 정부의 인프라 및 부문별 대응에 대한 지속적인 투자에 힘입어 선두를 달리고 있습니다. 특히, 아랍에미리트의 인프라 투자는 2021년부터 2022년까지 82%나 급증했습니다.
예상 데이터에 따르면 중동 및 아프리카 지역은 예측 기간(2023-2030년) 동안 연평균 7.07%의 시멘트 수요 증가율을 기록하며 가장 높은 성장률을 보일 것으로 예상됩니다. 특히 사우디아라비아가 최근 체결한 총 26억 6,000만 달러에 달하는 계약과 양해각서는 상업, 관광, 주거 프로젝트 강화를 위한 투자 펀드 조성에 초점을 맞추고 있어 이 지역의 시멘트 수요를 더욱 촉진할 것으로 보입니다.
세계의 시멘트 시장 동향
아시이평양 지역의 대규모 오피스 빌딩 프로젝트 급증으로 전 세계 상업용 건축 연면적 증가 전망
2022년 전 세계 상업용 건축물의 신규 연면적은 전년 대비 0.15%의 소폭 성장을 기록했습니다. 유럽은 2030년 탄소 배출량 목표를 달성하기 위해 에너지 효율이 높은 오피스 빌딩을 추진하면서 12.70%의 큰 폭의 증가율을 기록해 눈에 띄었습니다. 직원들이 사무실로 복귀하면서 임대 결정을 재개한 유럽 기업들은 2022년에 450만 평방피트의 신규 오피스 공간 건설에 박차를 가했습니다.
코로나19 팬데믹으로 인해 인력과 자재 부족이 발생하면서 상업용 건설 프로젝트가 취소되거나 지연되었습니다.
향후 전 세계 상업용 신축 연면적은 4.56%의 연평균 성장률을 기록할 것으로 전망됩니다. 아시이평양 지역은 5.16%의 연평균 성장률로 다른 지역을 앞설 것으로 예상됩니다. 이러한 성장은 중국, 인도, 한국, 일본에서 상업용 건설 프로젝트가 급증한 데 힘입은 결과입니다. 특히 베이징, 상하이, 홍콩, 타이베이와 같은 중국의 주요 도시에서는 A등급 오피스 공간 건설이 증가할 것으로 예상됩니다. 또한 인도는 2023년부터 2025년까지 상위 7개 도시에서 약 2,325만 평방 피트에 이르는 약 60개의 쇼핑몰이 오픈하는 예 정입니다. 아시이평양 전역의 이러한 대처를 합계하면, 2030년까지 상업시설의 신규 바닥 면적은 2022년 대비 15억 6,000만 평방 피트 증가할 것으로 예측됩니다.
남미는 전 세계 주거 부문을 활성화하기 위한 정부의 저렴한 주택 공급 계획에 대한 투자 증가로 인해 주거용 건축이 가장 빠르게 성장할 것으로 예상됩니다.
2022년 전 세계 주거용 신축 연면적은 2021년에 비해 약 2억 8,900만 평방피트 감소했습니다. 이는 토지, 노동력 부족, 지속 불가능한 높은 건축 자재 가격 등으로 인해 발생한 주택 위기의 원인으로 볼 수 있습니다. 이러한 위기는 아시이평양 지역에 심각한 영향을 미쳤으며, 2021년 대비 2022년 신규 연면적이 5.39% 감소했습니다. 그러나 2023년에는 2030년까지 30억 명을 수용할 수 있는 저렴한 신규 주택 건설에 자금을 지원할 수 있는 정부 투자로 인해 전 세계 신규 연면적이 2022년에 비해 3.31% 증가할 것으로 예상됨에 따라 보다 긍정적인 전망이 예상됩니다.
코로나19 팬데믹으로 인한 경기 침체로 많은 주택 건설 프로젝트가 취소되거나 지연되면서 2020년 전 세계 신규 연면적은 2019년에 비해 4.79% 감소했습니다. 2021년에는 제한이 해제되고 주택 프로젝트에 대한 억눌린 수요가 풀리면서 2020년 대비 11.22% 성장했으며, 유럽이 18.28%로 가장 높은 성장률을 보였고 남미가 2020년 대비 2021년 17.36% 증가하며 그 뒤를 이었습니다.
전 세계 주거용 신축 연면적은 예측 기간 동안 3.81%의 연평균 성장률을 기록할 것으로 예상되며, 남미는 4.05%의 가장 빠른 연평균 성장률로 발전할 것으로 예측됩니다. 2023년에 발표된 브라질의 민하 카사 민하 비다(Minha Casa Minha Vida)와 같은 제도 및 노력은 몇 가지 규제 변경을 통해 저소득층을 위한 저렴한 주택을 제공하기 위해 정부가 19억 8,000만 달러를 투자할 계획이며, 칠레의 FOGAES도 2023년에 발표된 초기 투자금 5천만 달러로 가정에 저렴한 주택 모기지론을 제공하고 신규 주택 건설을 장려할 것입니다.
시멘트 산업 개요
시멘트 시장은 세분화되어 있으며 상위 5개 기업이 32.78%를 점유하고 있습니다. 이 시장의 주요 업체는 Anhui Conch Cement Company Limited, BBMG Corporation, China National Building Material Group Corporation, Heidelberg Materials Holcim (알파벳 순 정렬)입니다.
기타 혜택
엑셀 형식 시장 예측(ME) 시트
3개월의 애널리스트 지원
목차
제1장 주요 요약과 주요 조사 결과
제2장 보고서 제안
제3장 소개
조사의 전제조건과 시장 정의
조사 범위
조사 방법
제4장 주요 산업 동향
최종 용도 분야의 동향
상업
산업 및 시설
인프라
주택
주요 인프라 프로젝트(현재 및 발표됨)
규제 프레임워크
밸류체인 및 유통채널 분석
제5장 시장 세분화
최종 용도 분야
상업
산업 및 시설
인프라
주택
제품
혼합 시멘트
섬유 시멘트
일반 포틀랜드 시멘트
백색 시멘트
기타
지역
아시이평양
국가별
호주
중국
인도
인도네시아
일본
말레이시아
한국
태국
베트남
기타 아시이평양
유럽
국가별
프랑스
독일
이탈리아
러시아
스페인
영국
기타 유럽
중동 및 아프리카
국가별
사우디아라비아
아랍에미리트(UAE)
기타 중동 및 아프리카
북미
국가별
캐나다
멕시코
미국
남미
국가별
아르헨티나
브라질
기타 남미
제6장 경쟁 구도
주요 전략 동향
시장 점유율 분석
기업 상황
기업 프로파일
아다니 그룹
Anhui Conch Cement Company Limited
BBMG Corporation
CEMEX, SAB de CV
Cemros
China National Building Material Group Corporation
China Resource Cement Holdings
CRH
Dangote Cement Plc.
Heidelberg Materials
Holcim
SIG
TAIWAN CEMENT LTD.
UltraTech Cement Ltd.
Votorantim Cimentos
제7장 CEO에 대한 주요 전략적 질문
제8장 부록
세계 개요
개요
Five Forces 분석 프레임워크(산업 매력도 분석)
세계의 밸류체인 분석
시장 역학(DROs)
출처 및 참고문헌
도표 일람
주요 인사이트
데이터 팩
용어집
HBR
영문 목차
영문목차
The Cement Market size is estimated at 4.39 billion Tons in 2024, and is expected to reach 5.96 billion Tons by 2030, growing at a CAGR of 5.24% during the forecast period (2024-2030).
The commercial sector's fast-paced growth is leading to higher cement demand
The demand for cement across the sectors was reduced in 2022 over 2021, resulting in a nearly 3.83% lower demand worldwide due to very low growth and even declines in the new floor area under construction. As the demand across sectors was projected to rise in 2023, the overall increase was estimated to be 0.70% higher than in 2022.
The residential sector is the largest consumer of cement in the world, as most countries have concrete homes that directly convert to a large volume of cement demand from this sector. The cement market experiences the highest demand from Asia-Pacific. The region accounted for 67% of the world's total cement demand in 2022, owing to its vast population.
Infrastructure is the sector in which most countries utilize a significant portion of their cement stock. Cement is among the primary raw materials of concrete, which is essential for all types of infrastructure construction, such as roads, dams, ports, etc. Asia-Pacific accounts for the largest cement consumption in this sector, primarily due to China, India, South Korea, and Japan. These countries together constituted 90% of the region's infrastructure sector's cement demand in 2022.
Construction activities are expected to rise the fastest in the commercial sector. For instance, the new floor area of the commercial sector among all the sectors is poised to grow with the fastest CAGR of around 4.56% during the forecast period (2023-2030). Hence, the cement demand from the commercial sector is expected to increase the fastest globally at a CAGR of 6.18% during the forecast period and is expected to reach USD 764.6 million by 2030.
The demand for cement to rise in the Middle East & Africa owing to investments in construction
In 2022, global cement demand saw a 3.83% decline in volume compared to 2021, largely driven by a 6.37% drop in the Asia-Pacific region. Projections suggested that cement demand in 2023 would remain relatively steady, with the Asia-Pacific expected to witness a further decline.
The Asia-Pacific consistently leads in construction project volumes, exemplified by India's dominance with over USD 25 million worth of infrastructure projects in the pipeline as of May 2022, surpassing other nations. China and Australia followed closely in the third and fourth positions, respectively. Consequently, the Asia-Pacific stands as the global cement consumption hub.
Following the Asia-Pacific, the Middle East & Africa emerge as a significant consumer of cement. Saudi Arabia and the United Arab Emirates take the lead, buoyed by their governments' consistent investments in infrastructure and sector initiatives. Notably, infrastructure investments in the United Arab Emirates surged by 82% from 2021 to 2022. In 2022, Saudi Arabia and the United Arab Emirates accounted for 12% and 3% of the global cement volume, respectively.
Anticipated data indicates that the Middle East & Africa will witness the highest cement demand growth, registering a CAGR of 7.07% in volume during the forecast period (2023-2030). Notably, Saudi Arabia's recent agreements and MoUs, totaling nearly USD 2.66 billion, focus on establishing investment funds to bolster commercial, tourism, and residential projects, further fueling the cement demand in the region.
Global Cement Market Trends
Asia-Pacific's surge in large-scale office building projects is set to elevate the global floor area dedicated to commercial construction
In 2022, the global new floor area for commercial construction witnessed a modest growth of 0.15% from the previous year. Europe stood out with a significant surge of 12.70%, driven by a push for high-energy-efficient office buildings to align with its 2030 carbon emission targets. As employees returned to offices, European companies, resuming lease decisions, spurred the construction of 4.5 million square feet of new office space in 2022. This momentum is poised to persist in 2023, with a projected global growth rate of 4.26%.
The COVID-19 pandemic caused labor and material shortages, leading to cancellations and delays in commercial construction projects. However, as lockdowns eased and construction activities resumed, the global new floor area for commercial construction surged by 11.11% in 2021, with Asia-Pacific taking the lead with a growth rate of 20.98%.
Looking ahead, the global new floor area for commercial construction is set to achieve a CAGR of 4.56%. Asia-Pacific is anticipated to outpace other regions, with a projected CAGR of 5.16%. This growth is fueled by a flurry of commercial construction projects in China, India, South Korea, and Japan. Notably, major Chinese cities like Beijing, Shanghai, Hong Kong, and Taipei are gearing up for an uptick in Grade A office space construction. Additionally, India is set to witness the opening of approximately 60 shopping malls, spanning 23.25 million square feet, in its top seven cities between 2023 and 2025. Collectively, these endeavors across Asia-Pacific are expected to add a staggering 1.56 billion square feet to the new floor area for commercial construction by 2030, compared to 2022.
South America's estimated fastest growth in residential constructions due to increasing government investments in schemes for affordable housing to boost the global residential sector
In 2022, the global new floor area for residential construction declined by around 289 million square feet compared to 2021. This can be attributed to the housing crisis generated due to the shortage of land, labor, and unsustainably high construction materials prices. This crisis severely impacted Asia-Pacific, where the new floor area declined 5.39% in 2022 compared to 2021. However, a more positive outlook is expected in 2023 as the global new floor area is predicted to grow by 3.31% compared to 2022, owing to government investments that can finance the construction of new affordable homes capable of accommodating 3 billion people by 2030.
The COVID-19 pandemic caused an economic slowdown, due to which many residential construction projects got canceled or delayed, and the global new floor area declined by 4.79% in 2020 compared to 2019. As the restrictions were lifted in 2021 and pent-up demand for housing projects was released, new floor area grew 11.22% compared to 2020, with Europe having the highest growth of 18.28%, followed by South America, which rose 17.36% in 2021 compared to 2020.
The global new floor area for residential construction is expected to register a CAGR of 3.81% during the forecast period, with South America predicted to develop at the fastest CAGR of 4.05%. Schemes and initiatives like the Minha Casa Minha Vida in Brazil announced in 2023 with a few regulatory changes, for which the government plans an investment of USD 1.98 billion to provide affordable housing units for low-income families, and the FOGAES in Chile also publicized in 2023, with an initial investment of USD 50 million, are aimed at providing mortgage loans to families for affordable housing and will encourage the construction of new residential units.
Cement Industry Overview
The Cement Market is fragmented, with the top five companies occupying 32.78%. The major players in this market are Anhui Conch Cement Company Limited, BBMG Corporation, China National Building Material Group Corporation, Heidelberg Materials and Holcim (sorted alphabetically).
Additional Benefits:
The market estimate (ME) sheet in Excel format
3 months of analyst support
TABLE OF CONTENTS
1 EXECUTIVE SUMMARY & KEY FINDINGS
2 REPORT OFFERS
3 INTRODUCTION
3.1 Study Assumptions & Market Definition
3.2 Scope of the Study
3.3 Research Methodology
4 KEY INDUSTRY TRENDS
4.1 End Use Sector Trends
4.1.1 Commercial
4.1.2 Industrial and Institutional
4.1.3 Infrastructure
4.1.4 Residential
4.2 Major Infrastructure Projects (current And Announced)
4.3 Regulatory Framework
4.4 Value Chain & Distribution Channel Analysis
5 MARKET SEGMENTATION (includes market size, forecasts up to 2030 and analysis of growth prospects.)
5.1 End Use Sector
5.1.1 Commercial
5.1.2 Industrial and Institutional
5.1.3 Infrastructure
5.1.4 Residential
5.2 Product
5.2.1 Blended Cement
5.2.2 Fiber Cement
5.2.3 Ordinary Portland Cement
5.2.4 White Cement
5.2.5 Other Types
5.3 Region
5.3.1 Asia-Pacific
5.3.1.1 By Country
5.3.1.1.1 Australia
5.3.1.1.2 China
5.3.1.1.3 India
5.3.1.1.4 Indonesia
5.3.1.1.5 Japan
5.3.1.1.6 Malaysia
5.3.1.1.7 South Korea
5.3.1.1.8 Thailand
5.3.1.1.9 Vietnam
5.3.1.1.10 Rest of Asia-Pacific
5.3.2 Europe
5.3.2.1 By Country
5.3.2.1.1 France
5.3.2.1.2 Germany
5.3.2.1.3 Italy
5.3.2.1.4 Russia
5.3.2.1.5 Spain
5.3.2.1.6 United Kingdom
5.3.2.1.7 Rest of Europe
5.3.3 Middle East and Africa
5.3.3.1 By Country
5.3.3.1.1 Saudi Arabia
5.3.3.1.2 United Arab Emirates
5.3.3.1.3 Rest of Middle East and Africa
5.3.4 North America
5.3.4.1 By Country
5.3.4.1.1 Canada
5.3.4.1.2 Mexico
5.3.4.1.3 United States
5.3.5 South America
5.3.5.1 By Country
5.3.5.1.1 Argentina
5.3.5.1.2 Brazil
5.3.5.1.3 Rest of South America
6 COMPETITIVE LANDSCAPE
6.1 Key Strategic Moves
6.2 Market Share Analysis
6.3 Company Landscape
6.4 Company Profiles
6.4.1 Adani Group
6.4.2 Anhui Conch Cement Company Limited
6.4.3 BBMG Corporation
6.4.4 CEMEX, S.A.B. de C.V.
6.4.5 Cemros
6.4.6 China National Building Material Group Corporation
6.4.7 China Resource Cement Holdings
6.4.8 CRH
6.4.9 Dangote Cement Plc.
6.4.10 Heidelberg Materials
6.4.11 Holcim
6.4.12 SIG
6.4.13 TAIWAN CEMENT LTD.
6.4.14 UltraTech Cement Ltd.
6.4.15 Votorantim Cimentos
7 KEY STRATEGIC QUESTIONS FOR CONCRETE, MORTARS AND CONSTRUCTION CHEMICALS CEOS
8 APPENDIX
8.1 Global Overview
8.1.1 Overview
8.1.2 Porter's Five Forces Framework (Industry Attractiveness Analysis)