미국의 FTL(Full-Truck-Load) 시장 : 시장 점유율 분석, 산업 동향, 성장 예측(2025-2030년)
United States Full-Truck-Load (FTL) - Market Share Analysis, Industry Trends & Statistics, Growth Forecasts (2025 - 2030)
상품코드:1692140
리서치사:Mordor Intelligence
발행일:2025년 03월
페이지 정보:영문
라이선스 & 가격 (부가세 별도)
ㅁ Add-on 가능: 고객의 요청에 따라 일정한 범위 내에서 Customization이 가능합니다. 자세한 사항은 문의해 주시기 바랍니다.
ㅁ 보고서에 따라 최신 정보로 업데이트하여 보내드립니다. 배송기일은 문의해 주시기 바랍니다.
한글목차
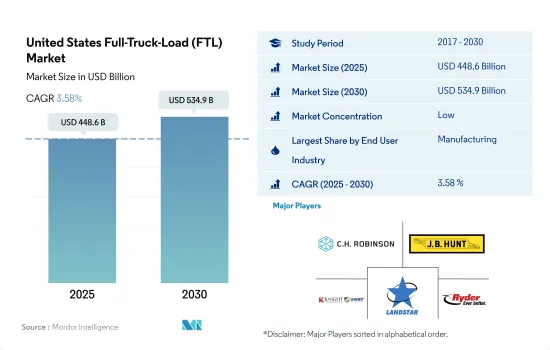
미국의 FTL(Full-Truck-Load) 시장 규모는 2025년에 4,486억 달러로 추정되고, 2030년에는 5,349억 달러에 이를 전망이며, 예측 기간인 2025-2030년 CAGR 3.58%로 성장할 것으로 예측됩니다.
제조업과 도매 및 소매업이 FTL 시장의 성장을 지지합니다.
FTL(Full-Truck-Load) 운송은 대량의 상품에 효율적이고 비용 효율적인 운송 솔루션을 제공함으로써 제조업에서 중요한 역할을 하고 있습니다. FTL은 대량의 화물을 1대의 트럭으로 운송할 수 있게 하여 생산 수요에 부응하는 데 이상적입니다. 미국의 제조업 부문은 2024년 초에 확대 기조로 돌아와 산업 활동의 회복과 운송 서비스에 대한 수요 증가를 나타내고 있습니다. 게다가 제조품 수출은 2024년 5월의 1119억 달러에서 2024년 6월에는 1130억 달러에 이르렀습니다. 마찬가지로 2024년 상반기 제조품 수출은 6,580억 달러에 달해 전년 동기 대비 2.62% 증가하며 FTL 서비스 수요를 견인했습니다.
건설 최종 사용자 부문은 향후 성장이 예상됩니다. 미국에서는 향후 여러 프로젝트가 건설될 전망입니다. 예를 들어, 루이지애나 주에서는 2022년 1월에 4억 6,300만 달러 상당의 건설 활동이 시작되어 8.3마일의 고가 고속도로가 추가되었습니다. 이 프로젝트의 최신 구간인 2단계는 2027년에 개통될 예정입니다. 또한 도로와 고속도로 인프라 프로젝트에 대한 지출은 향후 수년간 시장 성장을 뒷받침할 것으로 예상됩니다.
미국 FTL(Full-Truck-Load) 시장 동향
미국은 인프라와 공급망 투자가 견인해, 지역 GDP의 86%에 기여해 리드
2024년 9월 미국 운수부 산하의 FAA는 519개 프로젝트에 19억 달러의 보조금을 할당했습니다. 이 프로젝트들은 48개 주, 괌, 푸에르토리코, 기타 영토에 걸쳐 있으며 모두 공항 개선 프로그램(AIP)의 일부입니다. 게다가 2023년 추가 재량 보조금으로 2억 6,900만 달러가 미국 내 56개 공항에서 62개 프로젝트를 지원합니다. 이 경쟁 이니셔티브는 미국의 공항 시스템을 강화하기 위해 공항 소유자와 운영자를 지원하는 것입니다. 지금까지 최대 규모가 되는 이 제5회 AIP 보조금 사이클은 공항의 안전성과 지속 가능성 향상에서 소음 경감까지 다양한 프로젝트에 자금이 제공됩니다. 조성금은 규모에 관계없이 미국 전역의 공항을 대상으로 하고 있습니다.
인프라 개발 및 전자상거래 붐으로 인해 운수 및 창고 부문은 고용 급증이 예상되고 있습니다. 노동통계국(BLS)은 2022-2032년 연간 성장률을 0.8%로 예측하고 있으며, 이는 약 57만 명의 신규 고용에 해당합니다. 주목할 만한 것은 창고 및 보관업과 함께 택배 및 메신저업이 이 고용 증가의 약 80%를 견인할 것으로 예상되고 있다는 점입니다.
미국은 2022년에도 원유의 순수입국으로 80개국에서 약 628만 B/D의 원유를 수입했습니다.
미국의 휘발유 가격은 대통령 선거 직전인 2024년 10월까지 3년 이상 만에 1갤런당 3달러를 밑돈 것으로 평가되었습니다. 연료 가격의 저하는 주로 수요의 감퇴와 유가의 하락에 의한 것으로, 인플레이션을 부추기는 고비용에 직면하고 있던 소비자에게 안도감을 줍니다. 이는 또한 카말라 해리스 부통령과 다른 민주당 의원들이 높은 휘발유 가격에 대한 공화당의 비판에 맞서는 데 도움이 될 것으로 보입니다. 2024년 9월 휘발유 평균 가격은 갤런당 3.25달러로 지난달보다 19센트, 지난해보다 58센트 내렸습니다.
미국에너지정보국(EIA)에 따르면 2024년 원유 가격은 2023년에 비해 평평하고 2025년에는 하락합니다. 미국은 2023년 새로운 정제설비를 도입하기 위해 가동능력이 향상되고 2024년과 2025년 석유제품 가격에 대한 변형이 완화됩니다. 나아가 중동, 특히 쿠웨이트가 새로운 국제 정제 능력을 추가해 휘발유와 디젤의 세계 가격 압력을 완화하는 데 도움이 될 것으로 보입니다. 또한 2024년 크랙 스프레드 축소는 2024년과 2025년 모두 미국의 평균 소매 연료 가격 하락으로 이어질 것으로 예상됩니다. 휘발유 가격은 2024년에 3.36달러/갤런, 2025년에 3.24달러/갤런으로 예측됩니다.
미국의 FTL(Full-Truck-Load) 산업 개요
미국의 FTL(Full-Truck-Load) 시장은 단편화되고 있으며, 이 시장의 주요 5개사는 CH Robinson, JB Hunt Transport, Inc., Knight-Swift Transportation Holdings Inc., Landstar System Inc., Ryder System, Inc.입니다(알파벳순 정렬).
기타 혜택 :
엑셀 형식 시장 예측(ME) 시트
3개월간의 애널리스트 서포트
목차
제1장 주요 요약 및 주요 조사 결과
제2장 보고서 제안
제3장 서문
조사의 전제조건 및 시장 정의
조사 범위
조사 방법
제4장 주요 산업 동향
경제 활동별 GDP 분포
경제 활동별 GDP 성장률
경제성과 및 프로파일
전자상거래 산업의 동향
제조업의 동향
운수 및 창고업의 GDP
물류 실적
도로 길이
수출 동향
수입 동향
연료 가격 동향
트럭 운송 비용
유형별 트럭 보유 대수
주요 트럭 공급업체
도로화물 톤수의 동향
도로화물 가격 동향
모달 점유율
인플레이션율
규제 프레임워크
밸류체인 및 유통채널 분석
제5장 시장 세분화
최종 사용자 산업별
농업, 어업 및 임업
건설업
제조업
석유 및 가스, 광업, 채석업
도매 및 소매업
기타
수출처별
국내
해외
제6장 경쟁 구도
주요 전략 동향
시장 점유율 분석
기업 상황
기업 프로파일
ArcBest
CH Robinson
DHL Group
JB Hunt Transport, Inc.
Knight-Swift Transportation Holdings Inc.
Landstar System Inc.
Ryder System, Inc.
United Parcel Service of America, Inc.(UPS)
Werner Enterprises Inc.
제7장 CEO에 대한 주요 전략적 질문
제8장 부록
세계 물류 시장 개요
개요
Porter's Five Forces 분석 프레임워크
세계 밸류체인 분석
시장 역학(시장 성장 촉진요인, 억제요인, 기회)
정보원 및 참고문헌
도표 일람
주요 인사이트
데이터 팩
용어집
환율
AJY
영문 목차
영문목차
The United States Full-Truck-Load (FTL) Market size is estimated at 448.6 billion USD in 2025, and is expected to reach 534.9 billion USD by 2030, growing at a CAGR of 3.58% during the forecast period (2025-2030).
The manufacturing and wholesale & retail trade sectors support the growth of the full truckload market
FTL (Full-Truck-load) transport plays a crucial role in the manufacturing industry by providing efficient, cost-effective transportation solutions for large volumes of goods. FTL trucking allows for the transportation of bulk shipments in a single truck, which is ideal for meeting production demands. The US manufacturing sector returned to expansion in early 2024, signaling a recovery in industrial activity and increased demand for transportation services. Moreover, manufactured goods exports reached USD 113 billion in June 2024, up from USD 111.9 billion in May 2024. Similarly, in the first six months of 2024, manufactured goods exports reached USD 658 billion, up 2.62% compared to the same period last year, which drove the demand for FTL services.
The construction end-user segment is expected to experience growth in the future. Several projects are expected to go under construction in the United States. For instance, construction activities worth USD 463 million began in January 2022, adding 8.3 miles of elevated highway in Louisiana. The latest section, Phase 2 of the project, is expected to open in 2027. Moreover, spending on roads and highway infrastructure projects is anticipated to support market growth over the coming years.
United States Full-Truck-Load (FTL) Market Trends
United States leads regional GDP with 86% contribution, driven by infrastructure and supply chain investments
In September 2024, the FAA, under the US Department of Transportation, allocated USD 1.9 billion in grants for 519 projects. These projects span 48 states, Guam, Puerto Rico, and other territories, all part of the Airport Improvement Program (AIP). Additionally, USD 269 million in Supplemental Discretionary Grants for 2023 will back 62 projects at 56 U.S. airports. This competitive initiative aids airport owners and operators in enhancing the U.S. airport system. Marking its largest round yet, this fifth AIP grant cycle funds diverse projects, from airport safety and sustainability upgrades to noise reduction. The grants cater to airports nationwide, regardless of size.
With infrastructure development and the e-commerce boom, the transportation and storage sector is set for a job surge. The Bureau of Labor Statistics (BLS) projects a 0.8% annual growth rate from 2022 to 2032, translating to nearly 570,000 new jobs. Notably, the couriers and messengers industry, alongside warehousing and storage, is expected to drive about 80% of this job growth.
The United States remained a net crude oil importer in 2022, importing about 6.28 million bpd of crude oil from 80 countries
Gasoline prices in the US are expected to drop below USD 3 a gallon for the first time in over three years by October 2024, just before the presidential election. Lower fuel prices are mainly due to weaker demand and falling oil prices, providing relief to consumers who have faced high costs that fueled inflation. This could also help Vice President Kamala Harris and other Democrats counter Republican criticism over high gas prices. In September 2024, the average price for regular gas was USD 3.25 a gallon, down 19 cents from last month and 58 cents from last year.
According to US Energy Information Administration (EIA), crude oil prices will stay steady in 2024 compared to 2023, then decrease in 2025. The US' introduction of new refining capacities in 2023 will boost its operable capacity, alleviating price strain on oil products in 2024 and 2025. Furthermore, the Middle East, particularly Kuwait, will add new international refining capacities, which will help ease global price pressure on gasoline and diesel. Also, it is expected, narrowing crack spreads in 2024 are likely to lead to lower average US retail fuel prices in both 2024 and 2025. Gasoline prices are projected to USD 3.36/gal in 2024 and USD 3.24/gal in 2025.
United States Full-Truck-Load (FTL) Industry Overview
The United States Full-Truck-Load (FTL) Market is fragmented, with the major five players in this market being C.H. Robinson, J.B. Hunt Transport, Inc., Knight-Swift Transportation Holdings Inc., Landstar System Inc. and Ryder System, Inc. (sorted alphabetically).
Additional Benefits:
The market estimate (ME) sheet in Excel format
3 months of analyst support
TABLE OF CONTENTS
1 EXECUTIVE SUMMARY & KEY FINDINGS
2 REPORT OFFERS
3 INTRODUCTION
3.1 Study Assumptions & Market Definition
3.2 Scope of the Study
3.3 Research Methodology
4 KEY INDUSTRY TRENDS
4.1 GDP Distribution By Economic Activity
4.2 GDP Growth By Economic Activity
4.3 Economic Performance And Profile
4.3.1 Trends in E-Commerce Industry
4.3.2 Trends in Manufacturing Industry
4.4 Transport And Storage Sector GDP
4.5 Logistics Performance
4.6 Length Of Roads
4.7 Export Trends
4.8 Import Trends
4.9 Fuel Pricing Trends
4.10 Trucking Operational Costs
4.11 Trucking Fleet Size By Type
4.12 Major Truck Suppliers
4.13 Road Freight Tonnage Trends
4.14 Road Freight Pricing Trends
4.15 Modal Share
4.16 Inflation
4.17 Regulatory Framework
4.18 Value Chain & Distribution Channel Analysis
5 MARKET SEGMENTATION (includes market size in Value in USD, Forecasts up to 2030 and analysis of growth prospects)
5.1 End User Industry
5.1.1 Agriculture, Fishing, and Forestry
5.1.2 Construction
5.1.3 Manufacturing
5.1.4 Oil and Gas, Mining and Quarrying
5.1.5 Wholesale and Retail Trade
5.1.6 Others
5.2 Destination
5.2.1 Domestic
5.2.2 International
6 COMPETITIVE LANDSCAPE
6.1 Key Strategic Moves
6.2 Market Share Analysis
6.3 Company Landscape
6.4 Company Profiles
6.4.1 ArcBest
6.4.2 C.H. Robinson
6.4.3 DHL Group
6.4.4 J.B. Hunt Transport, Inc.
6.4.5 Knight-Swift Transportation Holdings Inc.
6.4.6 Landstar System Inc.
6.4.7 Ryder System, Inc.
6.4.8 United Parcel Service of America, Inc. (UPS)